
西北太平洋夏季海洋热浪的变化特征及海气关系
|
缪予晴(1995—), 女, 江苏省无锡市人, 硕士, 从事海气相互作用研究。email: |
Copy editor: 姚衍桃
收稿日期: 2020-02-13
要求修回日期: 2020-03-23
网络出版日期: 2020-04-16
基金资助
国家自然科学基金项目(41975016)
版权
Variation of summer marine heatwaves in the Northwest Pacific and associated air-sea interaction
Received date: 2020-02-13
Request revised date: 2020-03-23
Online published: 2020-04-16
Supported by
National Natural Science Foundation of China(41975016)
Copyright
全球增暖背景下更加频繁和持续的海洋热浪事件已经对生态和人类社会经济造成了严重影响。但对于海洋热浪的海气相互关系和对区域气候制作用的研究还十分有限。本文基于1982—2017年美国国家海洋和大气管理局逐日最佳插值海表温度和美国国家环境预测中心再分析资料, 采用经验正交函数展开等统计方法, 系统地分析了西北太平洋夏季海洋热浪的时空分布特征及与之相联系的海气关系。结果表明, 西北太平洋夏季海洋热浪日数和次数EOF(Empirical orthogonal function)第一模态在除黑潮和黑潮延伸区外的区域呈线性增加趋势, 第二模态则呈南北反向分布, 并具有明显的年代际变化特征。海洋热浪的最大强度、持续时间、累积强度第一模态也呈线性上升趋势, 最大强度和累积强度在高纬地区上升最多, 持续时间在黑潮和黑潮延伸区变化最明显。从海气关系的角度来看, 中低纬地区出现海洋热浪事件时, 海气之间主要表现为海洋对大气潜热感热通量的增加, 从而对周边区域大气环流产生影响; 而高纬度地区出现海洋热浪事件时, 海气之间则主要表现为大气对海洋的影响, 以长波辐射和感热通量变化为主。
缪予晴 , 徐海明 , 刘佳伟 . 西北太平洋夏季海洋热浪的变化特征及海气关系[J]. 热带海洋学报, 2021 , 40(1) : 31 -43 . DOI: 10.11978/2020016
More frequent and persistent marine heatwaves (MHWs) under global warming have exerted severe ecological and socioeconomic impacts. However, there are still limited studies on the air-sea interaction related to MHWs and how MHWs modulate regional climate. Spatiotemporal distribution of summer MHWs in the Northwest Pacific (NWP) and associated air-sea interaction were systematically studied based on daily Optimum Interpolation Sea Surface Temperature (OI SST) dataset from the National Oceanic and Atmospheric Administration (NOAA) and reanalysis dataset from the National Centers for Environmental Prediction (NCEP) during the period of 1982-2017. Empirical orthogonal function (EOF) analysis of MHWs' frequency shows a linear increasing trend in the first mode except for the Kuroshio extension region, while a north-south “dipole” pattern appears in the second mode, with characteristic of inter-decadal oscillation. Maximum intensity, duration, and cumulative intensity of MHWs all show a linear increasing trend. Maximum intensity and cumulative intensity rise most in the high latitudes, and the duration of MHWs varies significantly in the Kuroshio extension region. Analysis of air-sea interaction illustrates that, when MHWs occur in the mid or low latitudes, latent heat and sensible heat fluxes from the ocean to the overlying atmosphere play a dominant role, which impacts atmospheric circulation in the surrounding area. The atmospheric forcing is more significant when MHWs occur in the high latitudes, including longwave radiation and sensible heat fluxes.
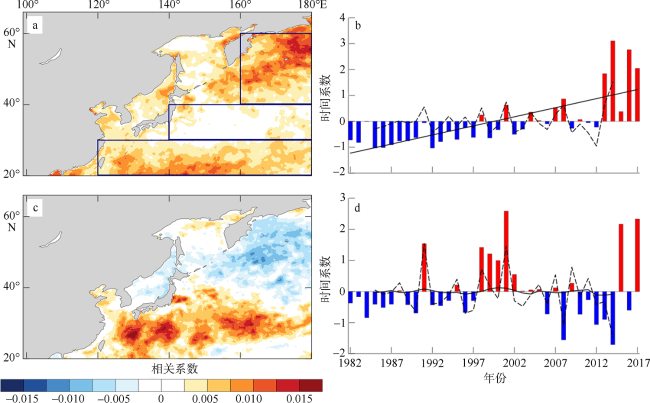
图1 西北太平洋夏季海洋热浪日数的第一模态空间分布(a)和对应的时间序列(b), 以及第二模态空间分布(c)和对应的时间序列(d)图a中3个蓝色方框分别表示高、中、低纬分区; 图b中实线表示线性趋势, 虚线表示年际变化; 图d中实线表示年代际变化, 虚线表示年际变化。审图号为GS(2016)1561 Fig. 1 Spatiotemporal distribution of summer MHWs' days in NWP: spatial distribution of the first mode (a), corresponding time series (b), spatial distribution of the second mode (c), and corresponding time series (d) |
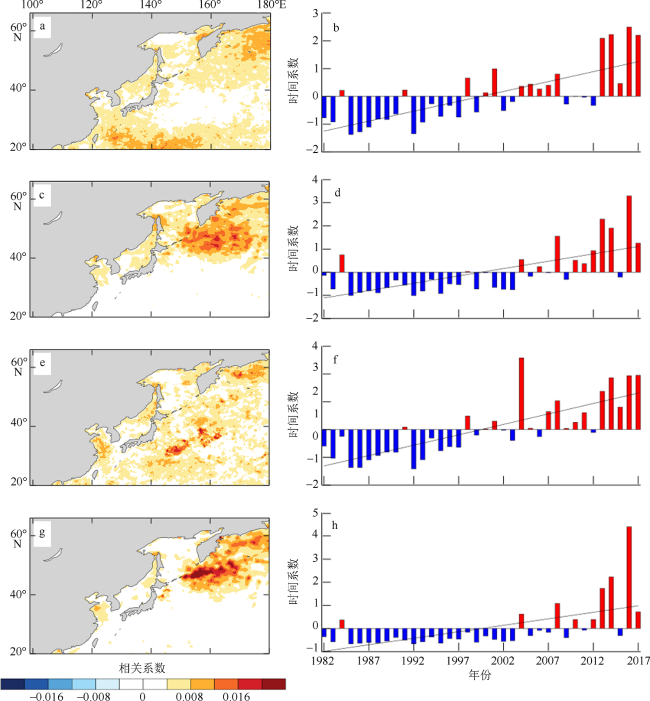
图2 西北太平洋夏季海洋热浪次数(a、b)、最大强度(c、d)、持续时间(e、f)和累积强度主模态(g、h)的时空分布图a、c、e、g为空间分布, 图b、d、f、h为相应的时间序列。审图号为GS(2016)1561 Fig. 2 Spatial distribution (left panels) and time series (right panels) of summer MHWs' frequency (a, b), maximum intensity (c, d), duration (e, f), and cumulative intensity (g, h) in the NWP |
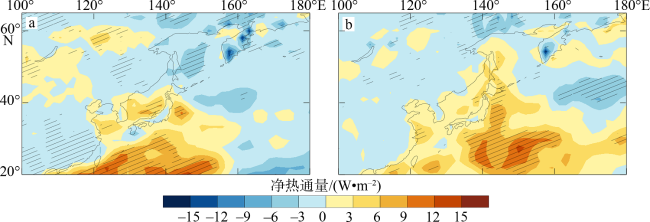
图4 回归到海洋热浪日数第一模态时间序列(a)和第二模态时间序列(b)上的夏季平均表面净热通量异常场通量向上为正值; 图中斜线区表示通过95%显著性检验的区域。审图号为GS(2016)1561 Fig. 4 Anomalous net flux (units: W·m-2, upward being positive) field regressed onto time series of the first mode (a) and the second mode (b) of MHWs' days. The hatched area indicates that the anomalous field passes the 95% confidence test |
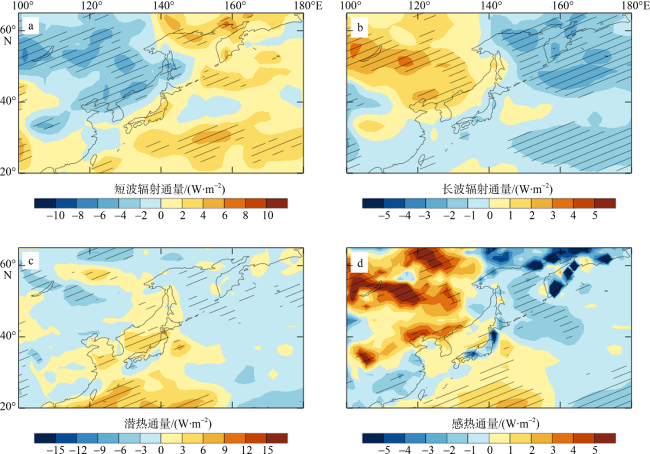
图5 回归到海洋热浪日数第一模态时间序列上的夏季平均短波辐射(a)、长波辐射(b)、潜热(c)、感热(d)通量异常场通量向上为正值; 图中斜线区表示通过95%显著性检验的区域。审图号为GS(2016)1561 Fig. 5 Anomalous shortwave radiation (a), longwave radiation (b), latent heat (c), sensible heat (d) fluxes (units: W·m-2, upward being positive) fields regressed onto time series of the first mode of MHWs' days. Hatching indicates that the anomalous field passes the 95% confidence test |
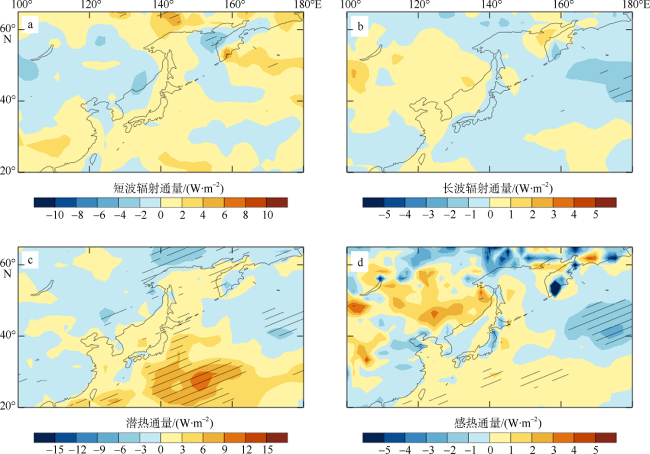
图6 回归到海洋热浪日数第二模态时间序列上的夏季平均短波辐射(a)、长波辐射(b)、潜热(c)、感热(d)通量异常场通量向上为正值; 图中斜线区表示通过95%显著性检验的区域。审图号为GS(2016)1561 Fig. 6 Anomalous shortwave radiation (a), longwave radiation (b), latent heat (c), sensible heat (d) fluxes (units: W·m-2, upward being positive) fields regressed onto time series of the second mode of MHWs' days. Hatching indicates that the anomalous field passes the 95% confidence test |
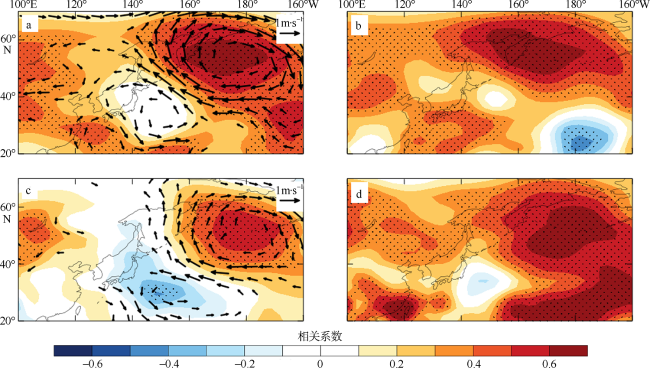
图7 夏季500hPa高度场(a)、500hPa温度场(b)、850hPa高度场(c)、850hPa温度场(d)与海洋热浪日数第一模态时间序列的相关系数分布图中矢量表示回归到海洋热浪日数第一模态时间序列上的风异常场(单位: m·s-1), 打点区表示通过95%显著性检验的区域。审图号为GS(2016)1561 Fig. 7 Distribution of correlation coefficient between atmospheric circulation field and time series of the first mode of MHWs' days: 500-hPa geopotential height (a), 500-hPa air temperature (b), 850-hPa geopotential height (c), and 850-hPa air temperature (d). Vector indicates anomalous wind (units: m·s-1) field regressed onto the time series. Stippling indicates that correlation coefficient passes the 95% confidence test |
图8 夏季500hPa高度场(a)、500hPa温度场(b)、850hPa高度场(c)、850hPa温度场(d)与海洋热浪日数第一模态时间序列线性趋势的相关系数分布Fig. 8 Distribution of correlation coefficient between atmospheric circulation field and linear trend of the first mode of MHWs' days: 500-hPa geopotential height (a), 500-hPa air temperature (b), 850-hPa geopotential height (c), and 850-hPa air temperature (d). Vector indicates anomalous wind (units: m·s-1) field regressed onto the time series. Stippling indicates that correlation coefficient passes the 95% confidence test 图中矢量表示回归到海洋热浪日数第一模态时间序列线性趋势上的风异常场(单位: m·s-1), 打点区表示通过95%显著性检验的区域。审图号为GS(2016)1561 |
图9 夏季500hPa高度场(a)、500hPa温度场(b)、850hPa高度场(c)、850hPa温度场(d)与海洋热浪日数第一模态时间序列年际变化的相关系数分布图中矢量表示回归到海洋热浪日数第一模态时间序列年际变化上的风异常场(单位: m·s-1), 打点区表示通过95%显著性检验的区域。审图号为GS(2016)1561 Fig. 9 Distribution of correlation coefficient between atmospheric circulation field and inter-annual variability of the first mode of MHWs' days: 500-hPa geopotential height (a), 500-hPa air temperature (b), 850-hPa geopotential height (c), and 850-hPa air temperature (d). Vector indicates anomalous wind (units: m·s-1) field regressed onto the time series. Stippling indicates that correlation coefficient passes the 95% confidence test |
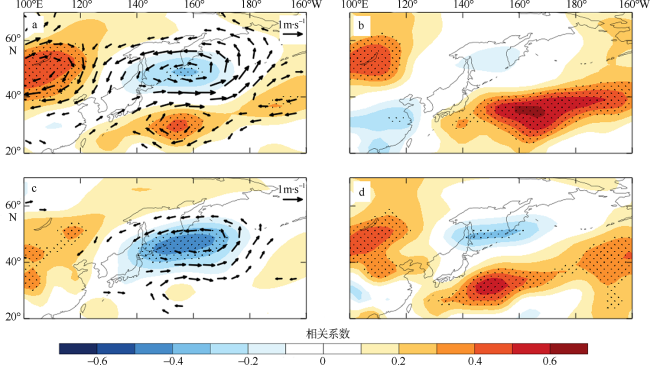
图10 夏季500hPa高度场(a)、500hPa温度场(b)、850hPa高度场(c)、850hPa温度场(d)与海洋热浪日数第二模态时间序列的相关系数分布图中矢量表示回归到海洋热浪日数第二模态时间序列上的风异常场(单位: m·s-1), 打点区表示通过95%显著性检验的区域。审图号为GS(2016)1561 Fig. 10 Distribution of correlation coefficient between atmospheric circulation field and time series of the second mode of MHWs' days: 500-hPa geopotential height (a), 500-hPa air temperature (b), 850-hPa geopotential height (c), and 850-hPa air temperature (d). Vector indicates anomalous wind (units: m·s-1) field regressed onto the time series. Stippling indicates that correlation coefficient passes the 95% confidence test |
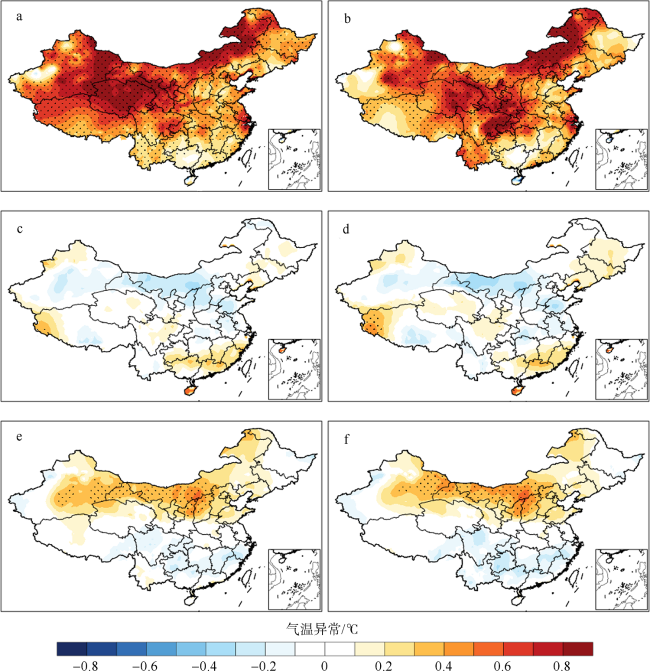
图11 回归到海洋热浪日数第一模态线性趋势(a、b)、第一模态年际变化(c、d)和第二模态时间序列(e、f)的中国夏季气温异常场图a、c、e为平均气温异常, 图b、d、f为最高气温异常; 打点区表示通过95%显著性检验的区域。审图号为GS(2016)1665 Fig. 11 Anomalous summer air temperature(units: °C) field in China regressed onto the linear trend of the first mode (a, b), inter-annual variability of the first mode (c, d), and time series of the second mode (e, f) of MHWs' days. Stippling indicates that the anomalous field passes the 95% confidence test |
| [1] |
李泓, 李丽平, 王盘兴, 2001. 太平洋地区海气系统年代际变率研究的若干进展[J]. 南京气象学院学报, 24(4):591-598.
|
| [2] |
叶殿秀, 尹继福, 陈正洪, 等, 2013. 1961—2010年我国夏季高温热浪的时空变化特征[J]. 气候变化研究进展, 9(1):15-20.
|
| [3] |
|
| [4] |
|
| [5] |
|
| [6] |
|
| [7] |
|
| [8] |
|
| [9] |
|
| [10] |
|
| [11] |
|
| [12] |
IPCC, 2012. Managing the risks of extreme events and disasters to advance climate change adaptation[R]. London: Cambridge University Press.
|
| [13] |
|
| [14] |
|
| [15] |
|
| [16] |
|
| [17] |
|
| [18] |
|
| [19] |
|
| [20] |
|
| [21] |
|
| [22] |
|
| [23] |
|
| [24] |
|
| [25] |
|
| [26] |
|
| [27] |
|
| [28] |
|
/
| 〈 |
|
〉 |


