
南海西部夏季上升流锋面的次中尺度特征分析
|
黄小龙(1992—), 男, 广东省信宜市人, 硕士研究生, 主要从事上层海洋次中尺度过程研究。E-mail: |
收稿日期: 2019-09-12
要求修回日期: 2019-12-20
网络出版日期: 2020-05-19
基金资助
中国科学院基础前沿科学研究计划原始创新项目(ZDBS-LY-DQC011)
国家自然科学基金项目(41776040)
中国科学院南海生态环境工程创新研究院自主部署项目(ISEE2018PY05)
青岛海洋科学与技术试点国家实验室OCFL功能实验室开放课题(OCFL-201804)
广州市科学研究计划(201904010420)
版权
Analysis of submesoscale characteristics of summer upwelling fronts in the western South China Sea
Received date: 2019-09-12
Request revised date: 2019-12-20
Online published: 2020-05-19
Supported by
Original Innovation Project of Basic Frontier Scientific Research Program of CAS(ZDBS-LY-DQC011)
National Natural Science Foundation of China(41776040)
Innovation Academy of South China Sea Ecology and Environmental Engineering, CAS(ISEE2018PY05)
Laboratory for Ocean Dynamics and Climate, Pilot Qingdao National Laboratory for Marine Science and Technology(OCFL-201804)
Guangzhou Science and Technology Project(201904010420)
Copyright
利用卫星遥感资料和区域海洋数值模式ROMS(regional ocean modeling system)高分辨率数值模拟结果, 对南海西部夏季上升流锋面的次中尺度特征及其非地转过程进行了探讨。高分辨率卫星遥感观测和数值模拟结果显示, 南海西部夏季锋面海域存在活跃的次中尺度现象, 其水平尺度约为1~10km, 且具有O(1)罗斯贝数(Rossby number, Ro)的典型次中尺度动力学特征。进一步的诊断分析表明, 在夏季西南风的驱动下, 沿锋面射流方向的风应力(down-front wind stress)引起的跨锋面埃克曼输运有利于将海水由锋面冷水侧向暖水侧输运, 减小了锋面海域的垂向层结和Ertel位涡, 加剧了锋面的不稳定, 并形成跨锋面的垂向次级环流。高分辨率模拟结果显示, 锋面海域最大垂向流速可达100m∙d -1, 显著增强了上层海洋的垂向物质交换。因此, 活跃在锋面海域的次中尺度过程可能是增强南海西部上升流海域垂向物质交换的重要贡献者。
黄小龙 , 经志友 , 郑瑞玺 , 张旭 . 南海西部夏季上升流锋面的次中尺度特征分析[J]. 热带海洋学报, 2020 , 39(3) : 1 -9 . DOI: 10.11978/2019086
We investigate submesoscale characteristics of summer upwelling fronts in the western South China Sea (WSCS) and associated ageostrophic processes by using satellite measurements and high-resolution ROMS simulations. Active submesoscale filaments with a typical horizontal scale of O(1-10) km are detected to be characterized by O(1) Rossby number (Ro) from the fine-resolution satellite images and simulation results. The diagnostic analysis shows that down-front wind forcing drives a net cross-front Ekman transport and advects heavy water over light water. This process at submesoscale tends to reduce the stratification and potential vorticity (PV), exacerbates the frontal instabilities, and forms the cross-front secondary circulation. The high-resolution simulation results show that the maximum vertical velocity in the frontal zone can reach 100m∙d -1, which significantly enhances vertical material exchange. In this context, active submesoscale processes may contribute to enhanced vertical exchanges of the upper ocean in the summer upwelling front of the western SCS.
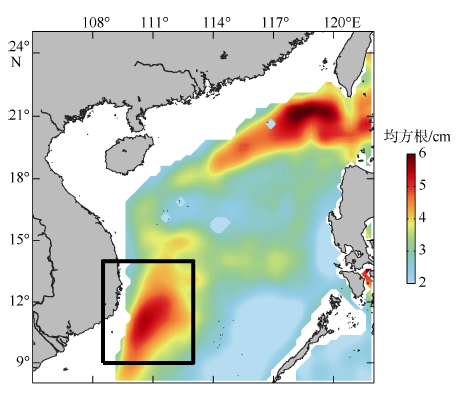
图1 南海海表面高度均方根的空间分布黑色矩形框表示文本研究区域;地图来自Matlab软件自带底图,下同 Fig. 1 Spatial distribution of SSH root mean square(rms) in the South China Sea(SCS). The research domain is delineated by the black box |
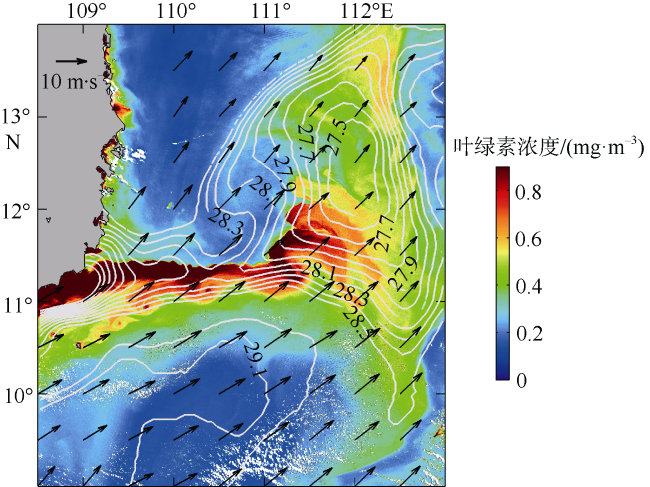
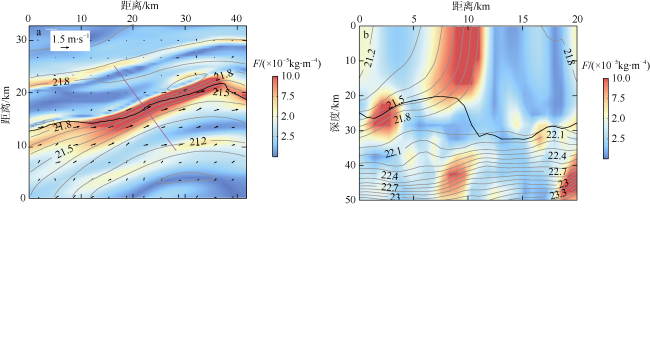
图5 典型锋面区域锋面强度F、地转流ug(箭头)和海水密度(灰色等值线, 单位: kg·m-3)的水平分布(a)和断面分布(b)a中紫红色实线表示断面位置, 黑色实线表示流轴; b中黑色实线表示混合层深度 Fig. 5 Spatial distribution of the intensity of front: horizontal distribution (a) and vertical profile (b). The geostrophic flows (vector) and density (grey contour) are also shown. Black line is the jet axis in (a) and the mixed layer depth in (b). The location of the vertical profile is shown by the magenta line in (a) |
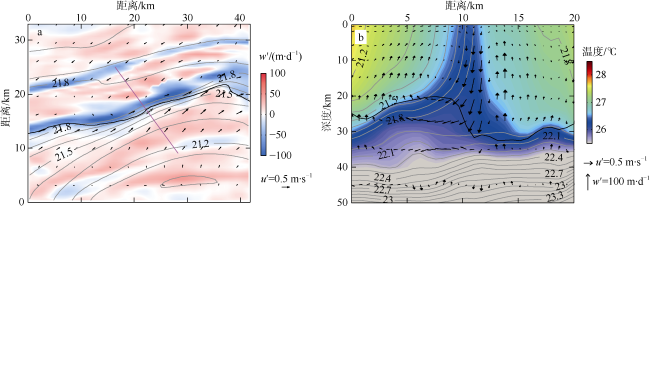
图6 10m层垂向流速异常的水平和垂向分布a. 垂向流速异常w′(填色)、水平流速异常u′(箭头)和海水密度(等值线, 单位: kg·m-3)的水平分布; b. 断面温度(填色)、跨锋面和垂向流速异常(箭头)、海水密度(等值线, 单位: kg·m-3)分布; a中紫红色实线表示断面位置; 黑色实线表示流轴; b中黑色实线表示混合层深度 Fig. 6 Map (a) and vertical (b) profile of vertical velocity anomaly at 10 m. (a) Black arrows refer to surface currents anomalies. Magenta line indicates the section for the vertical profile, and black line indicates the jet axis. (b) Shading denotes temperature, and black vector represents the cross-front and vertical velocity anomaly. Black line represents mixed layer depth. Grey contour is for density |
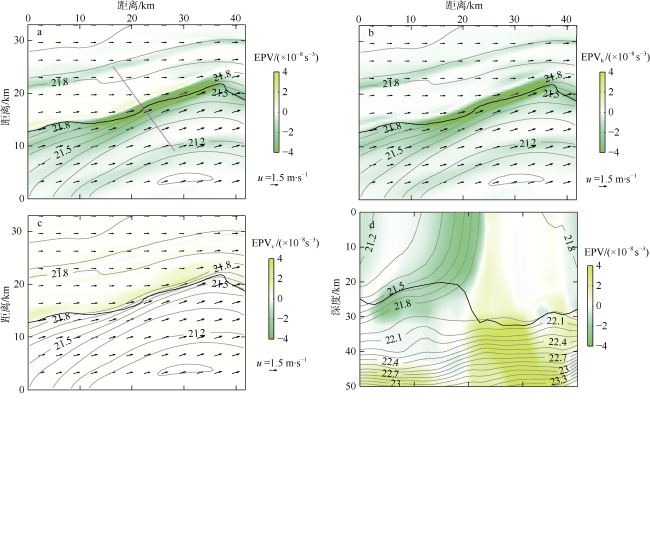
图7 典型锋面海域Ertel位涡(填色)、表层流u(箭头)和海水密度(灰色等值线)分布 a—c分别表示Ertel位涡(EPV)、Ertel位涡水平分量(EPVh)和Ertel位涡垂向分量(EPVv)的水平分布, 黑色实线表示流轴; d为Ertel位涡断面分布, 断面位置如a中紫红色实线所示, 黑色实线表示混合层深度, 灰色等值线为密度(单位: kg·m-3)Fig. 7 Snapshot of the Ertel PV. (a-c) are the EPV, EPVh and EPVv, respectively. The black line represents the jet axis. Black arrows denote surface currents. (d) is vertical distribution of EPV. The location of the vertical section is shown by the magenta line in (a). Black line represents mixed layer depth |
| 1 |
范植松 , 2002. 海洋内部混合研究基础[M]. 北京: 海洋出版社: 7-10.
|
| 2 |
冀承振, 叶瑞杰, 董济海 , 等, 2017. 南海中尺度涡边缘亚中尺度过程模式研究[J]. 中国海洋大学学报, 47(1):1-6
|
| 3 |
|
| 4 |
|
| 5 |
|
| 6 |
|
| 7 |
|
| 8 |
|
| 9 |
|
| 10 |
|
| 11 |
|
| 12 |
|
| 13 |
|
| 14 |
|
| 15 |
|
| 16 |
|
| 17 |
|
| 18 |
|
| 19 |
|
| 20 |
|
| 21 |
|
| 22 |
|
| 23 |
|
| 24 |
|
| 25 |
|
| 26 |
|
| 27 |
|
| 28 |
|
| 29 |
|
| 30 |
|
| 31 |
|
| 32 |
|
| 33 |
|
| 34 |
|
| 35 |
|
| 36 |
|
| 37 |
|
| 38 |
|
| 39 |
|
| 40 |
|
| 41 |
|
| 42 |
|
| 43 |
|
| 44 |
|
| 45 |
|
| 46 |
|
| 47 |
|
| 48 |
|
| 49 |
|
| 50 |
|
| 51 |
|
| 52 |
|
| 53 |
|
| 54 |
|
| 55 |
|
/
| 〈 |
|
〉 |
