
广东沿海红树林区水质变化特征与富营养状态评估
|
INYANG Aniefiok Ini(1985—), 男, 尼日利亚, 博士研究生, 从事海洋生态学研究。email: |
Copy editor: 林强
收稿日期: 2021-08-28
修回日期: 2022-10-19
网络出版日期: 2021-10-20
基金资助
国家重点研发计划项目(国家科技基础资源调查专项)(2017FY100700)
国家自然科学基金重点项目(U1901211)
国家自然科学基金重点项目(41876126)
国际伙伴计划(133244KYSB20180012)
南方海洋科学与工程广东省实验室(广州)人才团队引进重大专项(GML2019ZD0305)
中国科学院A类战略性先导科技专项(XDA23050200)
Characteristics of water quality and their eutrophication assessment on the mangrove ecosystems along the Guangdong coast
Copy editor: LIN Qiang
Received date: 2021-08-28
Revised date: 2022-10-19
Online published: 2021-10-20
Supported by
National Key Research and Development Plan(2017FY100700)
National Natural Science Foundation of China(U1901211)
National Natural Science Foundation of China(41876126)
International Partnership Program of Chinese Academy of Sciences(133244KYSB20180012)
Key Special Project for Introduced Talents Team of Southern Marine Science and Engineering Guangdong Laboratory (Guangzhou)(GML2019ZD0305)
Strategic Priority Research Program of the Chinese Academy of Sciences(XDA23050200)
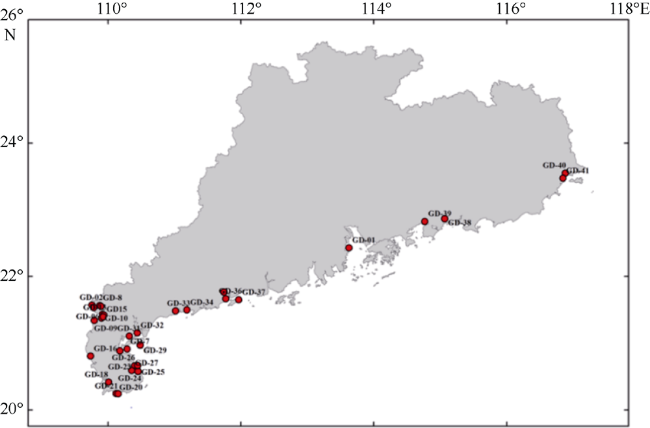
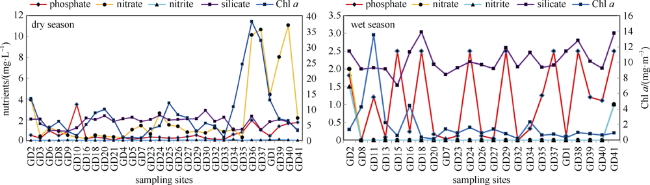
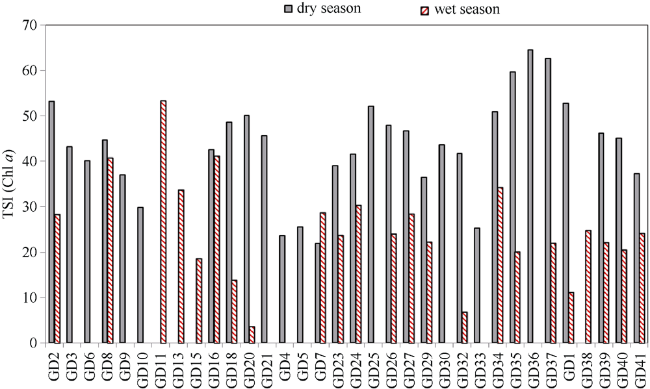
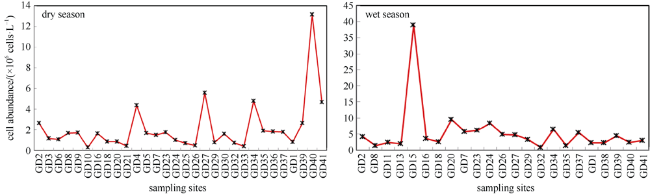
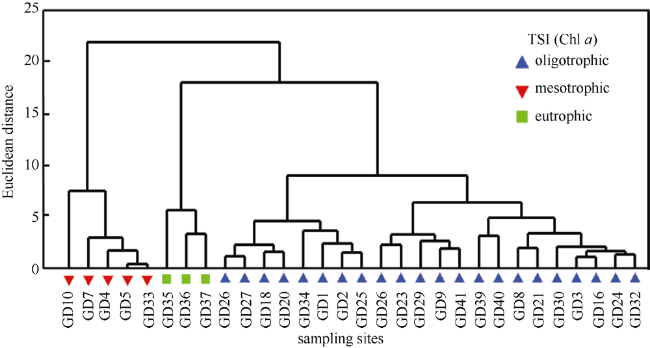
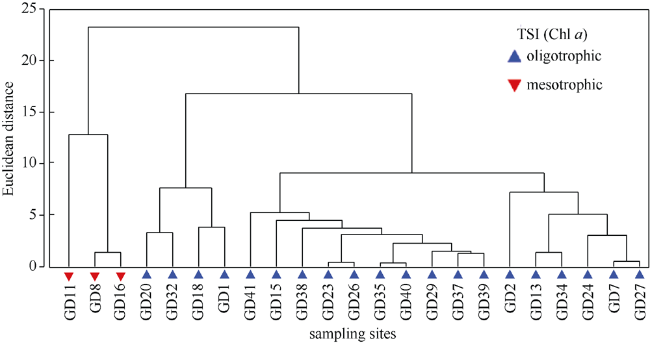
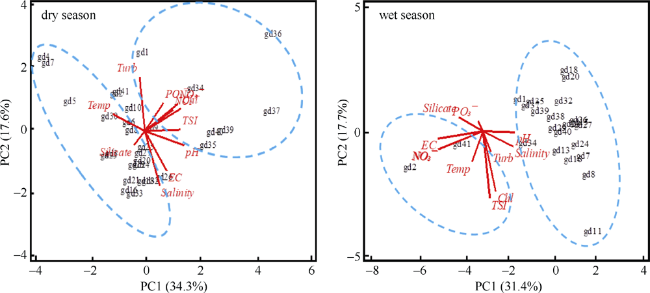
调查了广东红树林区水质的时空变化, 分别采集了红树林区表层水体水样旱季30个样点(2017年10月至2018年1月)和湿季20个样点(2018年7月至8月)进行分析。利用单一营养状态指数(TSI Chl a)评价红树林水质特征和营养状态, 评价标准: 0<TSI≤30为贫营养, 30<TSI≤50为中营养, TSI>50为富营养, >70为高营养。红树林区环境参数的时空变化为: 盐度(2.15‰~27.14‰)、pH (6.18~8.65)、电导率(10.87~90.52µs·cm-1)、浊度(0.0975~21.61FTU)、硝酸盐(0~127.2mg·L-1)、亚硝酸盐(0~12.0mg·L-1)、磷酸盐(0~34.5mg·L-1)、硅酸盐(1.22~2.88mg·L-1)和叶绿素a (0.19~38.08mg·m-3)。聚类分析表明, 丰水期横跨雷州半岛右侧至广东沿海东部的水质相对较好, 而左侧则处于中营养化状态。同时, 在枯水期, 红树林区水质较差, 从雷州半岛周围的高中营养化状态, 到广东沿海东部的富营养化状态。主成分分析表明, 营养盐、盐度、pH、电导率(electrical conductivity, EC)和浊度对红树林区水质状况贡献显著, 进而影响红树林生态系统中藻类群落的变化。
INYANG Aniefiok Ini , 周月月 , 王友绍 . 广东沿海红树林区水质变化特征与富营养状态评估[J]. 热带海洋学报, 2022 , 41(6) : 1 -11 . DOI: 10.11978/2021111
It was investigated for the spatio-temporal variation of the water quality in the mangroves in Guangdong Province. Surface water samples were collected inside the mangroves from 30 sites during the dry season (Oct., 2017 to Jan., 2018) and 20 sites during the wet season (July to Aug., 2018). Water quality and trophic conditions were highlighted by the single trophic state index (TSI Chl a), and the evaluation standard was: 0<TSI≤30 oligotrophic, 30<TSI≤50 mesotrophic, TSI>50 eutrophic, and >70 high eutrophic. The spatio-temporal variations of the environmental variables were as follows: salinity (2.15‰~27.14‰), pH (6.18~8.65), electrical conductivity (10.87~90.52 µs·cm-1), turbidity (5.6~272 FTU), nitrate (0~127.2 mg·L-1), nitrite (0~12.0 mg·L-1), phosphate (0~34.5 mg·L-1), silicate (1.22~2.88 mg·L-1) and Chlorophyll a (0.19~38.08 mg·m-3). Cluster analysis deduced that the water quality across the right side of the Leizhou Peninsula to the east Guangdong coast during the wet season was relatively better, while the left side experienced mesotrophic conditions. Meanwhile the water quality decreased in the dry season, ranging from high mesotrophic conditions around the Leizhou Peninsula to eutrophic conditions across the east coast. The PCA revealed that nutrient salts, salinity, pH, EC and turbidity contributed significantly to the water quality status in the mangrove ecosystems, which in turn affects the algal communities in the ecosystem.
Key words: algal abundance; nutrients; mangroves; trophic states; Guangdong coast
Fig. 1 The location map of the study areas along the Guangdong coast. The map review number is given as GS (2019) 3333 |
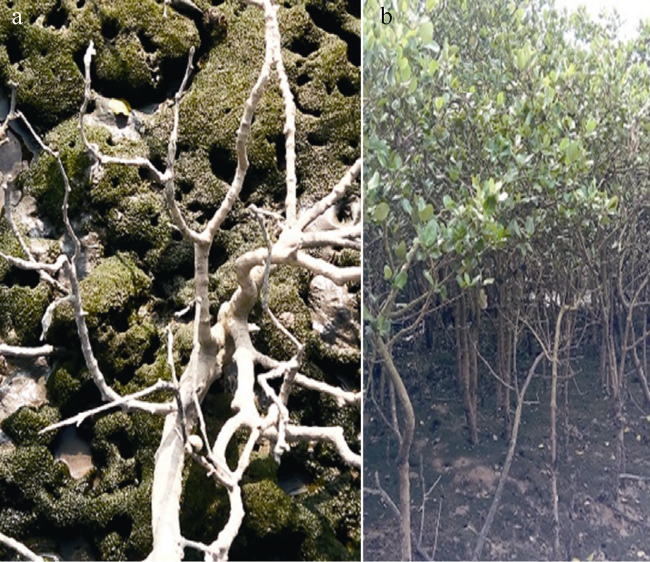
Fig. 2 Algal bloom on the floor of mangrove forest (Avicennia marina) around Peninsula and mid part of the Guangdong coast exposed during low tide. (a) Long term severe environmental pollution result in the mangrove plant death; (b) A. marina bed covered with algal bloom due to the long term nutrient enrichment |
Tab. 1 Spatiotemporal variation and T-test evaluation of environmental parameters during dry season (n = 30) and wet season (n = 23) in the mangroves |
| variables | season | minimum | maximum | mean | STD | T-test | dry vs wet |
|---|---|---|---|---|---|---|---|
| pH | dry | 7.23 | 8.63 | 7.95 | 0.338 | not sign. | P<0.05 |
| wet | 7.47 | 8.71 | 8.04 | 0.393 | |||
| temperature/℃ | dry | 13.33 | 29.79 | 20.37 | 3.946 | sign. | P<0.01 |
| wet | 23.76 | 34.49 | 30.09 | 2.447 | |||
| EC/ (µS·cm-1) | dry | 10.87 | 90.52 | 33.21 | 14.76 | sign. | P<0.01 |
| wet | 1338 | 9702 | 3745 | 1966 | |||
| TDS /(mg·L-1) | dry | 0.098 | 21.61 | 14.67 | 5.957 | sign. | P<0.01 |
| wet | 2.042 | 18.14 | 10.44 | 5.892 | |||
| turbidity /FTU | dry | 5.6 | 395 | 82.91 | 94.67 | not sign. | P<0.05 |
| wet | 9.2 | 204 | 59.261 | 41.23 | |||
| salinity/‰ | dry | 5.11 | 27.31 | 18.78 | 7.019 | sign. | P<0.01 |
| wet | 2.15 | 22.82 | 12.67 | 7.538 | |||
| nitrate /(mg·L-1) | dry | 3.5 | 127.2 | 50.923 | 40.76 | sign. | P<0.01 |
| wet | 0 | 2.0 | 0.13 | 0.458 | |||
| nitrite/ (mg·L-1) | dry | 0.6 | 12.0 | 3.59 | 2.59 | sign. | P<0.01 |
| wet | 0 | 1.5 | 0.109 | 0.368 | |||
| phosphate/ (mg·L-1) | dry | 0.13 | 34.5 | 9.45 | 8.35 | sign. | P<0.01 |
| wet | 0 | 2.5 | 0.997 | 1.042 | |||
| silicate /( mg·L-1) | dry | 0.884 | 2.882 | 1.814 | 0.533 | sign. | P<0.01 |
| wet | 1.54 | 3.04 | 2.25 | 0.368 | |||
| Chl a/ (mg·m-3) | dry | 0.752 | 38.084 | 8.38 | 8.778 | sign. | P<0.01 |
| wet | 0.137 | 13.526 | 1.804 | 2.794 | |||
| TSI | dry | 21.9 | 64.53 | 43.312 | 10.76 | sign. | P<0.01 |
| wet | 3.65 | 53.27 | 25.11 | 11.17 | |||
| algal density (cells·L-1) | dry | 558 | 23703 | 3881 | 4493 | sign. | P<0.01 |
| wet | 1395 | 70144 | 9826 | 13757 |
Tab. 2 Pearson correlation coefficient of environmental parameters in the mangroves during the wet season (n = 23) and dry season (n = 30) |
| pH | temperature | EC | TDS | turbidity | salinity | nitrate | nitrite | phosphate | silicate | Chl a | TSI (Chl a) | algal density | ||
|---|---|---|---|---|---|---|---|---|---|---|---|---|---|---|
| dry season | pH | 1.000 | ||||||||||||
| temperature | -0.602** | 1.000 | ||||||||||||
| EC | 0.439* | -0.336 | 1.000 | |||||||||||
| TDS | 0.443* | -0.259 | 0.361* | 1.000 | ||||||||||
| turbidity | -0.122 | 0.299 | -0.358* | -0.349 | 1.00 | |||||||||
| salinity | 0.458** | -0.263 | 0.342 | 0.959** | -0.361* | 1.000 | ||||||||
| nitrate | 0.431* | -0.264 | 0.413* | -0.090 | 0.179 | -0.119 | 1.000 | |||||||
| nitrite | 0.512** | -0.331 | -0.013 | -0.019 | 0.077 | -0.022 | 0.505** | 1.000 | ||||||
| phosphate | 0.204 | -0.397* | 0.077 | -0.180 | 0.042 | -0.243 | 0.420* | 0.154 | 1.000 | |||||
| silicate | -0.206 | 0.300 | 0.133 | -0.006 | 0.181 | 0.110 | -0.012 | -0.063 | -0.355 | 1.000 | ||||
| Chl a | 0.530** | -0.303 | 0.093 | 0.185 | 0.273 | 0.182 | 0.601** | 0.359* | 0.213 | -0.095 | 1.000 | |||
| TSI (Chl a) | 0.513** | -0.318 | 0.231 | 0.266 | -0.119 | 0.273 | 0.469** | 0.399* | 0.062 | -0.105 | 0.838** | 1.000 | ||
| algal density | 0.267 | -0.055 | 0.108 | -0.055 | -0.071 | -0.099 | 0.379* | 0.498** | 0.141 | 0.099 | -0.077 | -0.062 | 1.000 | |
| wet season | pH | 1.000 | ||||||||||||
| temperature | -0.237 | 1.000 | ||||||||||||
| EC | -0.576** | 0.206 | 1.000 | |||||||||||
| TDS | 0.534** | 0.111 | -0.466* | 1.000 | ||||||||||
| turbidity | 0.0851 | 0.135 | -0.125 | 0.078 | 1.000 | |||||||||
| salinity | 0.527** | 0.104 | -0.457* | 1.000** | 0.0701 | 1.000 | ||||||||
| nitrate | -0.321 | 0.228 | 0.733** | -0.308 | -0.085 | -0.310 | 1.000 | |||||||
| nitrite | -0.323 | 0.240 | 0.725** | -0.325 | -0.074 | -0.327 | 0.992** | 1.000 | ||||||
| phosphate | -0.031 | -0.097 | 0.044 | 0.031 | 0.134 | 0.035 | 0.075 | 0.045 | 1.000 | |||||
| silicate | -0.097 | -0.213 | 0.317 | -0.276 | -0.055 | -0.273 | 0.340 | 0.381 | 0.208 | 1.000 | ||||
| Chl a | 0.140 | 0.006 | -0.156 | 0.140 | 0.110 | 0.135 | -0.063 | -0.068 | -0.076 | -0.133 | 1.000 | |||
| TSI (Chl a) | 0.064 | 0.159 | -0.019 | 0.193 | 0.178 | 0.192 | 0.049 | 0.044 | -0.074 | -0.098 | 0.799** | 1.000 | ||
| algal density | 0.194 | 0.065 | -0.042 | 0.245 | -0.021 | 0.250 | -0.067 | -0.073 | 0.305 | -0.444* | -0.144 | -0.153 | 1.000 |
* Correlation is significant at P = 0.05 level (2-tailed). ** Correlation is significant at P = 0.01 level (2-tailed) |
Fig. 6 Dendrogram based on Ward's method, clustering of the sample sites based on trophic state in the mangroves during the dry season |
| [1] |
DEPARTMENT OF ENVIRONMENTAL PROTECTION OF GUANGDONG PROVINCE, 2016. 2015 Report on the state of Guangdong Provincial environment[R]. Guangzhou: Department of Environmental Protection of Guangdong Province.
广东省环境保护厅, 2016. 2015《广东省环境状况报告》[R]. 广州: 广东省环境保护厅. (in Chinese)
|
| [2] |
|
| [3] |
HELCOM, 2015. Guidelines concerning phytoplankton species composition, abundance and biomass[M]//HELCOM. Manual for marine monitoring in the COMBINE programme of HELCOM. Helsinki: HELCOM.
|
| [4] |
|
| [5] |
|
| [6] |
|
| [7] |
|
| [8] |
|
| [9] |
|
| [10] |
|
| [11] |
|
| [12] |
|
| [13] |
|
| [14] |
|
| [15] |
|
| [16] |
|
| [17] |
|
| [18] |
|
| [19] |
|
| [20] |
|
| [21] |
|
| [22] |
|
| [23] |
|
| [24] |
|
| [25] |
|
| [26] |
王友绍, 2019. 红树林分子生态学[M]. 北京: 科学出版社. (in Chinese)
|
| [27] |
王友绍, 孙翠慈, 王玉图, 等, 2019. 生态学理论与技术创新引领我国热带、亚热带海洋生态研究与保护[J]. 中国科学院院刊, 24(1): 121-129. (in Chinese with English abstract)
|
| [28] |
|
/
| 〈 |
|
〉 |
