
琼东水体后向散射系数与浮游植物生物量的关系模型*
|
周雯 (1982—), 女, 湖南省邵东市人, 副研究员, 从事海洋光学和水色遥感应用研究。email: |
Copy editor: 林强
收稿日期: 2021-09-10
修回日期: 2021-10-18
网络出版日期: 2021-10-20
基金资助
南方海洋科学与工程广东省实验室(广州)重大专项创新团队项目(GML2019ZD0602)
南方海洋科学与工程广东省实验室(广州)重大专项创新团队项目(GML2019ZD0305)
国家自然科学基金项目(41976172)
国家自然科学基金项目(41976170)
国家自然科学基金项目(41976181)
国家自然科学基金项目(41576030)
国家自然科学基金项目(41776044)
国家自然科学基金项目(41776045)
广州市科技计划项目(201707020023)
. 中科院南海所热带海洋环境重点实验室自主项目(LTOZZ2003)
Particle backscattering as a function of chlorophyll a concentration off the eastern Hainan coast in the South China Sea*
Copy editor: LIN Qiang
Received date: 2021-09-10
Revised date: 2021-10-18
Online published: 2021-10-20
Supported by
Key Special Project for Introduced Talents Team of Southern Marine Science and Engineering, Guangdong Laboratory (Guangzhou)(GML2019ZD0602)
Key Special Project for Introduced Talents Team of Southern Marine Science and Engineering, Guangdong Laboratory (Guangzhou)(GML2019ZD0305)
National Natural Science Foundation of China(41976172)
National Natural Science Foundation of China(41976170)
National Natural Science Foundation of China(41976181)
National Natural Science Foundation of China(41576030)
National Natural Science Foundation of China(41776044)
National Natural Science Foundation of China(41776045)
Science and Technology Planning Project of Guangzhou(201707020023)
State Key Laboratory of Tropical Oceanography, South China Sea Institute of Oceanology, Chinese Academy of Sciences(LTOZZ2003)
海洋中光后向散射系数的变化包含了浮游植物生物量的信息, 可应用于卫星遥感和光学剖面观测平台获取海洋中大时空尺度-高分辨率剖面的浮游植物生物量变化特征。本文选取了琼东上升流影响下生物—光学变异性较为显著的海域, 基于2013年航次实测数据, 建立了颗粒物后向散射系数(bbp)与叶绿素a浓度(Chl a)间的区域性关系模型。模型假定颗粒物后向散射系数由不随叶绿素浓度变化的固定背景值, 以及较大粒级(>2μm)和pico级(微微型, <2μm)两类浮游植物的后向散射贡献累加所得。采集的数据集进行了模型检验, 结果表明, 模型能很好地模拟琼东海域水体的bbp与Chl a间的变化趋势, 性能优于常用的幂函数关系模型, 尤其在低叶绿素浓度范围, 很好地解决幂函数显著低估的现象; 琼东海域的bbp和Chl a关系存在显著的水层变化, 底层后向散射固定背景值显著高于上层水体背景值, 表明底层受上升流的影响, 水体中不随Chl a共变的颗粒物浓度增大, 其后向散射相应增强; 叶绿素最大层的后向散射固定背景值显著低于上层其他水体的固定背景值, 后向散射固定背景值的贡献百分比约为21%~35%; 随着叶绿素浓度增大, 较大粒级的浮游植物对颗粒物后向散射系数的贡献也显著增大, 可达到50%以上, pico级浮游植物贡献稳定在40%附近。本研究的结果将为琼东海域浮游植物生物量的光学遥感、生物地球化学过程研究提供更为精确的区域性模型和基础支撑数据。
周雯 , 魏盼盼 , 李彩 , 王桂芬 , 郑文迪 , 邓霖 , 赵红五一 , 余凌晖 , 曹文熙 . 琼东水体后向散射系数与浮游植物生物量的关系模型*[J]. 热带海洋学报, 2022 , 41(3) : 29 -37 . DOI: 10.11978/2021123
Variability of light backscattering coefficient in the ocean can be used to quantify the biomass of phytoplankton, which can be applied in remote sensing and optical profile observation platforms to obtain the characteristics of phytoplankton biomass spanning various spatio-temporal scales and vertical profiles in the ocean. Significant variabilities of the bio-optical properties exist off the eastern Hainan coast, being influenced by upwelling. Based on the in-situ data collected off this area in 2013, we established a regional algorithm between the backscattering coefficient of particle [bbp] and chlorophyll a concentration [Chl a]. The algorithm is based on the assumption that the particle backscattering coefficient is determined by the constant background backscattering value independent of Chl a and two components by pico (< 2 μm) and large(>2 μm)phytoplankton. Results show that the modelled bbp values agree well with measurements, especially for low Chl a concentration. The relationships between bbp and Chl a vary in different water layers. For example, the constant background backscattering values at the bottom layer are significantly higher than those in the upper layer, indicating that driven by upwelling, the increasing concentration of submicron particles not covariant with Chl a might produce an increasing backscattering coefficient. At the chlorophyll maximum layer, the background backscattering values are significantly lower than those in the upper water, and the contribution percentage of background backscattering value is about 21%~35%. With the increase of Chl a concentration, the contribution of large phytoplankton to bbp increases significantly, accounting for 50% or higher, while the contribution of pico phytoplankton remains stable around 40%. Understanding the regional relationship of bbp and Chl a off the eastern Hainan coast can improve our understanding of marine biogeochemical processes in the region.
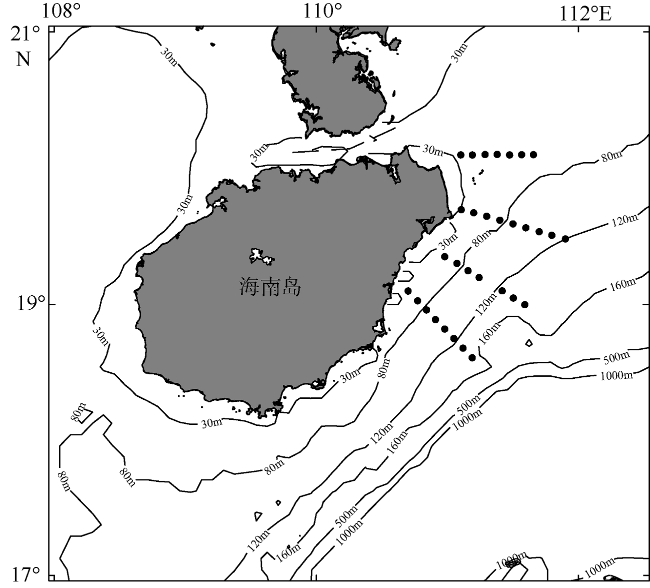
图1 南海琼东海域实验站位图该图基于国家测绘地理信息局地图服务网站下载的审图号为GS(2019)1819号的标准地图制作, 底图无修改 Fig. 1 Locations of stations off the eastern Hainan coast in the South China Sea. This map is made based on the standard map no. GS (2019) 1819 downloaded from http://bzdt.ch.mnr.gov.cn, without modification of the base map |
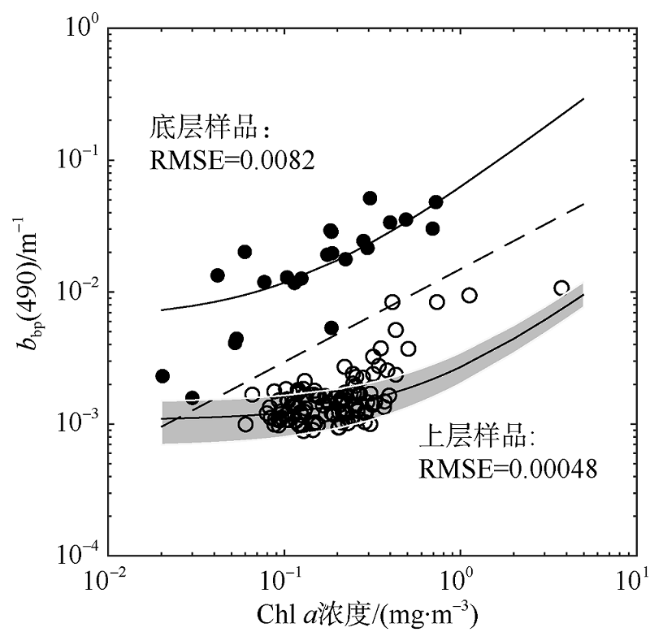
图2 bbp(490)与Chl a的散点图及模型拟合曲线模型拟合结果标识为黑色实线, 虚线将整个数据集划分为两部分, 实心黑点代表底部雾状层样品; 空心点代表上层水体样品, 灰色区域代表95%置信区间 Fig. 2 Log-log scatter plot of bbp(490) vs. Chl a. The samples are divided into upper and bottom samples by the dotted line. The fitted curves for upper (open circles) and bottom samples (black dots) are given by black solid lines. Gray shading represents a model ensemble calculated by varying model parameters between 95% confident intervals |
表1 模型拟合参数Tab. 1 The fitted parameters of the model |
| 水层 | 拟合参数 | ||
|---|---|---|---|
| bbp,p*(490)/(m2·mg-1) | bbp,mn*(490) /(m2·mg-1) | bbp,k(490) /(m-1) | |
| 上层水体 | 0.0015 | 0.00179 | 0.001161 |
| 表层水体 | 0.0052 | 0.00560 | 0.000894 |
| 中层水体 | 0.0051 | 0.00543 | 0.000626 |
| 叶绿素最大层 | 0.0025 | 0.00288 | 0.000571 |
| 底层水体 | 0.0563 | 0.05660 | 0.006719 |
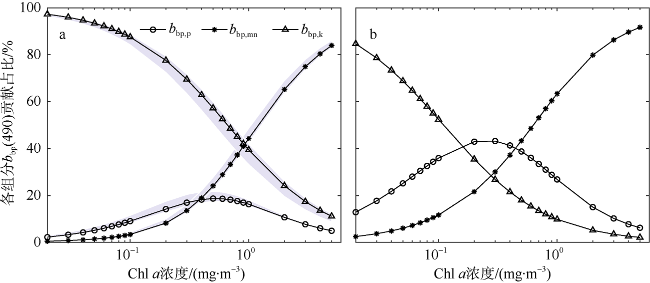
图3 上层样品(a)和底层样品(b)各种组分对bbp(490)的贡献百分比与Chl a浓度之间的关系图蓝色区域代表95%置性区间 Fig. 3 Percent contribution of each component population to bbp(490) as a function of Chl a for upper samples (a) and bottom samples (b). Blue shading represents a model ensemble calculated by varying model parameters between 95% confident intervals |
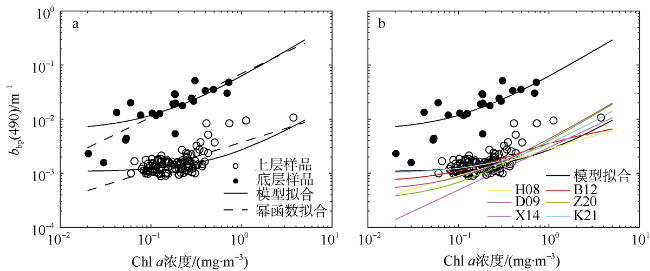
图4 本文构建模型与其他模型拟合结果对比a. 本文模型与幂函数拟合结果; b. 本文模型与其他文献模型结果对比; 实线代表本文构建模型拟合结果, 虚线代表幂函数拟合结果 Fig. 4 Comparison of the fitted relationship in this study to other relationships in publications. (a) Comparison of the fitted curves from the model (black solid line) and from the power function (dotted line ) for two groups; and (b) comparison of the fitted curves from the model (black solid line) and other publications (colored lines) |
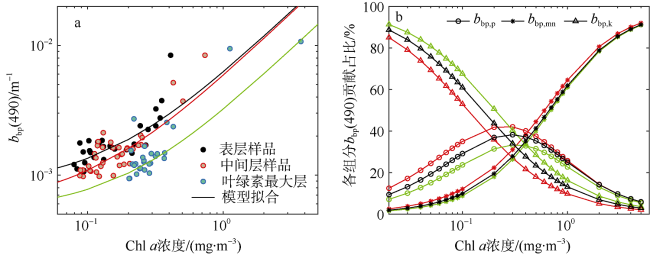
图5 分层bbp与Chl a模型拟合图a. 水体表层(黑点)、叶绿素最大层(绿点)及两者之间的中间层(橙点)的分层模型拟合结果; b. 分层模型估算的各组分后向散射对bbp的贡献百分比随Chl a浓度的变化, 颜色代表水层与图(a)一致 Fig. 5 Relationships between bbp and Chl a for different water layers. (a) The fitted curves for surface samples (black dots), chlorophyll a maximum layer samples (green dots), and others (orange dots); and (b) percent contribution of each component population to bbp(490) as a function of Chl a for samples of the three groups |
| [1] |
许东禹, 刘锡清, 张训华, 等, 1997. 中国近海地质[M]. 北京: 地质出版社.
|
| [2] |
王桂芬, 周雯, 林俊芳, 等, 2014. 南海北部海区浮游植物粒级结构生物光学反演模型的验证与评价[J]. 激光生物学报, 22(6): 502-515.
|
| [3] |
汪彧, 经志友, 齐义泉, 2016. 2013年夏季琼东海域上升流观测研究[J]. 热带海洋学报, 35(2): 40-49.
|
| [4] |
谢玲玲, 张书文, 赵辉, 2012. 琼东上升流研究概述[J]. 热带海洋学报, 31(4): 35-41.
|
| [5] |
|
| [6] |
|
| [7] |
|
| [8] |
|
| [9] |
|
| [10] |
|
| [11] |
|
| [12] |
|
| [13] |
|
| [14] |
|
| [15] |
|
| [16] |
|
| [17] |
|
| [18] |
|
| [19] |
|
| [20] |
|
| [21] |
|
| [22] |
|
| [23] |
|
| [24] |
|
| [25] |
|
| [26] |
|
| [27] |
|
| [28] |
|
| [29] |
|
| [30] |
|
/
| 〈 |
|
〉 |
