
海洋资料同化对气候季节-年际预测技巧及初始场的影响试验
|
孙惠杭(1996—), 男, 江苏省泰州市人, 硕士研究生, 从事海洋资料同化和气候预测研究。email: |
Copy editor: 林强
收稿日期: 2021-08-30
修回日期: 2021-12-24
网络出版日期: 2021-12-31
基金资助
国家自然科学基金(42030605)
国家重点研发计划(2020YFA0608004)
Impact of ocean data assimilation on initial conditions and skills of seasonal-to- interannual climate prediction
Copy editor: LIN Qiang
Received date: 2021-08-30
Revised date: 2021-12-24
Online published: 2021-12-31
Supported by
National Natural Science Foundation of China(42030605)
National Key R&D Program of China(2020YFA0608004)
集合卡尔曼滤波(Ensemble Kalman filter, EnKF)是一种国内外广泛使用的海洋资料同化方案, 用集合成员的状态集合表征模式的背景误差协方差, 结合观测误差协方差, 计算卡尔曼增益矩阵, 有效地将观测信息添加到模式初始场中。由于季节、年际预测很大程度上受到初始场的影响, 因此资料同化可以提高模式的预测性能。本文在NUIST-CFS1.0预测系统逐日SST nudging的初始化方案上, 利用EnKF在每个月末将全场(full field)海表温度(sea surface temperature, SST)、温盐廓线(in-situ temperature and salinity profiles, T-S profiles)以及卫星观测海平面高度异常(sea level anomalies, SLA)观测资料同化到模式初始场中, 对比分析了无海洋资料同化以及加入同化后初始场的区别、加入海洋资料同化后模式提前1~24个月预测性能的差异以及对于厄尔尼诺-南方涛动(El Niño-southern oscillation, ENSO)预测技巧的影响。结果表明, 加入海洋资料同化能有效地改进初始场, 并且呈现随深度增加初始场改进越显著的特征。加入同化后, 对全球SST、次表层海水温度的平均预测技巧均有一定的提高, 也表现出随深度增加预测技巧改进越明显的特征。但加入海洋资料同化后, 模式对ENSO的预测技巧有所下降, 可能是由于模式误差的存在, 使得同化后的预测初始场从接近观测的状态又逐渐恢复到与模式动力相匹配的状态, 加剧了赤道太平洋冷舌偏西、中东部偏暖的气候平均态漂移。
孙惠杭 , 王意国 , 罗京佳 . 海洋资料同化对气候季节-年际预测技巧及初始场的影响试验[J]. 热带海洋学报, 2022 , 41(3) : 75 -90 . DOI: 10.11978/2021112
Ensemble Kalman filter (EnKF) is a widely used ocean data assimilation scheme. It uses the members' state to represent background error covariance of the model and uses the observation error covariance to calculate the Kalman gain matrix; and then it adds the information of observation to the model's initial conditions. Data assimilation can effectively improve climate prediction skill since seasonal-to-interannual climate prediction is largely influenced by initial conditions. Based on the NUIST-CFS1.0, previously SINTEX-F, that used coupled sea-surface temperature (SST)-nudging initialization method, we employ EnKF to assimilate SST, gridded altimeter satellite sea-level anomalies, and in-situ temperature and salinity profiles at the end of each month. We assess the differences in the initial fields and climate (including the ENSO) prediction skills at lead times of up to 24 months with and without the ocean data assimilation. The results show that the initial conditions are improved largely with the ocean data assimilation, and the improvement of the initial fields is getting better with the increase of depth. The global mean prediction skills of SST and subsurface temperature with EnKF are improved at 1-24 months lead, and the improved prediction also becomes more obvious in deep layers. However, the prediction skill of the ENSO is reduced after the EnKF assimilation. This might be due to the existence of model errors, the predicted initial field with EnKF is gradually restored from a state close to the observed state to match the model dynamics again, which displays a larger cold SST bias in the west and warm bias in the central-eastern equatorial Pacific, compared to the original NUIST-CFS1.0.
表1 本文中的试验设置Tab. 1 Experimental set up |
| 试验组 | 初始化方案 | 初始化成员数量 | 历史回报成员数量 | 历史回报时间 |
|---|---|---|---|---|
| 试验1 | SST nudging | 9 | 9 | 1982.02—2018.12,逐月起报1~24个月 |
| 试验2 | SST nudging和EnKF | 33 | 9 | 1982.02—2018.12,逐月起报1~24个月 |
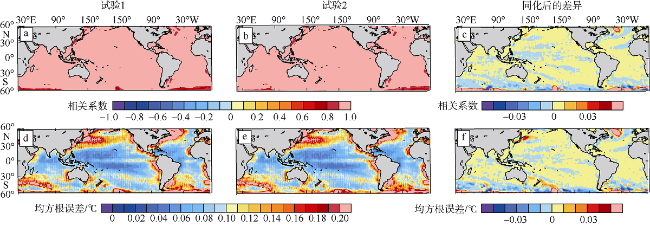
图1 SST初始场异常与观测异常的相关系数与均方根误差(单位: ℃)的空间分布a. 试验1的相关系数; b. 试验2的相关系数, 图a、b填色区域为通过99%显著性检验区域; c. 同化海洋资料后相关系数的差异(即试验2减去试验1), 暖色为改进, 冷色为变差; d. 试验1的均方根误差; e. 试验2的均方根误差; f. 同化海洋资料后均方根误差的差异 (即试验1减去试验2), 暖色为改进, 冷色为变差。该图基于国家测绘地理信息局标准地图服务网站下载的审图号为GS(2016)2945号的标准地图制作 Fig. 1 Spatial distribution of correlation coefficient and RMSE/℃ between two experiments' SST initial condition anomalies and observation anomalies. (a) The correlation coefficient of experiment 1; (b) the correlation coefficient of experiment 2. The color filled area in (a) and (b) has passed the 99% significance test. (c) The difference of correlation coefficient between with and without ocean data assimilation (i.e., experiment 2 minus experiment 1). The warm color means improved, and the cold color means deteriorated. (d) RMSE of experiment 1; (e) RMSE of experiment 2. (f) The difference of RMSE between with and without ocean data assimilation (i.e., experiment 1 minus experiment 2). The warm color means improved, and the cold color means deteriorated |
图5 赤道各大洋区域初始场两组试验各变量异常时间序列图从上到下分别为赤道东太平洋区域( Fig. 5 Time series of two experiments' variable anomalies in the initial conditions of the equatorial ocean regions. From the top to the bottom are the eastern equatorial Pacific region (a-c), the western equatorial Pacific region (d-f), the equatorial Indian Ocean region (g-i), and the equatorial Atlantic region (i-j). From the left are the time series of Z20 anomaly, T100 anomaly and T300 anomaly. The black solid line is the observation, and the blue (red) solid line, R and RMSE are the time series, correlation coefficient and root mean square error of experiment 1 (experiment 2), respectively |
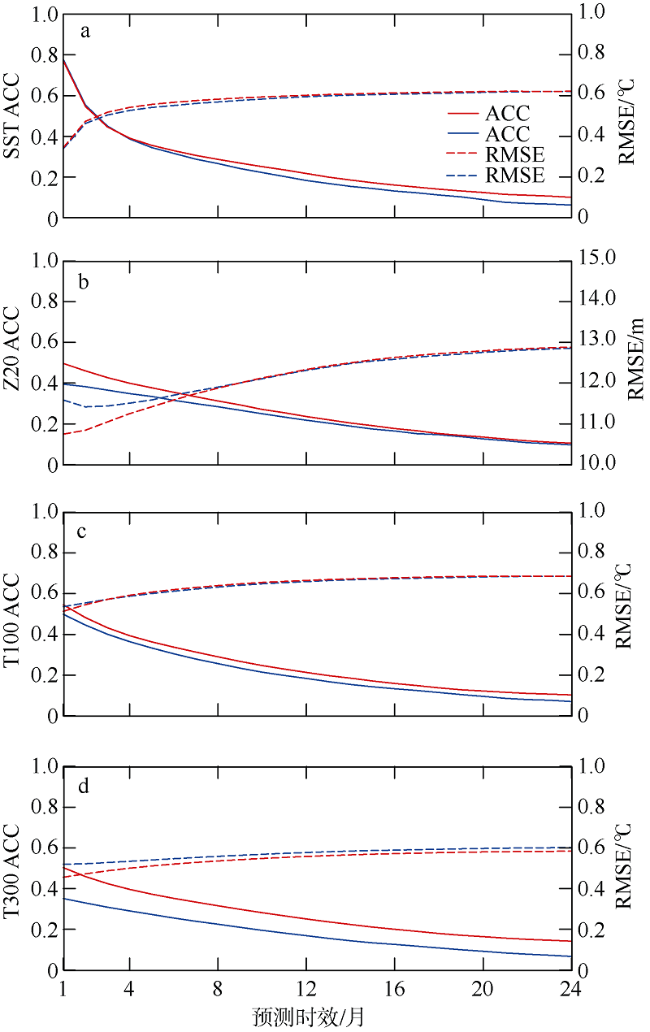
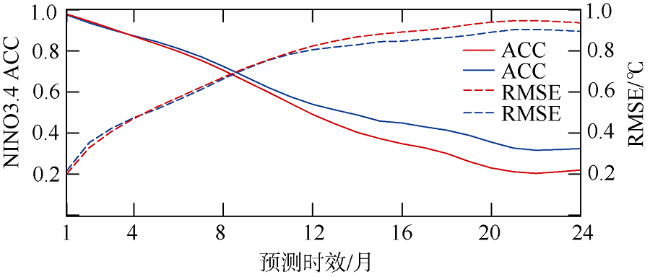
图6 两组试验SST(a)、Z20(b)、T100(c)和T300(d)的全球平均(60°S—60°N)ACC和RMSE预测技巧随预测时效(即提前1~24个月)的变化蓝色(红色)实线、虚线分别为试验1(试验2)的相关系数以及RMSE Fig. 6 Time series of two experiments' global mean (60°S-60°N) ACC and RMSE prediction skills (i.e., 1-24 months lead) of SST, Z20, T100, and T300. The blue (red) solid line and dotted line are the correlation coefficient and RMSE of experiment 1 (experiment 2), respectively |
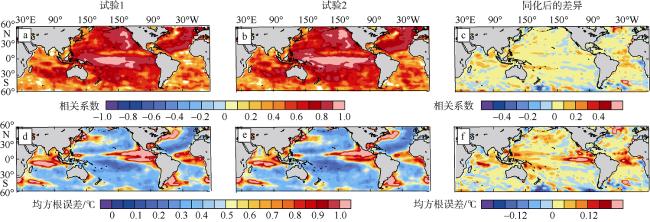
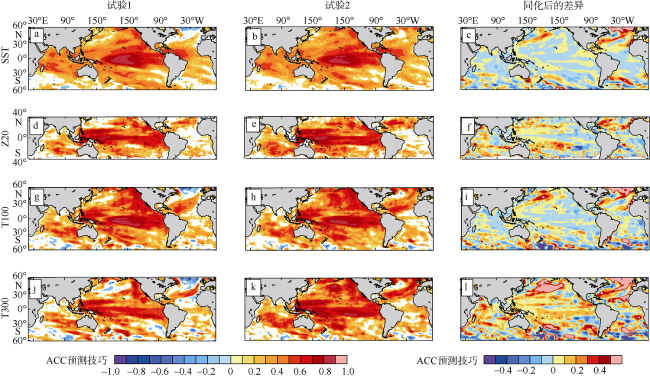
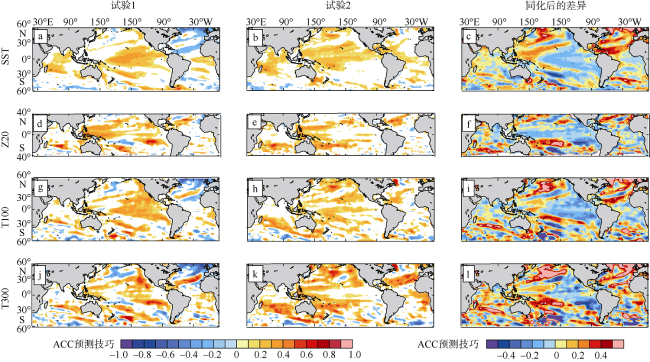
图7 提前6个月起报两组试验ACC预测技巧的空间分布该图基于国家测绘地理信息局标准地图服务网站下载的审图号为GS(2016)2945号的标准地图制作。从上至下分别为SST、Z20、T100以及T300; a、d、g、j为试验1的结果; b、e、h、k为试验2的结果; c、g、i、l为加入同化后的差异; 暖色为改进, 冷色为变差 Fig. 7 Spatial distributions of two experiments' anomaly correlation coefficient (ACC) skills at 6 months lead. From the top to the bottom are SST, Z20, T100, and T300, respectively. From the left panels are the results of experiment 1 (a, d, g, j), the results of experiment 2 (b, e, h, k), and the differences (c, f, i, l) between with and without ocean data assimilation (i.e., b minus a). The warm color means improved, and the cold color means deteriorated |
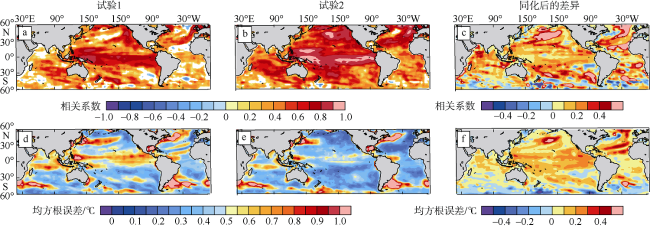
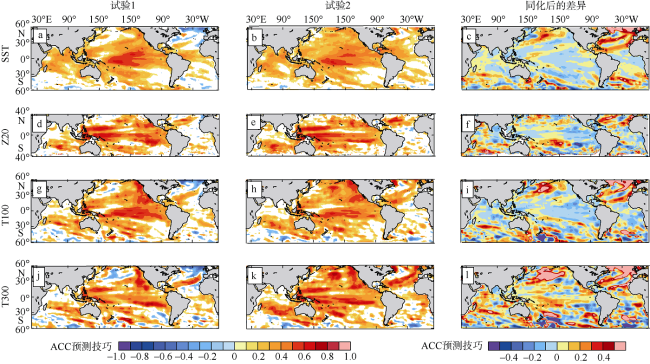
图8 提前12个月起报两组试验ACC预测技巧的空间分布该图基于国家测绘地理信息局标准地图服务网站下载的审图号为GS(2016)2945号的标准地图制作 Fig. 8 Spatial distributions of two experiments' anomaly correlation coefficient (ACC) skills at 12 months lead |
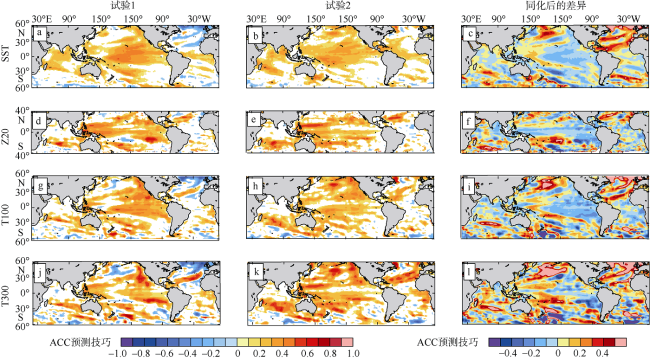
图9 提前18个月起报两组试验ACC预测技巧的空间分布该图基于国家测绘地理信息局标准地图服务网站下载的审图号为GS(2016)2945号的标准地图制作 Fig. 9 Spatial distributions of two experiments' anomaly correlation coefficient (ACC) skills at 18 months lead |
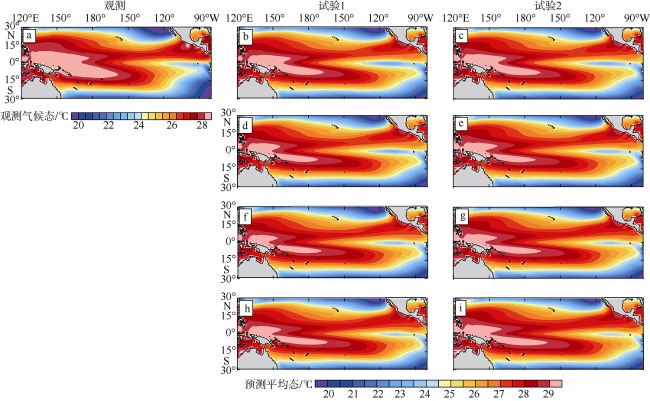
图12 两组试验SST预测平均态随预测时效的变化该图基于国家测绘地理信息局标准地图服务网站下载的审图号为GS(2016)2945号的标准地图制作。a为观测气候态; b、d、f、h为试验1的预测平均态; c、e、g、i为试验2的预测平均态; 从上往下分别为提前6、12、18以及24个月, 选取时间均为1985.01—2014.12 Fig. 12 Differences between two experiments' SST climatic mean states at different months lead. The left panel (a) is observation climatology, the middle panels (b, d, f, h) are SST climatic mean states of experiment 1, the right panels (c, e, g, i) are SST climatic mean states of experiment 2. From the top to the bottom are the results at 6, 12, 18, and 24 months lead over the period Jan 1985-Dec 2014 |
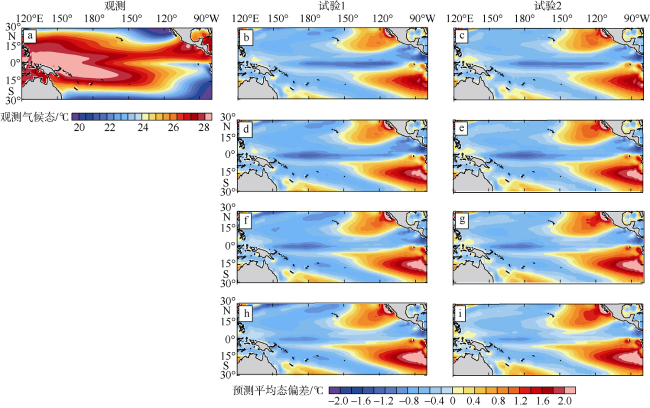
图13 两组试验SST预测平均态偏差随预测时效的变化该图基于国家测绘地理信息局标准地图服务网站下载的审图号为GS(2016)2945号的标准地图制作。a为观测气候态; b、d、f、h为试验1的预测平均态偏差; c、e、g、i为试验2的预测平均态偏差; 从上往下分别为提前6、12、18以及24个月, 选取时间均为1985.01—2014.12 Fig. 13 Differences between two experiments' SST climate mean states biases at different months lead. The left panel (a) is observation climatology, the middle panels (b, d, f, h) are SST climate mean states biases of experiment 1, the right panels (c, e, g, i) are SST climate mean states biases of experiment 2. From the top to the bottom are the results at 6, 12, 18, and 24 months lead over the period Jan 1985-Dec 2014 |
| [1] |
贺嘉樱, 伍继业, 罗京佳, 2020. 南京信息工程大学气候预测系统1.0版简介[J]. 大气科学学报, 43(1): 128-143.
|
| [2] |
吴新荣, 韩桂军, 李冬, 等, 2011. 集合滤波和三维变分混合数据同化方法研究[J]. 热带海洋学报, 30(6): 24-30.
|
| [3] |
|
| [4] |
|
| [5] |
|
| [6] |
|
| [7] |
|
| [8] |
|
| [9] |
|
| [10] |
|
| [11] |
|
| [12] |
|
| [13] |
|
| [14] |
|
| [15] |
|
| [16] |
|
| [17] |
|
| [18] |
|
| [19] |
|
| [20] |
|
| [21] |
|
| [22] |
|
| [23] |
|
| [24] |
|
| [25] |
|
| [26] |
|
| [27] |
|
| [28] |
|
| [29] |
|
| [30] |
|
| [31] |
|
| [32] |
|
| [33] |
|
| [34] |
|
| [35] |
|
| [36] |
|
| [37] |
|
| [38] |
|
| [39] |
|
| [40] |
|
| [41] |
|
| [42] |
|
| [43] |
|
| [44] |
|
| [45] |
|
| [46] |
|
| [47] |
|
| [48] |
|
| [49] |
|
| [50] |
|
| [51] |
|
| [52] |
|
| [53] |
|
| [54] |
|
| [55] |
|
| [56] |
|
| [57] |
|
| [58] |
|
| [59] |
|
| [60] |
|
| [61] |
|
/
| 〈 |
|
〉 |
