
东亚及西太平洋地表温度时空模态分析及预测研究*
|
唐超礼(1980—), 男, 教授, 博士, 硕士生导师, 主要从事大气数据与信息技术研究 |
Copy editor: 林强
收稿日期: 2022-01-18
修回日期: 2022-03-24
网络出版日期: 2022-03-21
基金资助
空间天气学国家重点实验室专项基金资助项目(201909)
安徽高校自然科学研究重点项目(KJ2019A0103)
安徽理工大学高层次引进人才科研启动基金(13190007)
国家重点研发计划课题(2019YFA0706004)
安徽理工大学研究生创新基金项目(2021CX2082)
Spatiotemporal modal analysis and prediction of surface temperature in East Asia and the Western Pacific*
Copy editor: LIN Qiang
Received date: 2022-01-18
Revised date: 2022-03-24
Online published: 2022-03-21
Supported by
Specialized Research Fund for State Key Laboratories(201909)
University Natural Science Research Project of Anhui Province of China(KJ2019A0103)
Scientific Research Start-up Fund for High-level Introduced Talents of Anhui University of Science and Technology(13190007)
National Key Research and Development Program(2019YFA0706004)
Graduate Innovation Foundation of Anhui University of Science and Technology(2021CX2082)
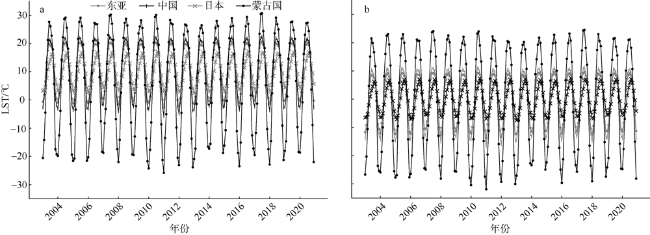
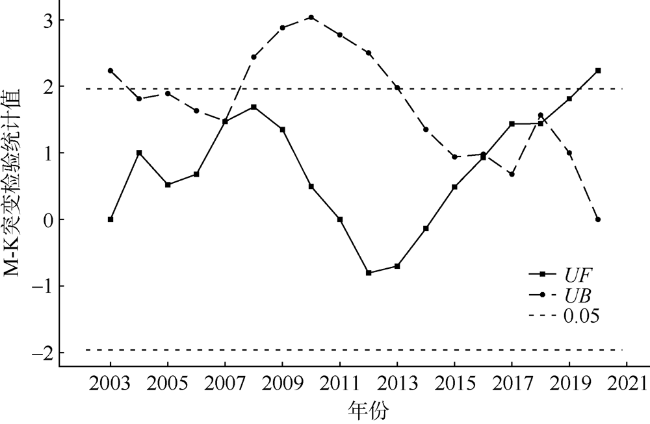
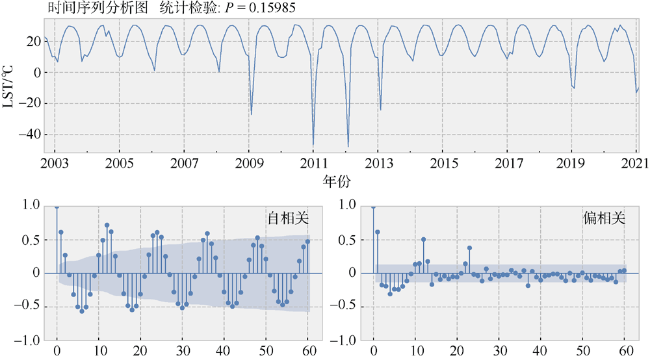
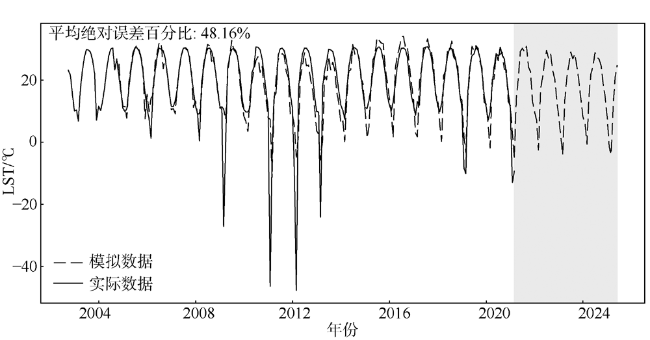
地表温度(land surface temperature, LST)是地球表面(海洋和陆地)水循环和大气环境互通的重要参数, 也是海、陆能量传输的重要体现。本文利用2003—2020年卫星反演的LST数据, 通过M-K(Mann-Kendall)突变检验、线性回归、经验正交分解(empirical orthogonal function, EOF)等方法分析LST时空模态特征, 并运用季节自回归移动平均(seasonal autoregression integrated moving average, SARIMA)模型预测LST的变化趋势。发现春、秋、冬三季沿海温度高, 内陆温度低, 由南向北(10°N—60°N), 由东向西(70°E—140°E)递减; 而夏季相反。EOF第一模态贡献率为29.58%, 空间分布以昆仑山脉、秦岭为分界线。预计2020年以后, LST的变化范围在-5~35℃。结果表明: (1)由于纬度的增加及海陆位置的差异, 导致日本的LST幅度小, 蒙古国的LST幅度大, 其余地区变化幅度平稳; (2)春、秋季温差不大, 夏、冬季温差大, 主要原因是太阳辐射; 其次, 季风气候显著。内陆高山多, 沿海平原多, 陆地升温效应小于水体的降温效应也会影响温差; (3)东亚及西太平洋地区LST的变化与人类活动、火山爆发等事件有关。
唐超礼 , 陶鑫华 , 魏圆圆 , 戴聪明 , 魏合理 . 东亚及西太平洋地表温度时空模态分析及预测研究*[J]. 热带海洋学报, 2022 , 41(6) : 183 -192 . DOI: 10.11978/2022009
Land surface temperature (LST) is an important parameter of water cycle and atmospheric environment interworking on the earth's surface (ocean and land), and it is also an essential embodiment of energy transmission between sea and land. Using the LST data retrieved from satellites from 2003 to 2020, this paper analyzes the temporal and spatial modal characteristics of LST by M-K (Mann-Kendall) mutation test, linear regression and empirical orthogonal function (EOF), and uses the seasonal autoregression integrated moving average (SARIMA) model to predict the change trend of LST. It is found that the coastal temperature is high and the inland temperature is low in spring, autumn and winter, decreasing from south to north (10°N—60°N) and from east to west (70°E—140°E); while summer is the opposite. The first mock exam rate of EOF is 29.58%, and the spatial distribution is the Kunlun mountain and Qinling Mountains. It is predicted that after 2020, the range of LST will be -5 ~ 35℃. The results show that: (1) with the increase of latitude and the difference of sea and land location, the LST amplitude in Japan is small, in Mongolia is large, and that in other regions fluctuates stably. (2) The temperature difference between spring and autumn is not significant, and the temperature difference between summer and winter is large, mainly due to solar radiation; Secondly, the monsoon climate is significant. There are many inland mountains and coastal plains, and the land heating effect is less than the water-cooling effect, which will also affect the temperature difference. (3) The changes of LST in East Asia and the Western Pacific are related to human activities, volcanic eruptions and other events.
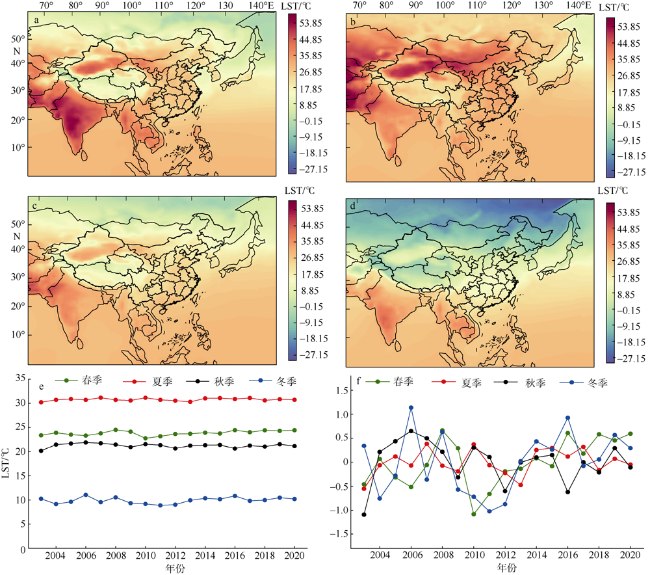
图3 2003—2020年东亚及西太平洋LST四季空间分布a. 春季; b. 夏季; c. 秋季; d. 冬季; e. 四季变化折线图; f. 四季距平图。a—d基于国家测绘地理信息局标准地图服务网站下载的审图号为GS(2016)2938号的标准地图制作 Fig. 3 Spatial distribution of LST seasons in East Asia and West Pacific from 2003 to 2020. (a) Spring; (b) summer; (c) autumn; (d) winter; (e) line chart of four seasons; (f) four seasons anomaly map |
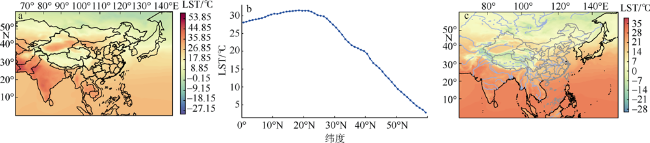
图4 2003—2020年东亚及西太平洋LST空间分布图a. AIRS空间分布; b. 纬度分布; c. ERA5再分析空间分布。a、c基于国家测绘地理信息局标准地图服务网站下载的审图号为GS(2016)2938号的标准地图制作 Fig. 4 Spatial distribution of LST in east Asia and west Pacific from 2003 to 2020. (a) Spatial distribution of AIRS; (b) latitude distribution; (c) ERA5 reanalysis spatial distribution |
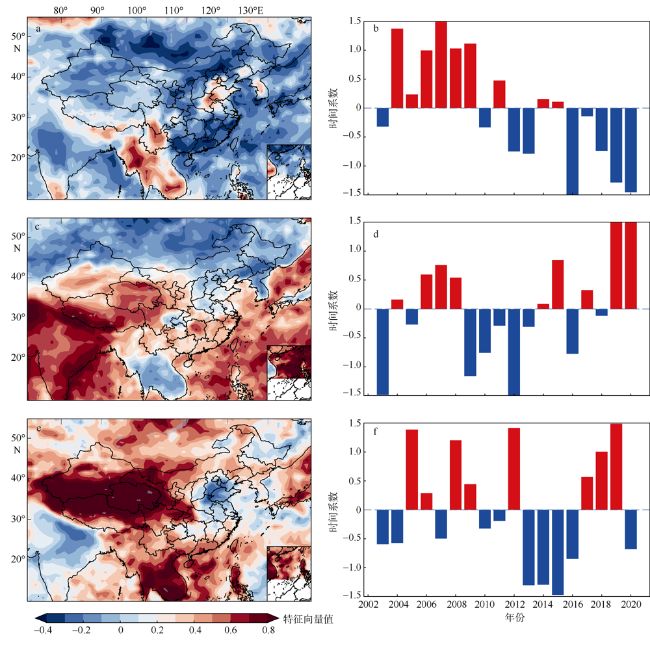
图5 2003—2020年东亚及西太平洋地区湿度EOF空间分布图和时间系数图a、c、e分别为第一、第二、第三模态的空间分布图, 基于国家测绘地理信息局标准地图服务网站下载的审图号为GS(2016)2938号的标准地图制作; b、d、f为第一、第二、第三模态的时间系数图 Fig. 5 Spatial distribution map and time coefficient map of humidity EOF in east Asia and west Pacific from 2003 to 2020. (a), (c), (e) spatial distribution map; (b), (d), (f) time coefficient diagram |
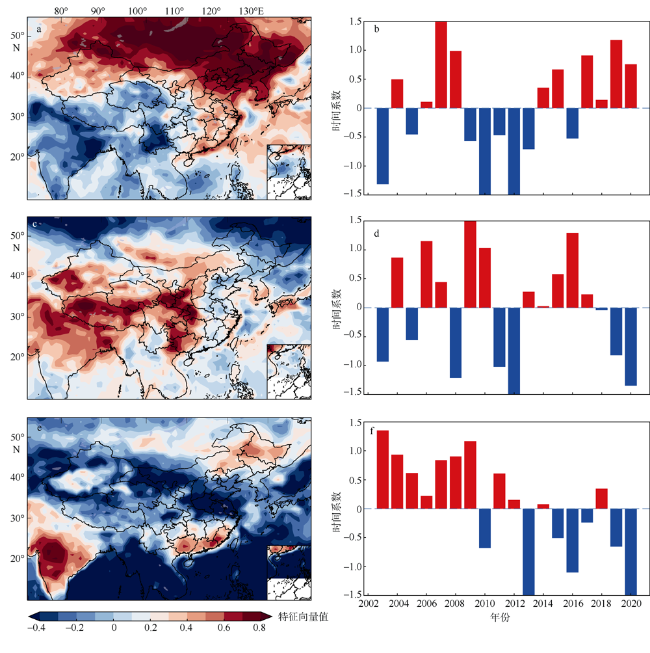
图6 2003—2020年东亚及西太平洋地区LST的EOF空间分布图和时间系数图a、c、e分别为第一、第二、第三模态的空间分布图, 基于国家测绘地理信息局标准地图服务网站下载的审图号为GS(2016)2938号的标准地图制作; b、d、f为第一、第二、第三模态的时间系数图 Fig. 6 Spatial distribution map and time coefficient map of EOF in east Asia and west Pacific of LST from 2003 to 2020. (a), (c), (e) spatial distribution map; (b), (d), (f) time coefficient diagram |
| [1] |
曹晓云, 祁栋林, 肖建设, 等, 2021. 基于卫星观测的青海高原对流层臭氧时空分布特征研究[J]. 环境科学学报, 41(5): 1640-1648.
|
| [2] |
陈锦年, 王宏娜, 吕心艳, 2008. 西太平洋暖池时空分布特征及其与ENSO的关系[J]. 海洋学报(中文版), (1): 10-19.
|
| [3] |
陈锦年, 左涛, 王宏娜, 2012. 印度洋热通量变化及其对南海夏季风爆发的影响[J]. 海洋与湖沼, 43(5): 884-890.
|
| [4] |
高弋斌, 路春燕, 钟连秀, 等, 2019. 1951—2016年中国沿海地区气温与降水量的时空特征[J]. 森林与环境学报, 39(5): 530-539.
|
| [5] |
郭甜甜, 陈圣波, 陆天启, 2017. 基于MODIS数据的多时相海表温度反演——以海南岛西南部近海海域为例[J]. 热带海洋学报, 36(1): 9-14.
|
| [6] |
韩雪, 蔡怡, 陈幸荣, 等, 2014. 渤黄海冬季海温异常的时空分布特征及影响因子分析[J]. 热带海洋学报, 33(5): 1-12.
|
| [7] |
黄盼, 赵伟, 李爱农, 2017. 川西山区太阳辐射估算及其时空分布特征[J]. 山地学报, 35(3): 420-428.
|
| [8] |
李刚, 李崇银, 江晓华, 等, 2015. 1900-2009年全球海表温度异常的时空变化特征分析[J]. 热带海洋学报, 34(4): 12-22.
|
| [9] |
刘振元, 张杰, 陈立, 2018. 青藏高原植被退化对高原及周边地区大气环流的影响[J]. 生态学报, 38(1): 132-142.
|
| [10] |
沈柏竹, 2007. 海陆热状况异常与东亚夏季副热带季风的关联[D]. 长春: 吉林大学.
|
| [11] |
王博, 郭鹏, 孟春红, 等, 2022. 基于FY-3D微波成像仪的中国陆地区域地表温度反演及验证[J]. 大气科学学报, 45(1): 12-123.
|
| [12] |
王宏娜, 陈锦年, 吕心艳, 2009. 西太平洋暖池海温的时空变化及其在ENSO循环中的作用[J]. 海洋与湖沼, 40(1): 1-7.
|
| [13] |
王静, 江丽芳, 2009. 南海南部海域海面温度异常的时空分布特征[J]. 热带海洋学报, 28(4): 72-78.
|
| [14] |
王艳慧, 肖瑶, 2014. 北京市1989—2010年地表温度时空分异特征分析[J]. 国土资源遥感, 26(3): 146-152.
|
| [15] |
魏凤英, 1999. 现代气候统计诊断与预测技术[M]. 北京: 气象出版社.. (in Chinese)
|
| [16] |
|
| [17] |
|
| [18] |
|
| [19] |
|
| [20] |
|
| [21] |
|
| [22] |
|
/
| 〈 |
|
〉 |
