
基于湾流海域船载ADCP观测资料的地转平衡态和非地转动能分析
|
刘余亿(1997—), 女, 湖南省长沙市人, 硕士研究生, 从事中小尺度海洋动力过程研究。email: |
Copy editor: 姚衍桃
收稿日期: 2022-02-17
修回日期: 2022-04-17
网络出版日期: 2022-04-19
基金资助
中国科学院基础前沿科学研究计划原始创新项目(ZDBS-LY-DQC011)
国家自然科学基金项目(42225602)
国家自然科学基金项目(92058201)
国家自然科学基金项目(42149907)
Analysis of kinetic energy of balanced geostrophic motions and unbalanced wave motions based on ship-board ADCP observation data in the Gulf Stream
Copy editor: YAO Yantao
Received date: 2022-02-17
Revised date: 2022-04-17
Online published: 2022-04-19
Supported by
Original Innovation Project of Basic Frontier Scientific Research Program of CAS(ZDBS-LY-DQC011)
National Natural Science Foundation of China(42225602)
National Natural Science Foundation of China(92058201)
National Natural Science Foundation of China(42149907)
本研究基于湾流海域14a(2005—2018年)船载ADCP观测的水平流速数据, 利用Helmholtz分解和波数谱分析等方法, 分离了海域内的地转平衡态涡旋运动和非地转内波运动, 分析了两者的动能在连续波数谱空间的转换尺度, 并初步探讨了影响湾流海域转换尺度的潜在因素。研究结果表明, 湾流强流区的地转平衡态运动活跃, 其转换尺度小于10km, 且季节性差异较小; 弱流区的非地转运动显著强于强流区, 其转换尺度约为15km, 夏季(~28km)明显大于冬季(~13km); 湾流海域的转换尺度受夏秋季频繁发生的飓风向海洋输入的近惯性波动能量影响。同时, 湾流海域转换尺度的深度变化结果表明, 转换尺度与亚中尺度范围内地转平衡态运动的动能水平呈负相关关系, 当地转平衡态运动的动能占主导时, 转换尺度相应减小, 较小的转换尺度对应较弱的非地转内波动能和较强的地转平衡态动能。本研究关于地转运动和非地转运动的有效分离, 有助于理解海洋不同尺度的动力过程及其能量转化。
刘余亿 , 曹海锦 , 经志友 . 基于湾流海域船载ADCP观测资料的地转平衡态和非地转动能分析[J]. 热带海洋学报, 2023 , 42(1) : 22 -31 . DOI: 10.11978/2022030
Based on the horizontal velocity data observed by ship-board ADCP in the Gulf Stream for 14 years (2005-2018), we use the methods of Helmholtz decomposition and wavenumber spectrum analysis to decompose the balanced geostrophic motions and unbalanced wave motions of ocean, and analyze the transition scale between them. We also discuss the main factors that affect the transition scale of the Gulf Stream. The results show that the balanced geostrophic motions in the strong current region of the Gulf stream is more active, its transition scale is less than 10 km with small seasonal difference. The unbalanced motions in the weak current region are significantly stronger than that in the strong current region, and its transition scale is about 15 km, which is significantly larger in summer (~28 km) than in winter (~13 km). The transition scale of the Gulf Stream is affected by the near-inertial wave energy input by frequent hurricanes in summer and autumn. Further, the results of transition scale dependence on depth show that the transition scale is negatively correlated with the kinetic energy level of the balanced geostrophic motions at submesoscale. When the kinetic energy of balanced geostrophic is active, the transition scale decreases accordingly. The smaller transition scale corresponds to the smaller kinetic energy level of unbalanced wave motions and the larger of balanced geostrophic motions. The effective separation of balanced geostrophic motions and unbalanced wave motions in this study is helpful to understand the dynamic processes and the energy transformation at different scales.
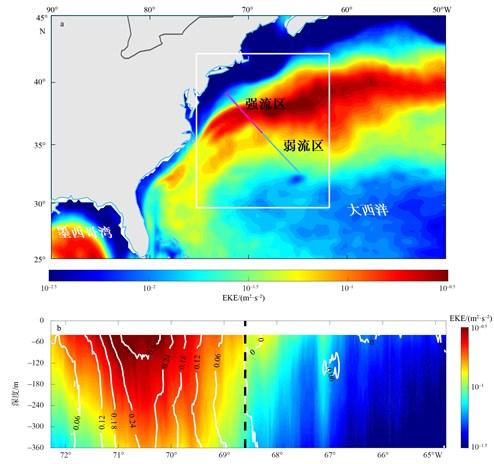
图1 研究海域多年平均的EKE分布a. 基于AVISO提供的2005—2018年日均地转流速异常数据计算得到的副热带西北大西洋海域14a平均的EKE分布, 其中EKE的计算公式为: $\mathrm{EKE}_{\mathrm{g}}=\frac{\left(u_{\mathrm{g}}^{\prime}\right)^{2}+\left(v_{\mathrm{g}}^{\prime}\right)^{2}}{2}$,$u_{\text{g}}^{'}\mathcal{和}v_{\text{g}}^{\prime}$分别为沿纬向和沿经向的地转流速异常。b. 基于2005—2018年船载ADCP观测的水平流速数据计算得到的14a平均的EKE剖面分布(填色), 其中EKE的计算公式为: $\text{EKE=}\frac{(u')^2+(v')^2}{2}$,$u'\text{}\mathbb{和}v'$分别为将观测的水平流速数据进行坐标轴转换后的沿航线和跨航线流速异常(异常是指减去14a平均的流速值)。图a中白色矩形框为距离航线300km的范围; 图b中白色等值线为14a平均的沿航线流速(单位: m·s-1), 黑色虚线为湾流强流区和弱流区的分界线(西北侧为强流区, 东南侧为弱流区)。图a基于国家测绘地理信息局标准地图服务网站下载的审图号为GS(2016)1665号的标准地图制作 Fig. 1 Regional eddy variability and eddy kinetic energy along cruises (a) Surface eddy kinetic energy distribution in the subtropical Northwest Atlantic based on the daily AVISO geostrophic current velocity anomaly data from 2005 to 2018. (b) Vertical structure of ADCP-derived eddy kinetic energy along the Oleander Project's repeating cruises. Here, eddy kinetic energy (contours) is evaluated by removing the time-mean ADCP-derived velocities from individual cruises. Note that white contours in (b) that denote the horizontal velocity data (unit: m·s-1) and is measured by the ship-board ADCP from 2005 to 2018 show the mean along-track flows. Black dotted line in (b) is the boundary between the strong current region and the weak current region of the Gulf Stream (the strong current region on the northwest and the weak current region on the southeast) |
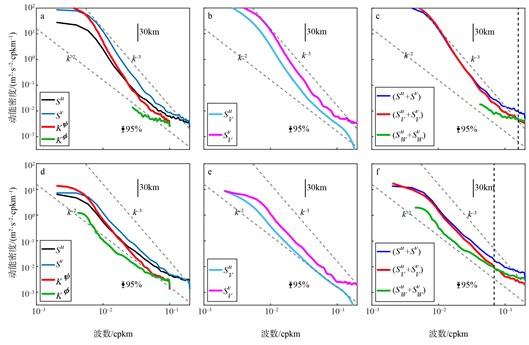
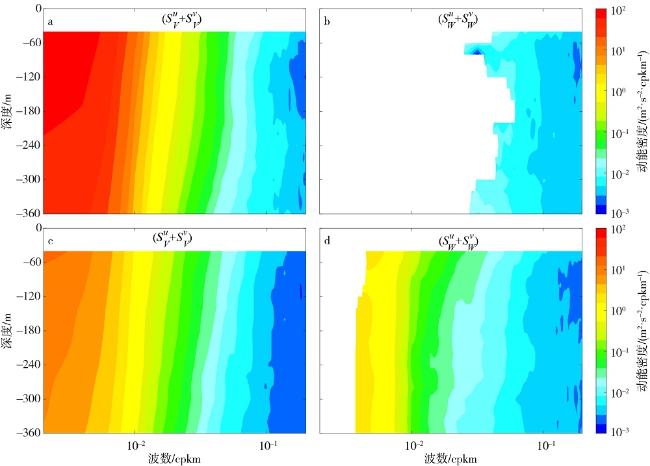
图2 强流区(a—c)和弱流区(d—f)40m深度层内各分量的动能谱分布图$S^u,S^v,K^\psi,K^\phi$分别为沿航线、跨航线、旋转分量和辐散分量的动能谱; $S_{V}^{u}$、$S_{V}^{v}$分别为沿航线和跨航线的地转平衡分量动能谱,$(S^u+S^v)$、$(S^u_V+S^v_V)$、$(S^u_W+S^v_W)$分别为总的动能谱、地转平衡分量和非地转分量的动能谱。垂直的黑色实线段表示转换尺度(30km); 灰色虚线表示k-2和k-3斜率参考曲线(k表示波数); 95%表示计算动能谱的置信区间是95% Fig. 2 Velocity Spectra at 40 m in strong current region (a~c) and weak current region (d~f) Velocity spectra of along-track, cross-track, rotational and divergent are shown by $S^u,S^v,K^\psi\text{and}K^\phi$. Along-track versus cross-track balanced geostrophic velocity spectra are shown by $(S^{u}+S^{v}),(S_{V}^{u}+S_{V}^{v})\mathrm{~and~}(S_{W}^{u}+S_{W}^{v})$ indicate the total velocity spectra with its decomposition into balanced geostrophic motions and unbalanced motions. The vertical black solid line segment indicates the transition scale. Dashed gray lines in background denote the k-2 and k-3 reference curves and the 95% denote the 95% confidence intervals |
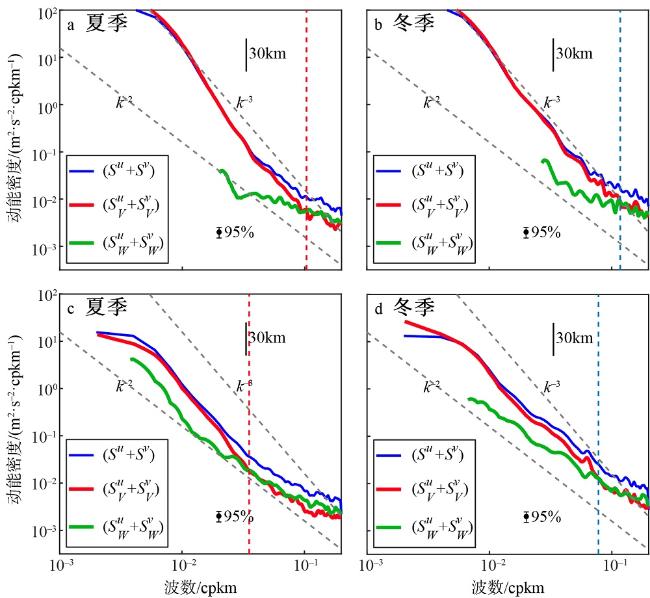
图3 强流区(a、b)和弱流区(c、d)40m深度层内冬、夏季的动能谱分布图$(S^{u}+S^{v})$为总的动能谱, $(S_{V}^{u}+S_{V}^{v})$为地转平衡分量的动能谱, $(S_{W}^{u}+S_{W}^{v})$为非地转分量的动能谱。红色虚线代表夏季的转换尺度, 蓝色虚线表示冬季的转换尺度; 灰色虚线表示k-2和k-3斜率参考曲线(k表示波数); 95%表示动能谱计算的置信区间是95% Fig. 3 Velocity spectra at 40 m depth in summer versus winter in the strong current (a, b) and weak current (c, d) regions Veloctiy spectra of total, geostrophic balanced motions and unbalanced motions are shown by $(S^{u}+S^{v}),(S_{V}^{u}+S_{V}^{v})\mathrm{and} \ (S_{W}^{u}+S_{W}^{v})$ Red dashed lines denote the summer transition scales and blue dashed lines denote the winter. Dashed gray lines in background denote the k-2 and k-3 reference curves and the 95% denote the 95% confidence intervals |
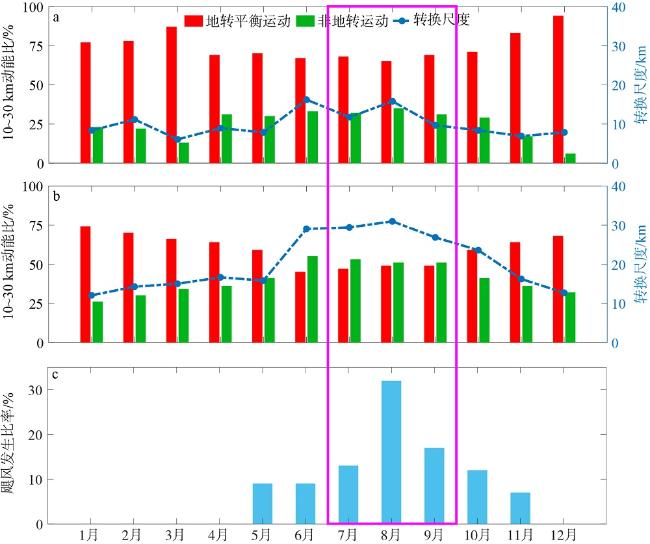
图4 飓风对上层海洋(40m深度层)转换尺度的影响a、b分别为强流区和弱流区内地转平衡分量与非地转分量的动能谱在10~30km波长范围内的积分值占该尺度内总能量比值的逐月分布, 以及该断面内转换尺度的逐月分布; c为飓风(仅考虑发生在研究海域且距离观测航线300km范围内的飓风)发生后3d内航次观测的样本数占总样本数比值的逐月分布。玫红色矩形框中为研究海域飓风发生频率较高的7—9月强流区和弱流区内各分量的变化 Fig. 4 The influence of hurricanes on transition scale at 40 m depth Monthly histograms of the integrated values of the velocity spectra of geostrophic balanced motions and unbalanced wave motions in the wavelength between 10 km and 30 km with transition scales in strong current and weak current region are shown by (a) and (b). The ratio of storm cruises for each month is shown by (c). The variation of each component in the strong and weak current region from July to September, when the frequency of hurricanes in the Gulf Stream is high, is circled by the magenta rectangle |
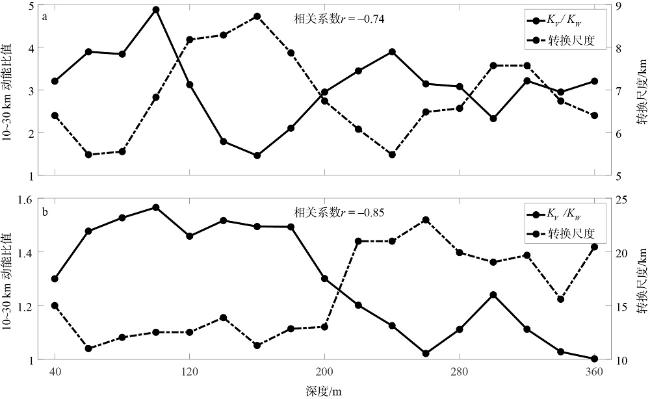
图5 强流区(a、b)和弱流区(c、d)中地转平衡态动能与非地转动能随深度的变化为地转平衡分量的动能谱, 为非地转分量的动能谱 Fig. 5 Variation of geostrophic balanced and unbalanced kinetic energy with depth in strong current (a, b) and weak current (c, d) regions and show the kinetic energy of geostrophic balanced motions and unbalanced motions, respectively |
| [1] |
|
| [2] |
|
| [3] |
|
| [4] |
|
| [5] |
|
| [6] |
|
| [7] |
|
| [8] |
|
| [9] |
|
| [10] |
|
| [11] |
|
| [12] |
|
| [13] |
|
| [14] |
|
| [15] |
|
| [16] |
|
| [17] |
|
| [18] |
|
| [19] |
|
| [20] |
|
| [21] |
|
| [22] |
|
| [23] |
|
| [24] |
|
| [25] |
|
| [26] |
|
| [27] |
|
/
| 〈 |
|
〉 |
