
孟加拉湾陆架对潮汐的影响研究
|
徐一凯(1999—), 男, 浙江省宁波市人, 硕士研究生, 主要从事物理与海洋生态环境的相互作用研究。email: |
Copy editor: 林强
收稿日期: 2022-05-22
修回日期: 2022-07-16
网络出版日期: 2022-08-02
基金资助
国家重点研发计划子课题(2021YFC3101702)
Impacts of continental shelf on tide in the Bay of Bengal
Copy editor: LIN Qiang
Received date: 2022-05-22
Revised date: 2022-07-16
Online published: 2022-08-02
Supported by
National Key Research and Development Program Sub-Project(2021YFC3101702)
徐一凯 , 胡松 , 朱宇航 , 王飞 , 张春玲 . 孟加拉湾陆架对潮汐的影响研究[J]. 热带海洋学报, 2023 , 42(3) : 67 -74 . DOI: 10.11978/2022118
The influence mechanism of the typical topography in the Bay of Bengal on the tide has not been fully understood. Therefore, this study sets up a group of controlled experiments and three groups of comparative experiments based on FVCOM (finite-volume community ocean model) to study the influence mechanism of the north, west and east continental shelf topography, as well as the influence of the most visible canyon topography in the continental shelf area on the tide. The results show that the Ganga Trough can reduce the amplitude of tidal wave near the canyon, but has little effect on the tidal range at the head of the bay; the width of the top shelf is helpful to increase the amplitude of tidal wave and the tidal range at the head of the bay; the eastern continental shelf helps to enhance Kelvin wave and increase the tidal range at the top of the bay, but the impact is not as significant as that on the top shelf; and the western continental shelf only has an impact on the western region, but has little impact on the co-tidal distribution of the whole area.
Key words: Bay of Bengal; continental shelf; FVCOM; tide; numerical experiments
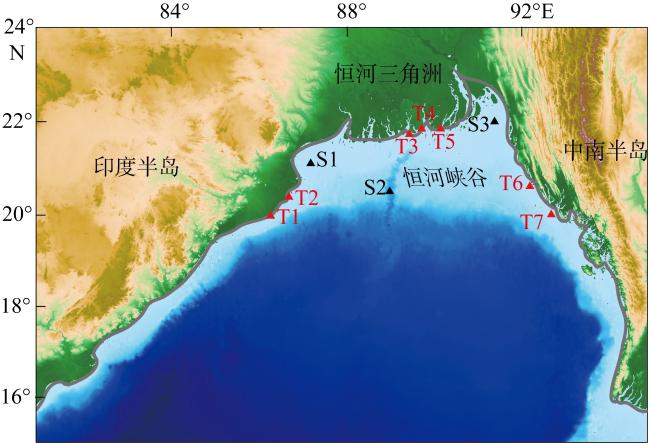
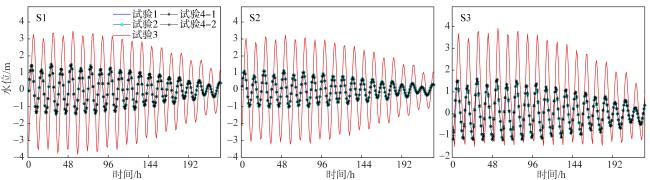
图1 研究区域示意图该图基于国家测绘地理信息局标准地图服务网站下载的审图号为GS(2016)1665号的标准地图制作。图中红点为英国水文局(U.K. Hydrographic Office, UKHO)提供的验潮站点, 黑点为试验水位取样点 Fig. 1 The location of study area. The red dots represent the tide gauge stations provided by the U.K. Hydrographic Office, and the black dots are the sampling sites of the experimental water level |
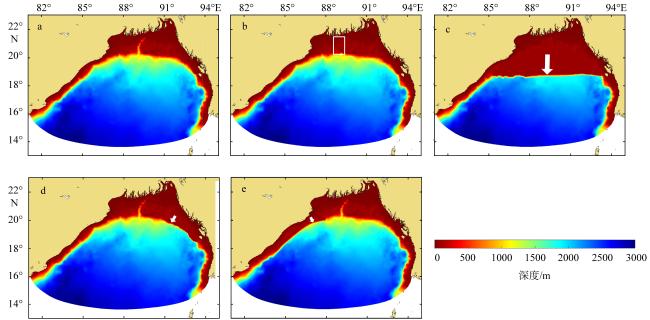
图3 控制试验及对照试验水深图图a—c分别为试验1—3的水深图, 图d、e分别为试验4东、西侧陆架的拓宽水深图; 方框为恒河峡谷填平区域示意; 箭头为陆架拓宽方向 Fig. 3 Bathymetric map of controlled and comparative experiments. (a-c) Bathymetry map of experiments 1-3; (d-e) bathymetry map of the widened eastern and western continental shelfs of experiments 4, respectively. The box is an illustration of the Ganga Trough filling area; the arrow shows the direction of continental shelf widening |
表1 孟加拉湾M2分潮振幅及迟角验证Tab. 1 Verification of the M2 tidal component amplitude and phase lag in the Bay of Bengal |
| 站点名称 | 经度 | 纬度 | 振幅H/m | 迟角g | ||||
|---|---|---|---|---|---|---|---|---|
| UKHO | 模拟 | UKHO | 模拟 | |||||
| T1 (Devi River) | 86°22′E | 19°58′N | 0.58 | 0.64 | 0.06 | 65° | 83° | 17° |
| T2 (Pardip) | 86°47′E | 20°23′N | 0.62 | 0.64 | 0.02 | 61° | 80° | 19° |
| T3 (Jefford Point) | 89°33′E | 21°44′N | 0.80 | 0.74 | -0.06 | 105° | 131° | 26° |
| T4 (Tiger Point) | 89°50′E | 21°51′N | 0.82 | 0.71 | -0.11 | 122° | 145° | 23° |
| T5 (Dhulsar) | 90°16′E | 21°51′N | 0.73 | 0.64 | -0.09 | 137° | 140° | 3° |
| T6 (St Martin's Island) | 92°19′E | 20°37′N | 0.90 | 0.80 | -0.10 | 76° | 88° | 12° |
| T7 (Sittwe) | 92°48′E | 20°00′N | 0.78 | 0.74 | -0.04 | 101° | 117° | 16° |
| 平均误差 | -0.05 | 16.6° | ||||||
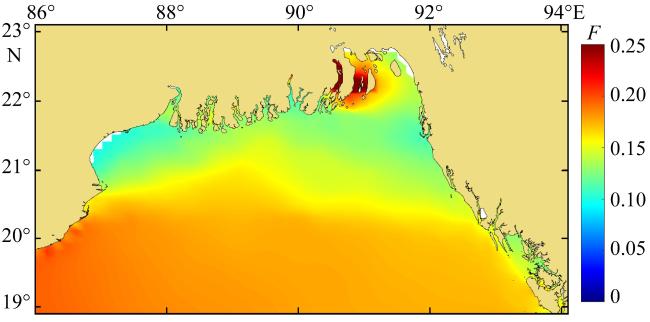
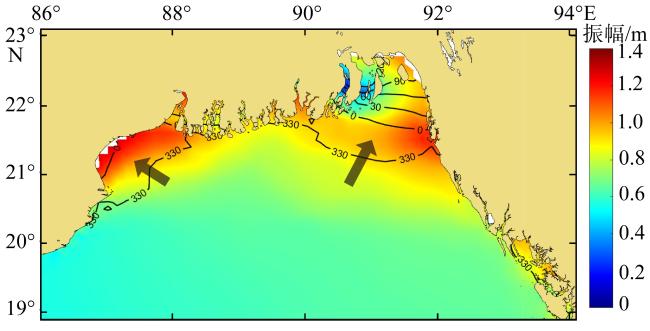
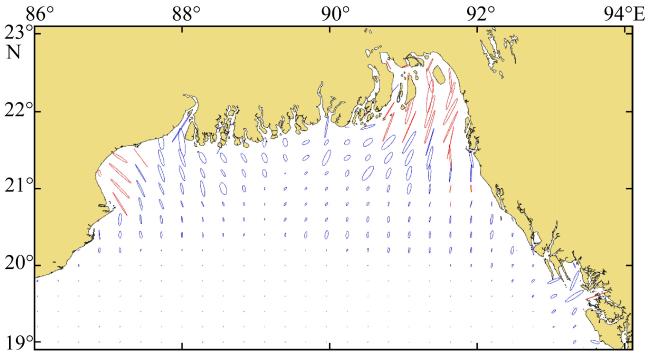
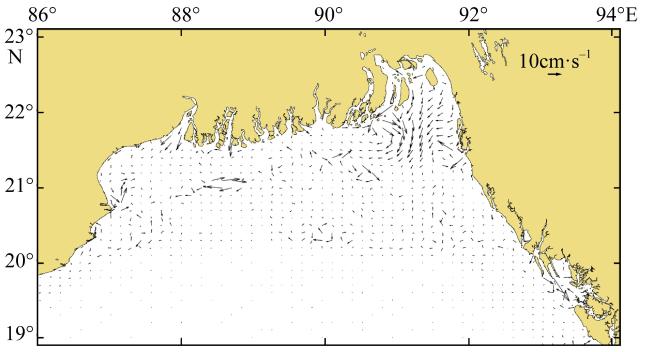
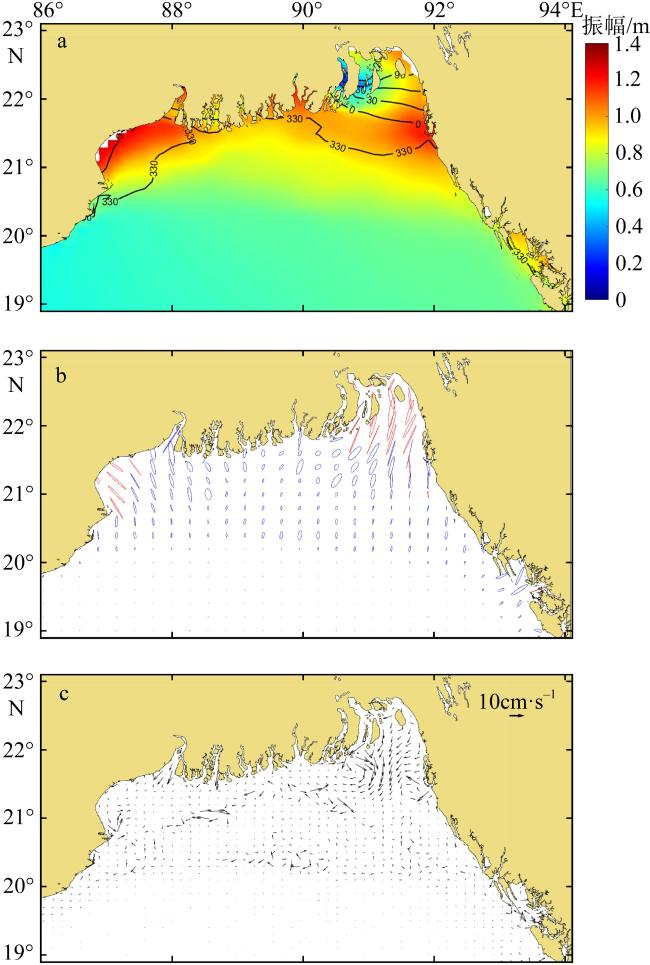
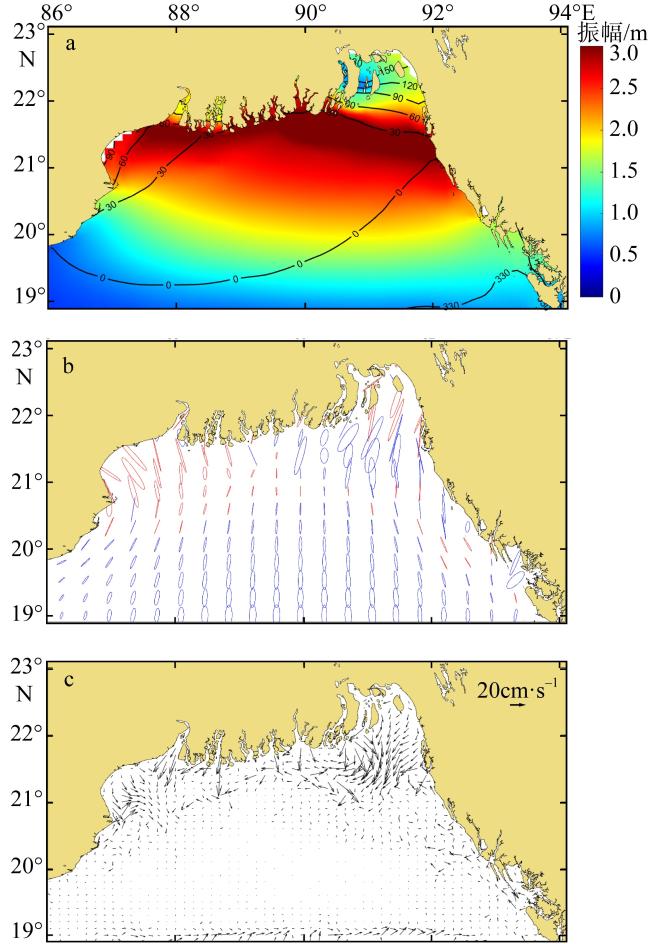
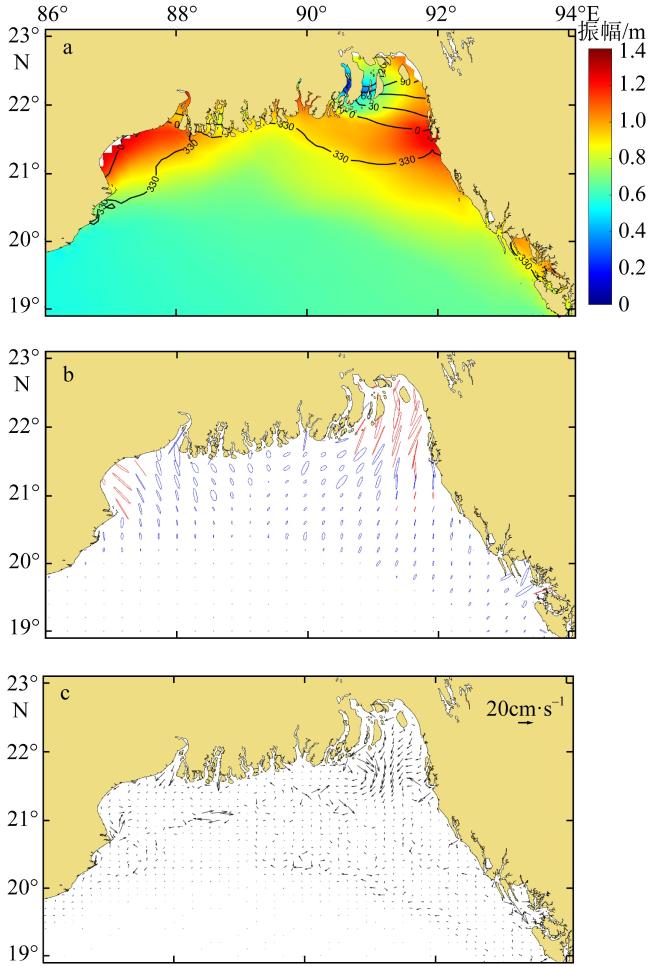
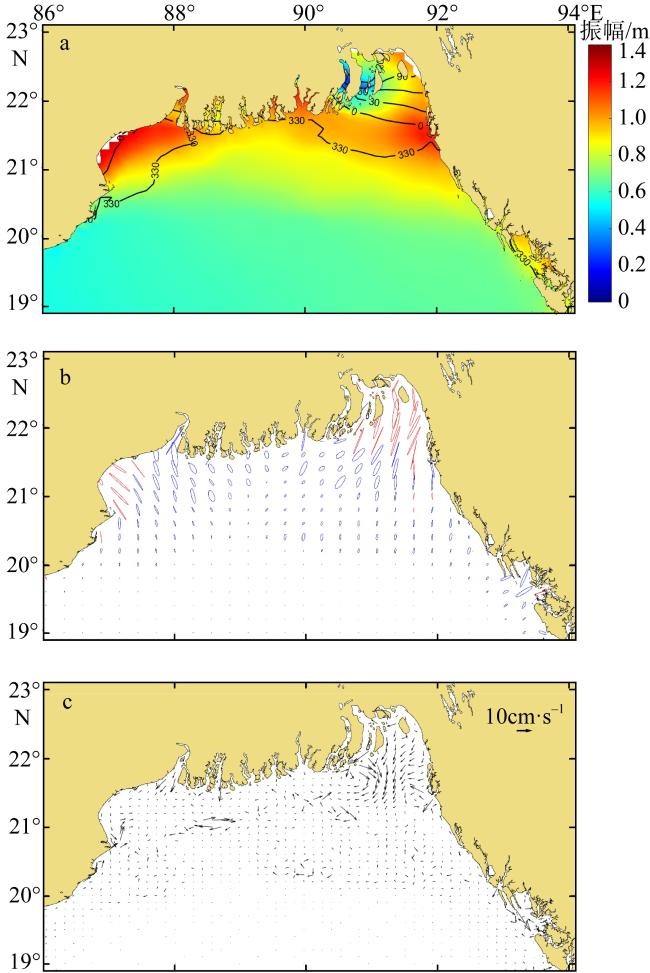
图10 东侧陆架拓宽试验M2分潮结果a. 同潮图; b. 潮流椭圆图; c. 潮致余流图 Fig. 10 Tidal component results of M2 from the east shelf widening test. (a) co-tidal map; (b) surface tidal current ellipse; (c) distribution of tidal residual current |
| [1] |
范锦晓, 胡松, 2020. 潮汐和风对马六甲海峡海流的影响[J]. 热带海洋学报, 39(4): 13-24.
|
| [2] |
李树华, 1987. 北部湾欧拉余流的初步研究[J]. 海洋湖沼通报, (3): 10-16.
|
| [3] |
吕喆, 胡松, 2017. 苏北浅滩浅水分潮特征研究[J]. 海洋湖沼通报, (2): 31-38.
|
| [4] |
王彪, 朱建荣, 2012. 基于FVCOM模型的珠江河口及其邻近海域的潮汐模拟[J]. 热带海洋学报, 31(4): 17-27.
|
| [5] |
张亚敬, 姜云鹏, 徐亚男, 等, 2021. 孟加拉湾东海岸波浪特征分析[J]. 中国水运, (3): 157-160.
|
| [6] |
朱学明, 宋德海, 鲍献文, 等, 2014. 西北太平洋的潮能通量与耗散[J]. 热带海洋学报, 33(1): 1-9.
|
| [7] |
|
| [8] |
|
| [9] |
|
| [10] |
|
| [11] |
|
| [12] |
|
| [13] |
|
| [14] |
|
| [15] |
|
| [16] |
|
| [17] |
|
/
| 〈 |
|
〉 |
