
越南沿岸上升流海表叶绿素的季节内尺度变异及机制
|
林少文(1997—), 男, 福建省福州市人, 硕士研究生, 从事海洋遥感应用研究。email: |
Copy editor: 姚衍桃
收稿日期: 2022-07-25
修回日期: 2022-10-06
网络出版日期: 2022-10-11
基金资助
国家自然科学基金项目(41906019)
Intra-seasonal regulation and mechanism on sea surface chlorophyll in the upwelling off the coast of Vietnam
Copy editor: YAO Yantao
Received date: 2022-07-25
Revised date: 2022-10-06
Online published: 2022-10-11
Supported by
National Natural Science Foundation of China(41906019)
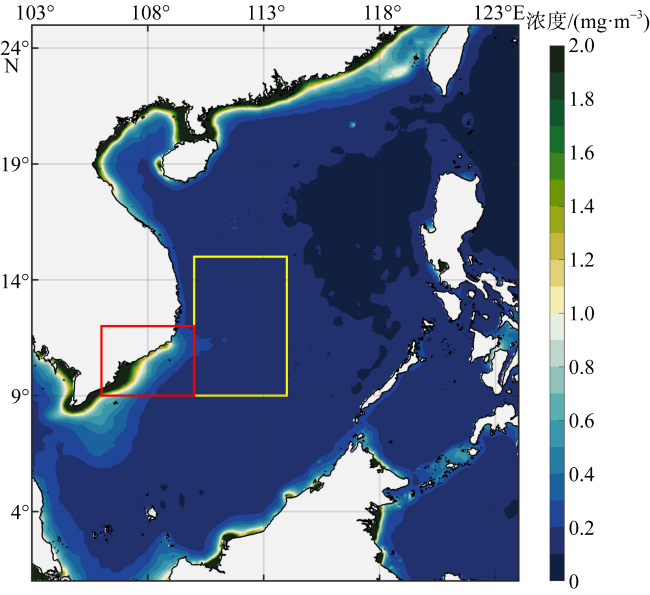
在夏季, 南海西部的越南沿岸上升流系统(Vietnam boundary upwelling system, VBUS)时常出现高浮游植物生物量。其中由马登-朱利安振荡(Madden-Julian oscillation, MJO)主导的季节内尺度(30~60d)变率占到重要作用, 但MJO对海表叶绿素的调控效应及机制尚不清楚。本研究采用重建的遥感叶绿素数据与多源观测资料, 探究MJO事件中VBUS叶绿素季节内变化特征及成因。复合分析结果显示, 在MJO事件末期, 该海域叶绿素浓度达到季节内最高值, 海表温度(sea surface temperature, SST)、地转流纬向分量与Ekman泵吸及风场与该海域叶绿素浓度相位模态高度对应, 且与叶绿素相位序列相关性按该顺序递减。进一步将VBUS分成近岸和离岸两个子区域, 通过广义加性模型分析叶绿素浓度的主导调控因子。结果显示VBUS海域沿岸与离岸区域叶绿素浓度影响因子及其强度并不相同, SST同为两个区域最强影响因子, 沿岸区域次要影响因子为地转流纬向分量及Ekman泵吸, 离岸次要影响因子为地转流纬向分量, 且其影响强度与SST平分秋色。通过进一步分析该调控在不同厄尔尼诺年的不同, 发现当MJO处于第4—8相位时, MJO能有效地补偿强厄尔尼诺事件导致的叶绿素浓度骤降。总体而言, MJO所处相位决定了其对VBUS海域叶绿素影响的程度, 且在不同子区域中因素的影响强度并不相同。本研究揭示了海洋生态系统和动力的短期变率特征, 能够为南海叶绿素浓度变异的理解提供新视角。
林少文 , 任姮烨 , 卢文芳 . 越南沿岸上升流海表叶绿素的季节内尺度变异及机制[J]. 热带海洋学报, 2023 , 42(4) : 113 -124 . DOI: 10.11978/2022166
In summer, high phytoplankton biomass often occurs in the Vietnam Boundary upwelling System (VBUS) of the western South China Sea. Therein, the variation of surface chlorophyll concentration at the intra-seasonal scale (30~60 days) dominated by Madden-Julian Oscillation (MJO) can account for considerable variation, but the regulating effects and mechanism of the modulation to sea surface chlorophyll remain unclear. In this study, reconstructed remote sensing chlorophyll data and multi-source observation data were used to explore the characteristics and causes of the VBUS chlorophyll changes during MJO events. Composite analysis showed that in the late phases of MJO events, chlorophyll reached its intraseasonal maximum, while sea surface temperature (SST), zonal geostrophic current, Ekman pumping and wind speed were highly correlated in a decreasing order. Furthermore, the VBUS was divided into two sub-regions: nearshore and offshore regions. The analysis results of generalized additive model showed that the influencing factors and intensity of chlorophyll concentration in the coastal and offshore areas of VBUS were different. SST was the most important influencing factor in both regions. For the coastal region, zonal geostrophic current and Ekman pumping contributed secondly. For the offshore region, the second influence factor was zonal component of geostrophic current, and its influence was nearly equal to that of SST. We further investigated the MJO’s modulation in different El Niño years. When MJO is in the fourth to eighth phases, the El Niño’s negative effects on the chlorophyll can be compensated. In general, our study showed that the MJO’s phase determined the impact of MJO on chlorophyll in the VBUS. At the same time, the chlorophyll concentration in VBUS sea area under MJO events was controlled by SST, geostrophic zonal component and Ekman pump suction, and the impacts of different factors on VBUS were different. The study reveals the short-term variability of marine ecosystems and dynamics and can provide a new perspective for understanding the variation of chlorophyll in the South China Sea.
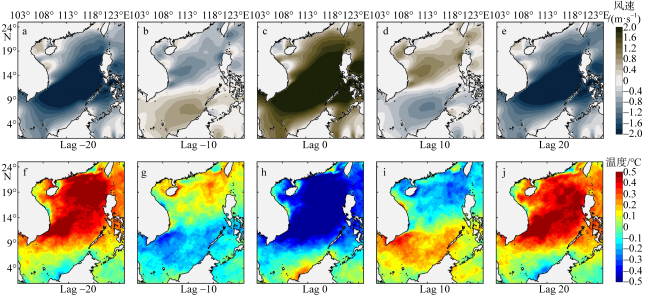
图2 夏季南海MJO风速异常(a—e)和海表温度异常(f—j)Lag 0代 Fig. 2 Summer MJO wind speed anomaly (a~e) and SST anomaly (f~j). Lag 0 represents the 11-day average of wind speed anomaly in the South China Sea with a 55 day-lag center window. Lag -20 represents the 11-day average starting from 55 days. Lag 20 represents the last 11 days, and so on |
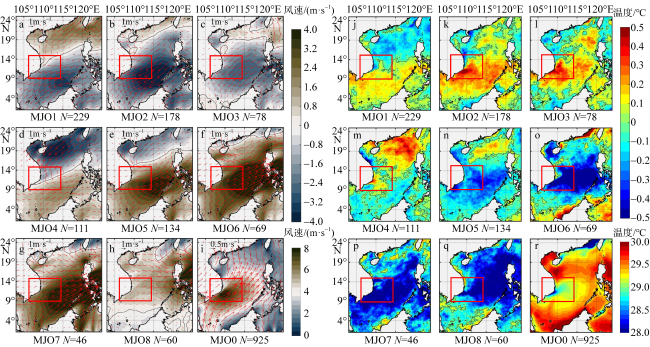
图3 南海夏季MJO风场异常(矢量)(a—i)和海表温度异常(j—r)a—h代表MJO模态(背景为风速异常), 图例对应其右侧长色标; i为非MJO风场平均(背景为风速), 图例对应其右侧短色标。j—q代表MJO模态, 图例对应其右侧长色标; r为非MJO海表温度平均, 图例对应其右侧短色标。图中红色框为VBUS海域, N代表各模态天数。该图基于国家测绘地理信息局标准地图服务网站审图号为GS(2020)4392号的标准地图制作 Fig. 3 Summer MJO surface wind anomaly (a~i) and summer MJO SST anomaly (j~r). Summer MJO wind speed anomaly (a~h) correspond to the longer color bar on the right side, and the average of non-MJO wind speed (i) corresponds to the shorter color bar on its right side. Summer MJO SST anomaly (j~q) correspond to the longer color bar on the right side, and average SST in summer (r) correspond to the shorter color bar on its right side. N represents the days of each mode. The red box shows the VBUS sea area |
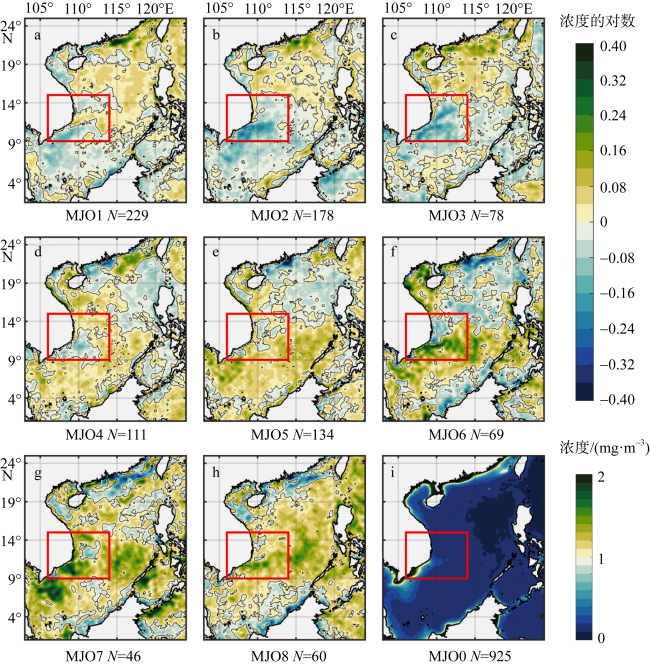
图4 南海夏季MJO叶绿素浓度异常a—h代表MJO模态(以e为底的叶绿素浓度对数), 图例为右侧长色标; i为非MJO叶绿素浓度平均(单位为: mg·m-3), 图例为右侧短色标; N代表各模态天数, 图中红框为VBUS海域。该图基于国家测绘地理信息局标准地图服务网站审图号为GS(2020)4392号的标准地图制作 Fig. 4 Summer MJO chlorophyll anomaly (a~h) and the average non MJO chlorophyll in summer (i). N represents the number of days in each mode. The red box shows the VBUS region. (a~h) correspond to the longer color bar on the right side, and (i) corresponds to the shorter color bar on the right side |
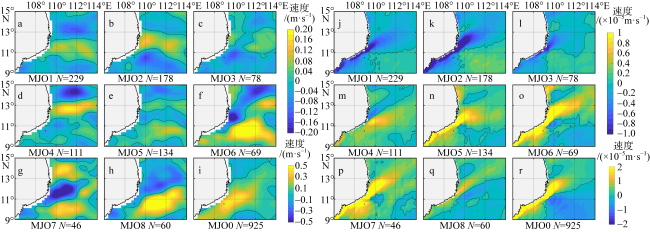
图5 南海夏季MJO地转流纬向分量异常(a—i)和Ekman泵吸速率异常(j—r)a—h代表MJO模态, 图例对应其右侧长色标; i为非MJO地转流纬向平均, 图例对应其右侧短色标。j—q代表MJO模态, 图例对应其右侧长色标, r为非MJO的Ekman泵吸速率平均, 图例对应其右侧短色标。N代表各模态天数。该图基于国家测绘地理信息局标准地图服务网站审图号为GS(2020)4392号的标准地图制作 Fig. 5 Zonal surface geostrophic velocities anomaly (a~i) and Ekman pumping velocity anomaly during summer MJO (j~r). Zonal surface geostrophic velocities anomaly (a~h) correspond to the longer color bar on the right side, and average zonal surface geostrophic velocities in summer (i) corresponds to the shorter color bar on its right side. Ekman pumping velocity anomaly (j~q) correspond to the longer color bar on the right side, and average Ekman pumping velocity (r) corresponds to the shorter color bar on its right side. N represents the days of each mode |
表1 VBUS海域叶绿素浓度与不同因素模态序列的相关性(N=8)Tab. 1 Correlation between chlorophyll concentration and mean modal sequences of various factors in the VBUS area (N=8) |
| 因素 | 与叶绿素浓度的相关系数(r) | p值 |
|---|---|---|
| SST | -0.94 | <0.001 |
| 降水 | 0.12 | 0.78 |
| 风速 | 0.64 | <0.1 |
| 海表动能 | 0.71 | <0.05 |
| 地转流纬向分量 | 0.82 | <0.05 |
| 地转流经向分量 | -0.07 | 0.87 |
| Ekman泵吸速率 | 0.81 | <0.05 |
图6 RMM指数时间序列(沿岸、离岸相同)和各因素异常时间序列红色部分为夏季MJO事件下的数据, 间距较小的两虚线区间为各年的夏季时段 Fig. 6 RMM index and time series of various factors. The first row is the time series of RMM index. Except for the first row, the left column is the time series of various factors in the coastal area, and the right column is the time series of various factors in the offshore area. The red part is the data during summer MJO events. The interval between dotted lines with small spacing is the summer time |
表2 VBUS区域各因素的GAMs结果Tab. 2 GAMs results of various factors in VBUS |
| 区域 | 因素 | 估计自由度 | 参考自由度 | F值 | p值 |
|---|---|---|---|---|---|
| 沿岸区域 | SST | 6.316 | 7.503 | 98.355 | <2×10-16*** |
| 海表动能 | 8.093 | 8.778 | 3.503 | 2.53×10⁻⁴*** | |
| 地转流纬向分量 | 8.776 | 8.983 | 16.272 | <2×10-16*** | |
| Ekman泵吸 | 2.362 | 3.081 | 11.241 | 5.19×10⁻⁷*** | |
| 海表风速 | 2.309 | 2.918 | 8.063 | 3.64×10⁻⁵*** | |
| 离岸区域 | SST | 7.290 | 8.296 | 78.722 | <2×10-16*** |
| 海表动能 | 8.648 | 8.961 | 11.181 | <2×10-16*** | |
| 地转流纬向分量 | 8.517 | 8.931 | 64.410 | <2×10-16*** | |
| Ekman泵吸 | 3.896 | 4.931 | 2.501 | 2.69×10⁻²* | |
| 海表风速 | 1.787 | 2.252 | 4.052 | 1.25×10⁻²* |
注: ***代表在0.001水平下是显著的, *代表在0.05水平下是显著的 |
表3 2010年和2016年VBUS区域各因素的GAMs结果Tab. 3 GAMs Results of various factors in VBUS coastal area in 2010 and 2016 |
| 年份 | 因素 | 估计自由度 | 参考自由度 | F值 | p值 |
|---|---|---|---|---|---|
| 2010 | SST | 3.376 | 4.112 | 2.823 | 3.743×10⁻²* |
| 海表动能 | 7.433 | 8.273 | 3.561 | 3.56×10⁻³** | |
| 地转流纬向分量 | 7.448 | 8.287 | 10.318 | <2×10-16*** | |
| Ekman泵吸 | 1.395 | 1.668 | 1.808 | 1.3650×10⁻¹ | |
| 海表风速 | 1.000 | 1.000 | 21.935 | 3.95×10⁻⁵*** | |
| 2016 | SST | 3.477 | 4.428 | 12.371 | 1.10×10⁻⁶*** |
| 海表动能 | 7.371 | 8.306 | 15.703 | <2×10-16*** | |
| 地转流纬向分量 | 9.000 | 9.000 | 51.157 | <2×10-16*** | |
| Ekman泵吸 | 7.853 | 8.611 | 5.760 | 4.24×10⁻⁵*** | |
| 海表风速 | 1.000 | 1.000 | 0.271 | 6.05×10⁻¹ |
注: ***代表在0.001水平下是显著的, **代表在0.01水平下是显著的, *代表在0.05水平下是显著的 |
| [1] |
谢艳辉, 李涛, 简伟军, 等, 2015. 海水升温对大亚湾浮游植物群落结构和光合活性的影响[J]. 热带海洋学报, 34(2): 24-31.
|
| [2] |
|
| [3] |
|
| [4] |
|
| [5] |
|
| [6] |
|
| [7] |
|
| [8] |
|
| [9] |
|
| [10] |
|
| [11] |
|
| [12] |
|
| [13] |
|
| [14] |
|
| [15] |
|
| [16] |
|
| [17] |
|
| [18] |
|
| [19] |
|
| [20] |
|
| [21] |
|
| [22] |
|
| [23] |
|
| [24] |
|
| [25] |
|
| [26] |
|
| [27] |
|
| [28] |
|
| [29] |
|
| [30] |
|
| [31] |
|
| [32] |
|
/
| 〈 |
|
〉 |

