
结合潮位校正的雷州半岛红树林湿地动态变迁遥感监测
|
申键 (1979—), 男, 广东四会人, 本科, 主要从事海域海岛管理与海洋生态修复研究。email: |
Copy editor: 孙翠慈
收稿日期: 2023-02-23
修回日期: 2023-04-11
网络出版日期: 2023-06-15
基金资助
国家自然科学基金项目(42071261)
南方海洋科学与工程广东省实验室(珠海)创新团队建设项目(311020003/311021004)
Remote sensing monitoring of mangrove wetland changes combined with tidal level correction in the Leizhou Peninsula
Copy editor: SUN Cuici
Received date: 2023-02-23
Revised date: 2023-04-11
Online published: 2023-06-15
Supported by
National Natural Science Foundation of China(42071261)
Innovation Group Project of Southern Marine Science and Engineering Guangdong Laboratory (Zhuhai)(311020003/311021004)
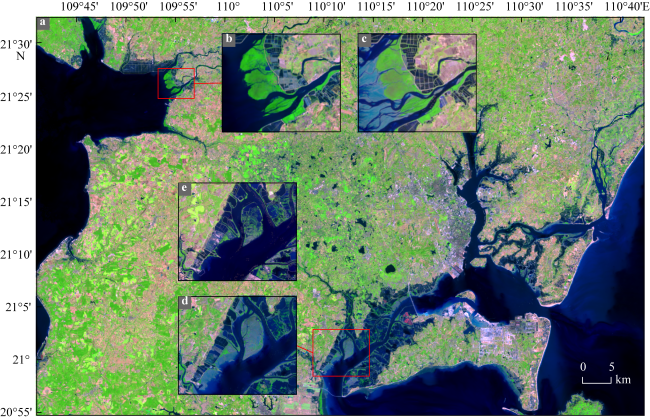
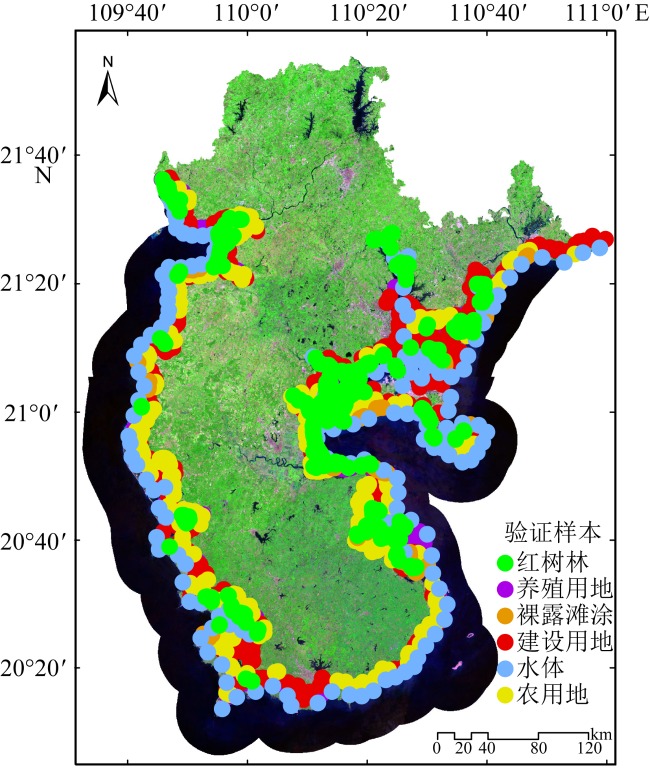
红树林生态系统对生态安全、社会和经济可持续发展提供巨大生态支持功能。本文以雷州半岛1995、2005、2015、2020年4期Landsat TM/OLI(Landsat Thematic Mapper/Operational Land Imager)影像为数据源, 考虑不同区域的潮汐规律, 使用决策树分类方法, 并结合人工修正提取了多年红树林的分布范围。根据谷歌同期高分影像进行精度验证, 4期红树林结果的总体精度分别为99.79%、98.95%、99.45%、99.15%, Kappa系数为0.9913、0.9642、0.9624、0.9766 。雷州半岛红树林的时空变化的分析结果表明, 近25年来红树林湿地呈现先减少后增加的模式, 具体表现为: (1) 雷州半岛红树林分布集中分布在英罗港、安铺港、企水港、海康港、乌石港、流沙港、外罗港、雷州湾、通明海和湛江湾等波浪掩护作用良好的泥质滩涂港湾或河口湾内, 徐闻县海安镇至锦和镇与吴川市吴阳镇以东的海岸因相对平直的海岸缺乏对波浪掩护、土壤条件差等因素, 无红树林分布; (2) 雷州半岛各市县均有红树林分布, 早期麻章区红树林面积最大, 其次为雷州市和廉江市, 赤坎区红树林分布最少, 现状廉江市的红树林占比最大; (3) 雷州半岛流失红树林面积多于新增红树林面积, 其中麻章区红树林面积流失最多, 占流失面积的一半; (4) 红树林与非红树林的互相转换类型中水体、滩涂与养殖占主体。区域红树林的精细监测变化分析, 能够为红树林湿地保护部门的工作和生态资源的可持续发展提供依据。
申键 , 简焯锴 , 欧阳雪敏 , 艾彬 . 结合潮位校正的雷州半岛红树林湿地动态变迁遥感监测[J]. 热带海洋学报, 2024 , 43(1) : 137 -153 . DOI: 10.11978/2023023
Mangrove wetlands provide important ecological support for ecological security, social and economic growth. In this paper, we discuss the temporal and spatial changes of mangrove wetlands in the Leizhou Peninsula during 1995—2020 by decision tree classification combined with the tidal pattern in different regions, based on Landsat Thematic Mapper (TM) and Operational Land Imager (OLI) sensing images. Improving the precision of mangrove information extraction is combined with artificial correction. Using high-resolution Google Earth remote sensing data, the classification accuracies in 1995, 2005, 2015, and 2020 were 99.79%, 98.95%, 99.45%, and 99.15%, and the corresponding Kappa coefficient of those years were 0.9913, 0.9642, 0.9624, and 0.9766. Over the past 25 years, mangrove wetland areas show a trend of early decrease followed by subsequent increase. The results were summarized as follows: (1) the Leizhou Peninsula’s mangrove wetlands are concentrated in wave sheltering bay or estuary, such as the Yingluo Port, Anpu Port, Qishui Port, Haikang Port, Wushi Port, Liusha Port, Wailuo Port, Leizhou Bay, Tongming Sea and Zhanjiang Bay, where silt deposits and tidal flats distribute widely. Lack of the above conditions, there is none of mangrove distribution in the seaboard of the Hai’an town of Xuwen county to the Jinhe town and east of the Wuyang town of Wuchuan county; (2) mangrove uniformly distributes all cities and counties of the Leizhou Peninsula. In early years, the Mazhang town has the largest mangrove, followed by Leizhou and Lianjiang, and Chikan has the least mangrove. Currently, Lianjiang has the largest proportion of mangrove forests; (3) the decreasing mangrove area is more than the increasing mangrove area, and half of area is lost in the Mazhang town; (4) the conversion of mangrove forest and non-mangrove mutual landscape occurrs to water, beach and mariculture. The monitoring analysis of regional mangrove forest provides a basis for the protection of mangrove wetland and the sustainable development of ecological resources.
Key words: mangrove; tidal rhythm; decision tree classification; Landsat; Leizhou Peninsula
表1 遥感数据来源及参数Tab. 1 Remote sensing data sources and parameters |
| 年份 | 传感器型号 | 分辨率/m | 行列号 | 西区影像 | 东区影像 | ||
|---|---|---|---|---|---|---|---|
| 获取时间(GMT+8) | 云量/% | 获取时间(GMT+8) | 云量/% | ||||
| 2020年 | Landsat 8 OLI | 30 | 124/46 | 2021-12-03 11:05:38 | 0.04 | 2020-01-31 11:05:22 | 2.44 |
| Landsat 8 OLI | 30 | 124/45 | 2021-12-03 11:05:14 | 0.08 | 2020-01-31 11:04:58 | 5.43 | |
| 2015年 | Landsat 8 OLI | 30 | 124/46 | 2015-01-01 11:05:17 | 3.50 | 2016-12-05 11:05:35 | 9.32 |
| Landsat 8 OLI | 30 | 124/45 | 2015-01-01 11:04:53 | 0.10 | 2016-12-05 11:05:11 | 11.31 | |
| 2005年 | Landsat 5 TM | 30 | 124/46 | 2006-01-24 10:55:16 | 33.00 | 2004-12-04 10:50:45 | 2.00 |
| Landsat 5 TM | 30 | 124/45 | 2006-01-24 10:54:53 | 7.00 | 2004-12-04 10:50:21 | 0.00 | |
| 1995年 | Landsat 5 TM | 30 | 124/46 | 1994-01-23 10:26:32 | 1.00 | — | — |
| Landsat 5 TM | 30 | 124/45 | 1994-01-23 10:26:09 | 0.00 | — | — | |
注: “—”表示无数据 |
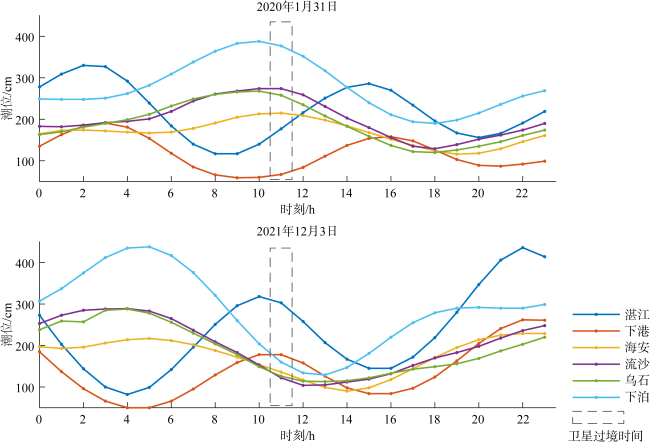
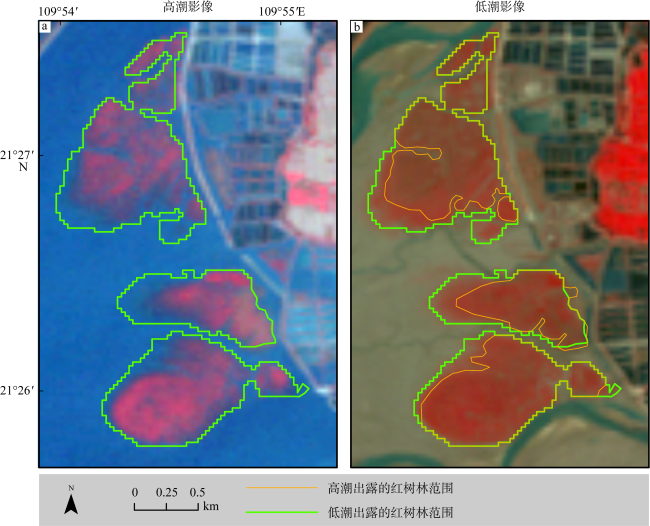
图2 不同区域的潮位差异a、 b、d: 2020年1月31日的影像; c、 e: 2021年12月3日对应的局部区域图。 Fig. 2 Variations of tide levels in different regions. (a), (b), (d) are images of January 31, 2020, and (c), (e) are local area maps corresponding to December 3, 2021 |
表3 红树林后处理数据精度统计Tab. 3 Accuracy statistics of mangrove post-processing data |
| 年份 | 总体精度 | Kappa系数 |
|---|---|---|
| 1995年 | 99.79% | 0.9913 |
| 2005年 | 98.95% | 0.9642 |
| 2015年 | 99.45% | 0.9624 |
| 2020年 | 99.15% | 0.9766 |
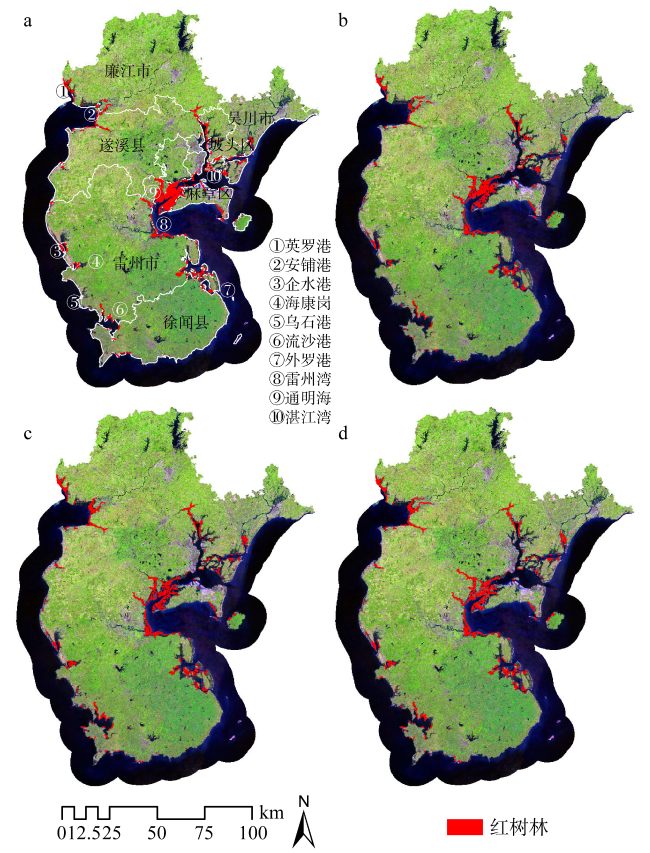
图6 雷州半岛红树林分布a. 1995年; b. 2005年; c. 2015年; d. 2020年; 审图号GS(2019)3266 Fig. 6 Mangrove distribution in the Leizhou Peninsula, (a) 1995; (b) 2005; (c) 2015; (d) 2020 |
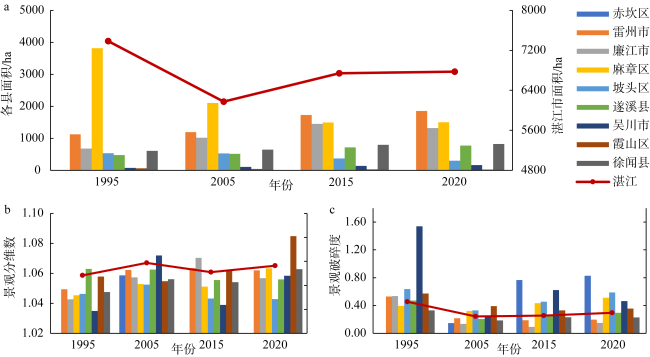
图8 湛江市及各县的红树林变化情况a. 面积变化; b. 景观分维数变化; c. 景观破碎度变化 Fig. 8 Changes of mangroves in the Zhanjiang City and its counties (a) changes in area; (b) changes in landscape fractal dimensions; (c) changes in landscape fragmentation |
表S1. 湛江市及各县市(区)红树林景观变化统计表Tab. S1 Statistical table of mangrove landscape changes in the Zhanjiang City and its counties |
| 区域 | 红树林面积/hm² | 景观分维数 | 景观破碎度 | |||||||||
|---|---|---|---|---|---|---|---|---|---|---|---|---|
| 1995 | 2005 | 2015 | 2020 | 1995 | 2005 | 2015 | 2020 | 1995 | 2005 | 2015 | 2020 | |
| 赤坎区- | 0 | 6.75 | 2.61 | 2.42 | — | 1.0587 | 1.0203 | 1.0203 | — | 0.15 | 0.77 | 0.83 |
| 雷州市+ | 1124.45 | 1192.60 | 1730.67 | 1853.19 | 1.0494 | 1.0623 | 1.0635 | 1.0619 | 0.53 | 0.22 | 0.19 | 0.20 |
| 廉江市 | 682.39 | 1018.62 | 1454.71 | 1321.50 | 1.0427 | 1.0573 | 1.0703 | 1.0567 | 0.53 | 0.13 | 0.09 | 0.15 |
| 麻章区 | 3817.56 | 2107.74 | 1496.73 | 1501.53 | 1.0454 | 1.0529 | 1.0512 | 1.0633 | 0.39 | 0.32 | 0.43 | 0.51 |
| 坡头区- | 532.55 | 526.19 | 369.22 | 305.20 | 1.0463 | 1.0525 | 1.0432 | 1.0429 | 0.64 | 0.33 | 0.46 | 0.59 |
| 遂溪县+ | 480.55 | 517.61 | 719.84 | 775.43 | 1.0629 | 1.0625 | 1.0556 | 1.0560 | 0.47 | 0.20 | 0.25 | 0.30 |
| 吴川市+ | 74.06 | 110.67 | 136.60 | 161.88 | 1.0349 | 1.0720 | 1.0389 | 1.0583 | 1.54 | 0.23 | 0.62 | 0.46 |
| 霞山区- | 62.71 | 45.97 | 30.25 | 28.04 | 1.0579 | 1.0548 | 1.0626 | 1.0848 | 0.57 | 0.39 | 0.33 | 0.36 |
| 徐闻县+ | 610.96 | 647.09 | 799.29 | 824.20 | 1.0476 | 1.0561 | 1.0541 | 1.0628 | 0.33 | 0.18 | 0.23 | 0.23 |
| 湛江市 | 7385.21 | 6173.23 | 6739.92 | 6773.39 | 1.0484 | 1.0588 | 1.0511 | 1.0563 | 0.45 | 0.24 | 0.25 | 0.29 |
注: 地区后的符号“-”表示红树林面积在持续减少, “+”表示红树林面积在持续增多; 表中“—”表示无数据。 |
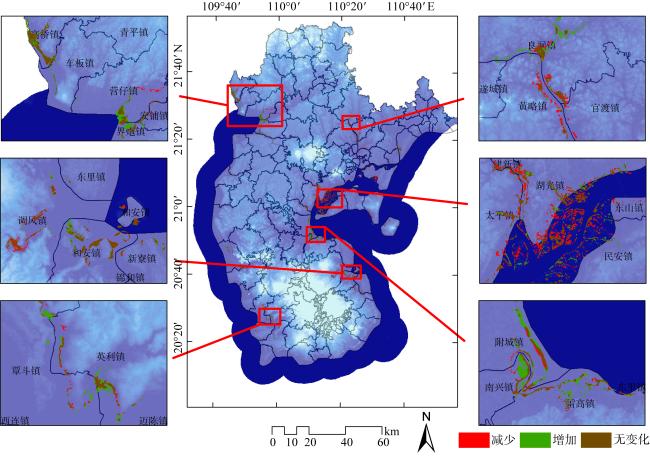
图9 1995—2005年雷州半岛红树林变化分布审图号GS(2019)3266 Fig. 9 Distribution of mangrove changes in the Leizhou Peninsula from 1995 to 2005 |
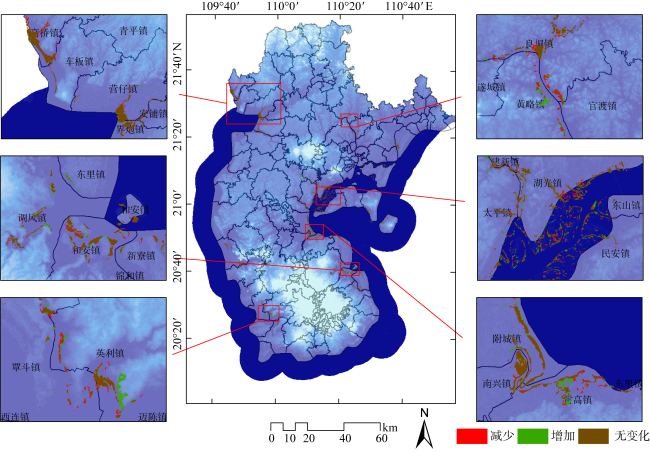
图10 2005—2015年雷州半岛红树林变化分布审图号GS(2019)3266 Fig. 10 Distribution of mangrove changes in the Leizhou Peninsula from 2005 to 2015 |
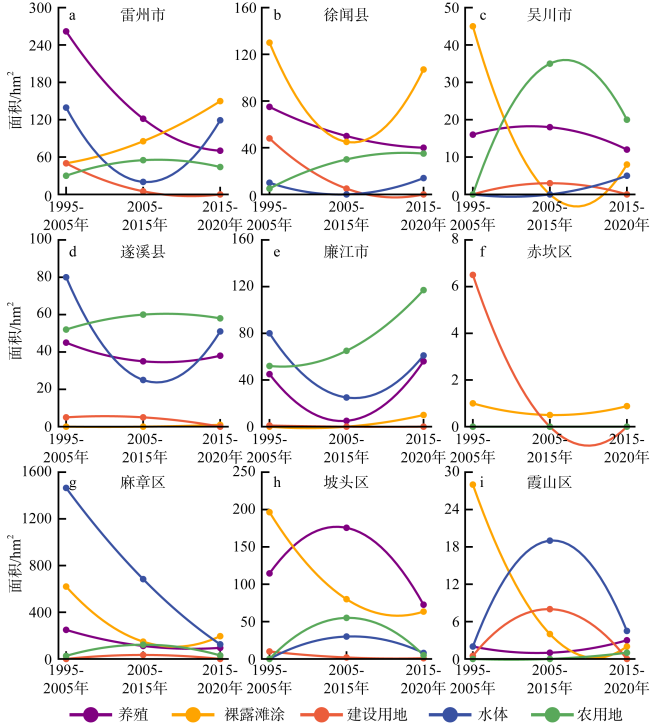
图12 1995—2020年湛江各县市(区)红树林流失动态Fig. 12 Dynamics of mangrove loss in the Zhanjiang City from 1995 to 2020 |
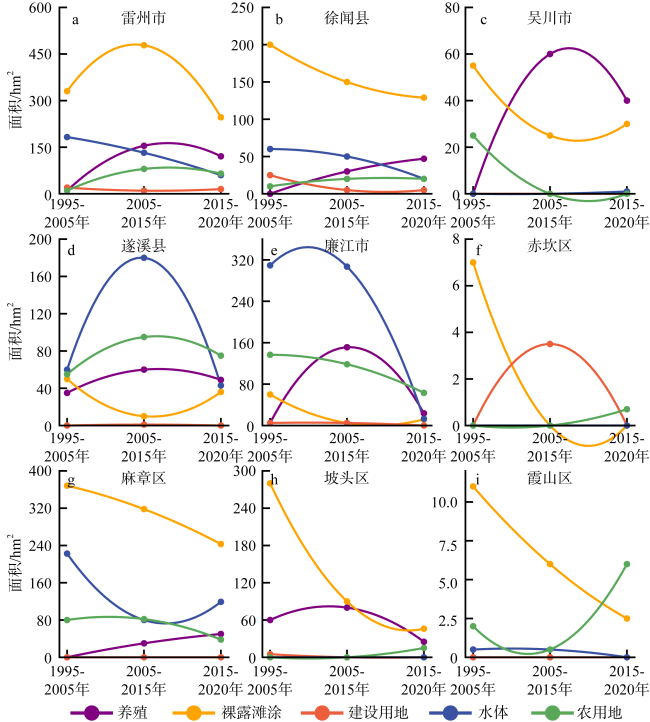
图13 1995—2020年湛江各县市(区)红树林增加动态Fig. 13 Dynamics of mangrove increase in the Zhanjiang City from 1995 to 2020 |
表S2 1995—2020年麻章区红树林与周边景观类型面积转化表Tab. S2 Area conversion between mangrove and other land cover types in the Mazhang District from 1995 to 2020 |
| 主要景观类型 | 1995—2005年 红树林面积/hm² | 2005—2015年 红树林面积/hm² | 2015—2020年 红树林面积/hm² | |||
|---|---|---|---|---|---|---|
| 转入 | 转出 | 转入 | 转出 | 转入 | 转出 | |
| 养殖 | — | 249.23 | 30.03 | 111.41 | 49.98 | 95.05 |
| 裸露滩涂 | 368.33 | 620.10 | 318.01 | 148.21 | 243.00 | 195.15 |
| 建设用地 | — | — | — | 34.21 | — | — |
| 水体 | 222.57 | 1464.99 | 79.92 | 683.73 | 119.16 | 125.20 |
| 农用地 | 80.04 | 26.27 | 81.94 | 125.20 | 38.02 | 30.16 |
| 总计 | 670.74 | 2360.59 | 509.9 | 1102.76 | 450.16 | 445.56 |
注:表中“—”表示无转化。 |
表S3 1995—2020年雷州市红树林与周边景观类型面积转化表Tab. S3 Area conversion between mangrove and other land cover types in the Leizhou City from 1995 to 2020 |
| 主要景观类型 | 1995—2005年 红树林面积/hm² | 2005—2015年 红树林面积/hm² | 2015—2020年 红树林面积/hm² | |||
|---|---|---|---|---|---|---|
| 转入 | 转出 | 转入 | 转出 | 转入 | 转出 | |
| 养殖 | 10.02 | 261.84 | 154.57 | 121.57 | 120.65 | 70.21 |
| 裸露滩涂 | 330.40 | 50.06 | 478.31 | 85.40 | 246.31 | 149.83 |
| 建设用地 | 20.04 | 49.95 | 9.98 | 5.05 | 14.98 | — |
| 水体 | 182.57 | 139.45 | 132.2 | 20.10 | 60.00 | 119.10 |
| 农用地 | 10.09 | 30.00 | 79.94 | 55.02 | 65.12 | 44.01 |
| 总计 | 553.12 | 531.30 | 855.00 | 287.14 | 507.06 | 383.18 |
注:表中“—”表示无转化。 |
表S4 1995—2020年坡头区红树林与周边景观类型面积转化表Tab. S4 Area conversion between mangrove and other land cover types in the Potou District from 1995 to 2020 |
| 主要景观类型 | 1995—2005年 红树林面积/hm² | 2005—2015年 红树林面积/hm² | 2015—2020年 红树林面积/hm² | |||
|---|---|---|---|---|---|---|
| 转入 | 转出 | 转入 | 转出 | 转入 | 转出 | |
| 养殖 | 60.14 | 114.51 | 79.87 | 175.55 | 25.03 | 72.61 |
| 裸露滩涂 | 280.07 | 196.42 | 90.11 | 80.00 | 45.87 | 63.39 |
| 建设用地 | 5.02 | 10.02 | — | 1.98 | — | 1.03 |
| 水体 | — | — | — | 29.86 | — | 8.13 |
| 农用地 | — | — | — | 55.14 | 14.92 | 4.89 |
| 总计 | 345.23 | 320.95 | 169.98 | 342.53 | 85.82 | 150.05 |
注:表中“—”表示无转化。 |
表S5 1995—2020年廉江市红树林与周边景观类型面积转化表Tab. S5 Area conversion between mangrove and other land cover types in the Lianjiang City from 1995 to 2020 |
| 主要景观类 | 1995—2005年 红树林面积/hm² | 2005—2015年 红树林面积/hm² | 2015—2020年 红树林面积/hm² | |||
|---|---|---|---|---|---|---|
| 转入 | 转出 | 转入 | 转出 | 转入 | 转出 | |
| 养殖 | 5.12 | 45.24 | 151.22 | 4.96 | 23.59 | 56.11 |
| 裸露滩涂 | 60.01 | — | 5.22 | — | 11.76 | 9.88 |
| 建设用地 | 4.68 | 1.14 | 5.26 | — | — | — |
| 水体 | 309.40 | 80.21 | 306.91 | 24.82 | 13.00 | 61.03 |
| 农用地 | 136.64 | 51.74 | 118.39 | 65.13 | 63.14 | 117.06 |
| 总计 | 515.85 | 178.33 | 587.00 | 94.91 | 113.49 | 244.08 |
注:表中“—”表示无转化。 |
| [1] |
曹林, 韩维栋, 李凤凤, 等, 2010. 雷州湾红树湿地景观格局演变及驱动力分析[J]. 林业科技开发, 24(4): 18-23.
|
| [2] |
陈云, 戴锦芳, 李俊杰, 2008. 基于影像多种特征的CART决策树分类方法及其应用[J]. 地理与地理信息科学, 24(2): 33-36.
|
| [3] |
但新球, 廖宝文, 吴照柏, 等, 2016. 中国红树林湿地资源、保护现状和主要威胁[J]. 生态环境学报, 25(7): 1237-1243.
|
| [4] |
韩维栋, 高秀梅, 1998. 湛江红树林的保护策略[J]. 广东林业科技, (3): 18-22.
|
| [5] |
何洪钜, 1987. 华南沿海潮汐基本特征[J]. 热带海洋学报, 6(2): 39-47.
|
| [6] |
何闪闪, 孙羽, 2022. 绿肺焕发生机蓝碳凸显价值——广东湛江吹响建设”红树林之城”号角[J]. 环境, (2): 55-56 (in Chinese).
|
| [7] |
黄桂林, 1996. 中国红树林湿地的保护与发展[J]. 林业资源管理, (5): 15-18 (in Chinese).
|
| [8] |
贾明明, 2014. 1973-2013年中国红树林动态变化遥感分析[D]. 长春: 中国科学院研究生院(东北地理与农业生态研究所).
|
| [9] |
姜刘志, 杨道运, 梅立永, 等, 2018. 深圳市红树植物群落碳储量的遥感估算研究[J]. 湿地科学, 16(5): 618-625.
|
| [10] |
李春干, 代华兵, 2014. 红树林空间分布信息遥感提取方法[J]. 湿地科学, 12(5): 580-589.
|
| [11] |
廖宝文, 张乔民, 2014. 中国红树林的分布、面积和树种组成[J]. 湿地科学, 12(4): 435-440.
|
| [12] |
林鹏, 1997. 中国红树林生态系[M]. 北京: 科学出版社.
|
| [13] |
林鹏, 傅勤, 1995. 中国红树林环境生态及经济利用[M]. 北京: 高等教育出版社.
|
| [14] |
孟佩, 2015. 广东湛江红树林国家级自然保护区功能区调整与评价研究[D]. 长沙: 中南林业科技大学.
|
| [15] |
彭逸生, 周炎武, 陈桂珠, 2008. 红树林湿地恢复研究进展[J]. 生态学报, 28(2): 786-797.
|
| [16] |
石莉, 2002. 中国红树林的分布状况、生长环境及其环境适应性[J]. 海洋信息技术与应用, (4): 14-18.
|
| [17] |
唐道斌, 辛存林, 陈宁, 等, 2022. 2000—2018年湛江通明海红树林破碎化及生态服务价值[J]. 应用生态学报, 34(2): 415-422.
|
| [18] |
吴中亨, 蔡俊欣, 叶亲柏, 2000. 无瓣海桑引种及推广效果分析[J]. 广东林业科技, (2): 6-10.
|
| [19] |
徐芳, 2020. 基于Sentinel-2的红树林提取及碳储量估算研究[D]. 兰州: 兰州交通大学.
|
| [20] |
杨彩福, 焦学志, 2008. 近50年来湛江市年极端气温统计分析[J]. 广东气象, 30(3): 14-16.
|
| [21] |
杨新华, 2001. 湛江市的干旱状况及水资源的可持续利用[J]. 华中农业大学学报(社会科学版), (4): 19-23.
|
| [22] |
于航, 刘学录, 赵天明, 等, 2022. 基于景观格局的祁连山国家公园景观生态风险评价[J]. 生态科学, 41(2): 99-107.
|
| [23] |
郁林, 党星海, 纪婵, 等, 2021. 珠海市湿地景观格局演变及其驱动力分析[J]. 地理空间信息, 19(11): 48-53+7.
|
| [24] |
湛江市人民政府, (2023-04-14), [2023-04-26]. 湛江概况[EB-OL]. https://www.zhanjiang.gov.cn-mlzj-zjgk-content-post1300793.html
|
| [25] |
张乔民, 于红兵, 陈欣树, 等, 1997. 红树林生长带与潮汐水位关系的研究[J]. 生态学报, 17(3): 258-265.
|
| [26] |
张苇, 林广旋, 刘一鸣, 2011. 湛江红树林国家级自然保护区人工造林现状及造林技术探讨[J]. 湿地科学与管理, 7(1): 37-39.
|
| [27] |
张希然, 罗旋, 1987. 湛江港和雷州湾海涂土壤特性[J]. 热带地理, 7(2): 128-136.
|
| [28] |
张雪红, 葛州徽, 甄晓菊, 等, 2022. 结合潮位与DEM的红树林遥感识别研究[J/OL], 南京信息工程大学学报(自然科学版), 1-12.
|
| [29] |
张雪红, 周杰, 魏瑗瑗, 等, 2013. 结合潮位信息的红树林遥感识别[J]. 南京信息工程大学学报(自然科学版), 5(6): 501-507.
|
| [30] |
|
| [31] |
|
| [32] |
|
| [33] |
|
| [34] |
|
| [35] |
|
| [36] |
|
| [37] |
|
| [38] |
|
| [39] |
|
| [40] |
|
| [41] |
|
| [42] |
|
| [43] |
|
| [44] |
|
| [45] |
|
/
| 〈 |
|
〉 |


