
利用H/V方法研究琼北火山区的浅表层地质变化特征
|
曹佳俊(1995—), 男, 湖北省黄冈市人, 硕士研究生, 从事海洋地球物理研究。email: |
Copy editor: 姚衍桃
收稿日期: 2020-12-07
修回日期: 2021-03-03
网络出版日期: 2021-03-06
基金资助
国家自然科学基金(42076071)
国家自然科学基金(U1701641)
南方海洋科学与工程广东省实验室(广州)人才团队引进重大专项(GML2019ZD0204)
广东特支计划本土创新创业团队项目(2019BT02H594)
海南省重点研发计划项目(ZDYF2020198)
Shallow geological structure in the Qiongbei volcanic area by using H/V method
Copy editor: YAO Yantao
Received date: 2020-12-07
Revised date: 2021-03-03
Online published: 2021-03-06
Supported by
National Natural Science Foundation of China(42076071)
National Natural Science Foundation of China(U1701641)
Key Special Project for Introduced Talents Team of Southern Marine Science and Engineering Guangdong Laboratory (Guangzhou)(GML2019ZD0204)
Guangdong Key Project(2019BT02H594)
Hainan Key Research and Development Project(ZDYF2020198)
海南琼北活火山作为华南沿海重要的第四纪火山, 一直受到国内外学者的广泛关注, 目前对该火山的形成演化已开展了大量深部地质结构的研究, 但对其表层地质结构特征仍然缺乏详细了解。水平-垂直频谱比法(简称H/V方法)已被广泛应用于浅表层地质结构的研究, 本文基于35个便携式微功耗地震仪组成的流动台阵观测数据, 采用经典全波场H/V(full)和瑞利波椭圆率H/V(Ray)分析方法, 获得了琼北火山区H/V曲线峰值频率(F0)和放大倍数(A0)的空间变化特征。琼北火山区H/V曲线峰值频率变化强烈, 以长流-仙沟断裂为界, 断裂西南侧很难从H/V曲线中获取清晰的F0和A0, 而断裂东北侧则存在明显的F0和A0。结合已有地质资料, 本文认为长流-仙沟断裂西南侧处于凹陷区, 其浅表层火山岩未发生明显的风化作用, 而东北侧位于隆起区域, 地表火山岩受到了比较严重的风化作用。这一研究结果表明, H/V方法可反映表层火山岩的风化状态, 火山岩出露场地H/V曲线的峰值频率和放大倍数随风化作用程度的增强而表现得更加明显。本研究为琼北火山区浅表火山岩风化状态和地震危险性评估提供了重要的信息支撑。
曹佳俊 , 郭震 , 夏少红 , 张昌榕 , 吴晓阳 , 任鹏飞 . 利用H/V方法研究琼北火山区的浅表层地质变化特征[J]. 热带海洋学报, 2022 , 41(1) : 184 -193 . DOI: 10.11978/2020148
The Hainan Qiongbei volcanic area is a typical Quaternary volcanic area in the coastal area of South China, which has attracted worldwide attention. Previous studies focused more on deep geological structures and the evolution of this volcano, but its surface geological structure is not yet well understood. Horizontal-to-vertical (H/V) spectrum of microtremors has been widely applied to shallow subsurface structures. By using classic full wave field H/V(full) and the Rayleigh wave ellipticity H/V(Ray) methods, we obtained spatial variation of peak frequency (F0) and the amplification (A0) from a seismic array of 35 short-period seismometers in the Qiongbei volcanic area. The results show that the peak frequency of the H/V curve in the Qiongbei volcanic area is significantly different on both sides of the Changliu-Xiangou fault. Clear F0 and A0 can be found at every site on the northeast side of the fault, while they do not exist on the opposite side of the fault. Based on the existing geological data, we believe that the shallow volcanic rocks at the southwest side of the Changliu-Xiangou fault have not undergone significant weathering under the condition of geological depression background, while the northeast side of the fault is located in an uplift area, so the rocks have been weathered seriously. Our results show that the H/V method can be used to evaluate the weathering state of surface volcanic rocks, and the peak frequency and amplification factor of the H/V curve of the outcropping site of the volcanic rocks are more obvious with the increasing of the degree of weathering. Our study provides important information for the weathering state of the volcanic rocks in the shallow and seismic risk assessment of this area.
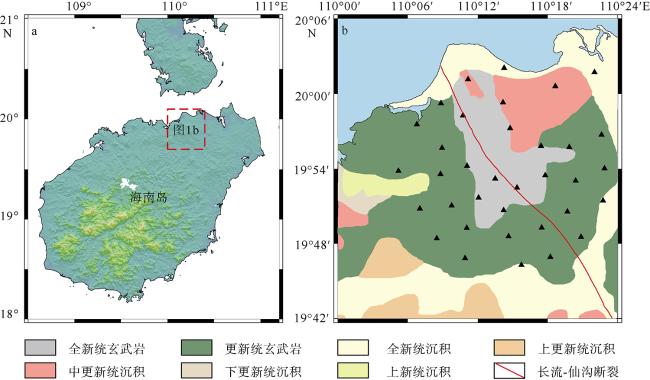
图1 海南琼北活火山位置(a)与地表地质图(b)该图基于国家测绘地理信息局标准地图服务网站下载的审图号为GS(2019)1825号的标准地图制作。图a红色方框代表研究区; 图b改自海南省1: 100万地质图(1999年), 黑色三角表示观测台站 Fig. 1 (a) The location of Hainan Qiongbei volcano. The red box is the study area. (b) The surface geology of the area (modified from 1:1000000 geological map of Hainan province), with black triangles indicating the station distribution |
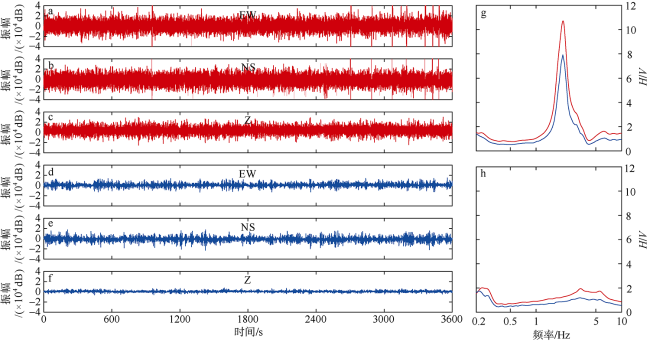
图3 沉积场与基岩场的H/V曲线对比图a Comparison of H/V curves of sedimentary site (red) and bedrock site (blue). (a) shows the three-component waveform records of sedimentary site (red) and bedrock site (blue) in the same period. From top to bottom, it is EW, NS and Z components, respectively. The amplitude of horizontal component on the sedimentary site is significantly larger than that of the bedrock site under the same scale. (b) is the H/V curve of the sedimentary site. (c) is the H/V curve of the basement site. The red and blue lines represent H/V(full) and H/V(Ray) curves, respectively |
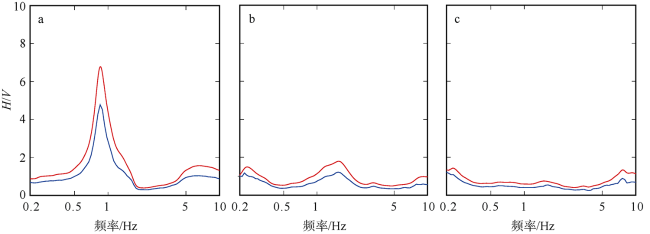
图4 海南琼北火山区H/V曲线的主要类型a. 清晰峰值型; b. 低峰值型; c. 无峰值型。红色曲线代表H/V(full), 蓝色曲线代表H/V(Ray) Fig. 4 Topology of the H/V curves observed in Hainan Qiongbei volcano area: (a) cure with clear peak; (b) cure with low peak; (c) cure with no peak. The red and blue lines represent H/V(full) and H/V(Ray) cures, respectively |
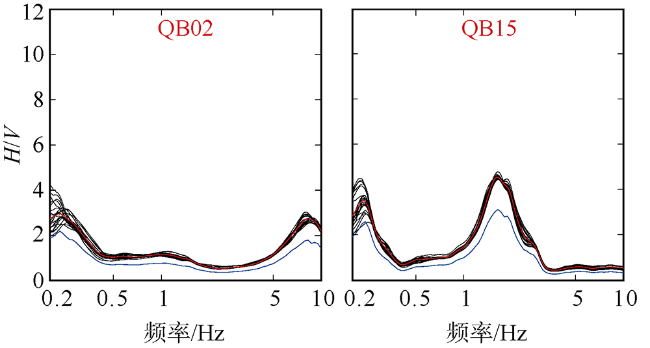
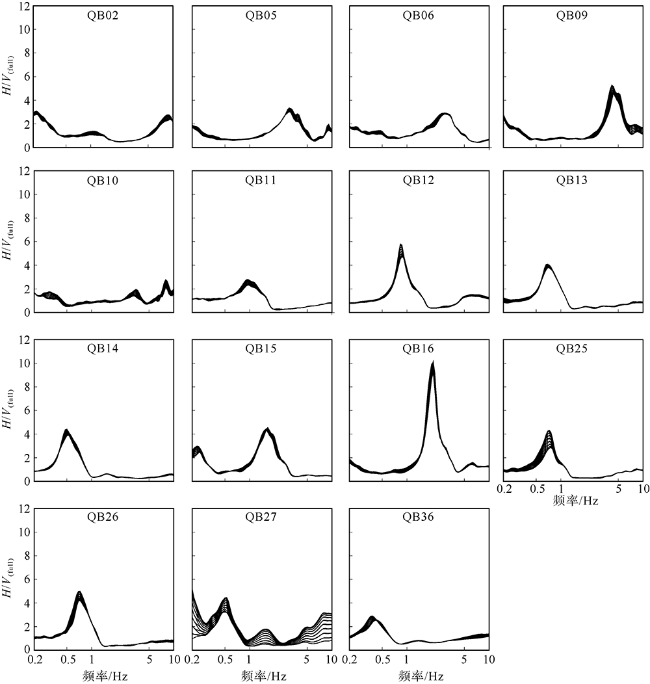
图6 15个清晰峰值型台站H/V(full)的方向依赖性黑色实线代表以10°为间隔旋转水平分量后计算的H/V(full)曲线结果 Fig. 6 Directional dependence of H/V(full) at 15 clear peak type stations. The black curves are H/V(full) curves when rotating horizontal components every 10° from 0 to 180° |
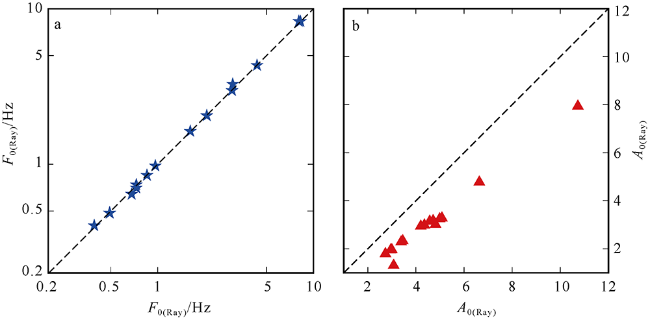
图7 15个清晰型台站的全波场H/V(full)曲线和瑞利面波椭圆率H/V(Ray)曲线对比图a Comparison between H/V(full) and H/V(Ray) of 15 H/V cures with clear peaks. (a) and (b) reveal the differences of F0 and A0, where F0(full) and F0(Ray) represent the peak frequencies of H/V(full) curve and H/V(Ray) curve, respectively, and A0(full) and A0(Ray) represent the peak values of H/V(full) curve and H/V(Ray) curve, respectively |
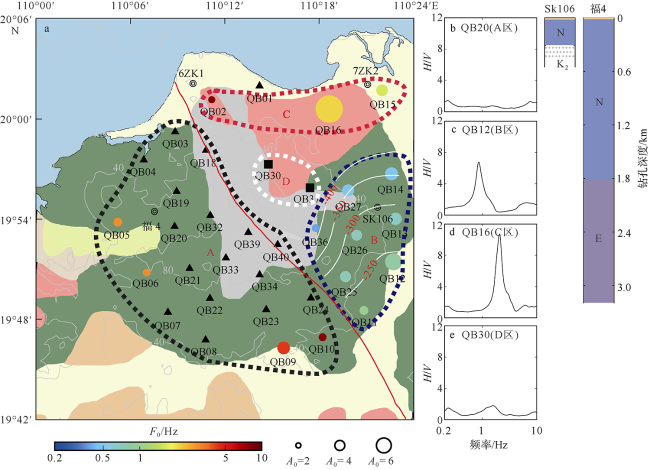
图8 海南琼北火山区H/V曲线亚区划分图a The micro areas of Hainan Qiongbei volcano. H/V curves with clear peak (circles), H/V curves with no peak (black triangles), H/V curves with low peak (black squares). The gray solid line is the topographic contour line, and the white solid line is the contour line of sedimentary basement. In the middle panel, we show the examples of H/V curves in different zones and typical borehole columnar diagrams in the zones given on the right (Zou et al, 1987) |
表1 QB16台站反演的初始模型Tab. 1 The initial inversion model of QB16 station |
| 类型 | 界面 | 厚度/m | Vp/(m·s-1) | Vs/(m·s-1) | 密度/(kg·m-3) |
|---|---|---|---|---|---|
| 层Ⅰ | 松散层 | 0~50 | 200~1600 | 100~800 | 1700~2200 |
| 层Ⅱ | 半空间 | 0 | 1000~4000 | 500~2000 | 2100~2400 |
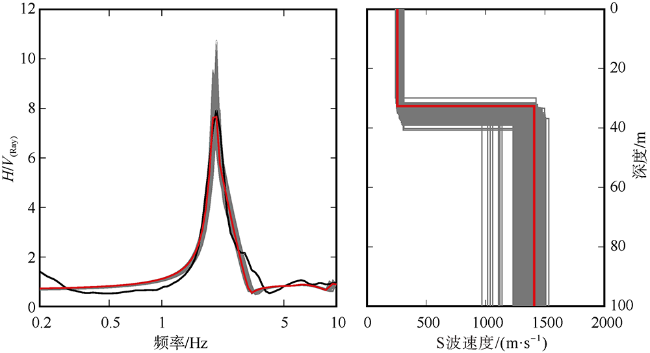
图9 QB16 台站H/V(Ray)反演结果左图黑色实线代表实测数据, 红色实线代表最佳拟合H/V(Ray)曲线, 灰色实线代表不同模型对应的H/V(Ray)曲线; 右图灰色实线代表不同正演模型, 红色实线代表最佳模型 Fig. 9 The inversion of H/V(Ray) by QB16. The black solid line in the left panel represents the measured data, the red solid line represents the best fitting H/V(Ray), and the gray solid line represents the corresponding H/V(Ray) of different models. The grey solid line in the right panel represents different forward models, and the red solid line represents the best model |
| [1] |
樊祺诚, 孙谦, 李霓, 等, 2004. 琼北火山活动分期与全新世岩浆演化[J]. 岩石学报, 20(3): 533-544.
|
| [2] |
胡久常, 郭明瑞, 刘伟, 等, 2009. 海口地区火山活动初步研究[J]. 地震地质, 31(4): 647-654.
|
| [3] |
孙谦, 2003. 琼北第四纪火山活动与岩浆演化[D]. 北京: 中国地震局地质研究所.
|
| [4] |
徐晓枫, 王惠琳, 陈小敏, 2014. 海南岛及邻区地震精确定位及断裂构造分析[J]. 地震研究, 37(2): 216-221.
|
| [5] |
闫成国, 江娃利, 2007. 琼北地区北西方向长流-仙沟断裂带晚第四纪活动及与火山活动关系的讨论[J]. 震灾防御技术, 2(3): 230-242.
|
| [6] |
詹文欢, 刘以宣, 1989. 琼州海峡的断裂构造与区域稳定性分析[J]. 热带海洋, 8(4): 70-77.
|
| [7] |
张仲英, 刘瑞华, 韩中元, 1987. 海南岛沿海的第四纪地层[J]. 热带地理, 7(1): 54-64.
|
| [8] |
邹和平, 黄玉昆, 1987. 琼北新生代坳陷构造特征及其演化[J]. 大地构造与成矿学, 11(1): 33-46.
|
| [9] |
|
| [10] |
|
| [11] |
|
| [12] |
|
| [13] |
|
| [14] |
|
| [15] |
|
| [16] |
|
| [17] |
|
| [18] |
|
| [19] |
|
| [20] |
|
| [21] |
|
| [22] |
|
| [23] |
|
| [24] |
|
| [25] |
|
| [26] |
|
| [27] |
|
| [28] |
|
| [29] |
|
| [30] |
|
| [31] |
|
| [32] |
|
/
| 〈 |
|
〉 |
