
融合MIC与Res-LSTM模型的有效波高预测
|
朱道恒(1992—), 男, 湖北省孝感市人, 博士, 从事海岸带与海洋监测技术研究。email: |
Copy editor: 孙翠慈
收稿日期: 2023-08-04
修回日期: 2023-10-11
网络出版日期: 2023-10-16
基金资助
国家自然科学基金项目(42176167)
广东海洋大学科研启动经费项目(060302112317)
Fusing MIC and Res-LSTM models for significant wave height prediction
Copy editor: SUN Cuici
Received date: 2023-08-04
Revised date: 2023-10-11
Online published: 2023-10-16
Supported by
National Natural Science Foundation of China(42176167)
Scientific Research Startup Foundation of Guangdong Ocean University(060302112317)
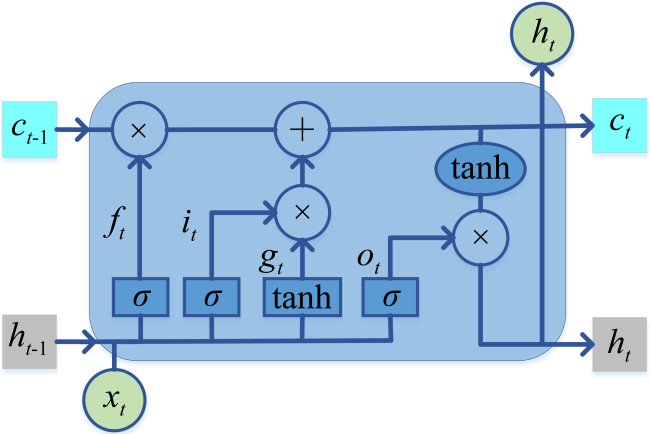
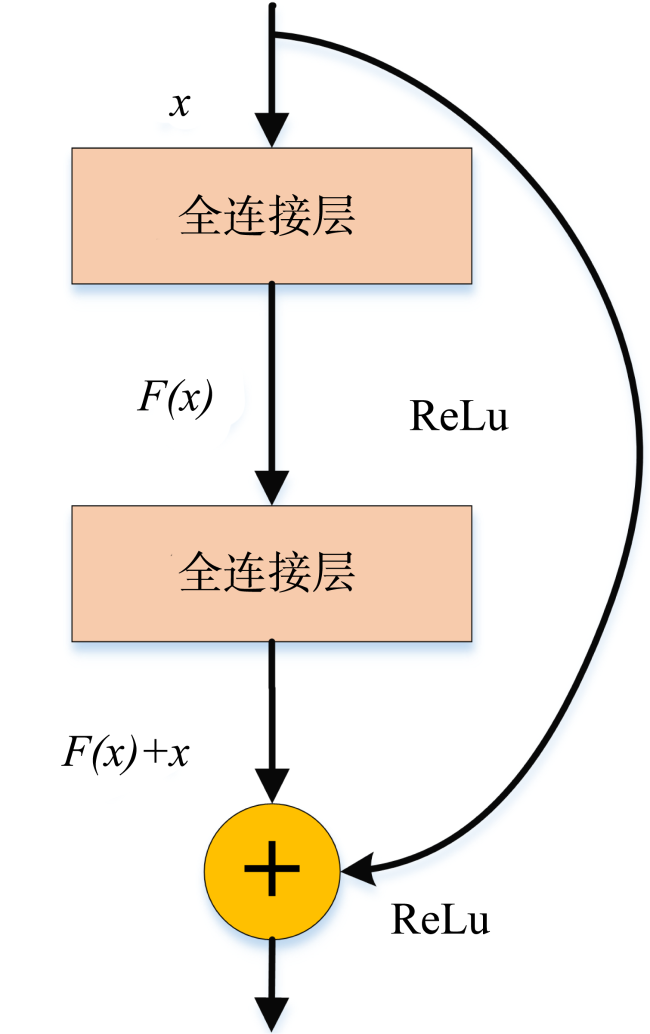
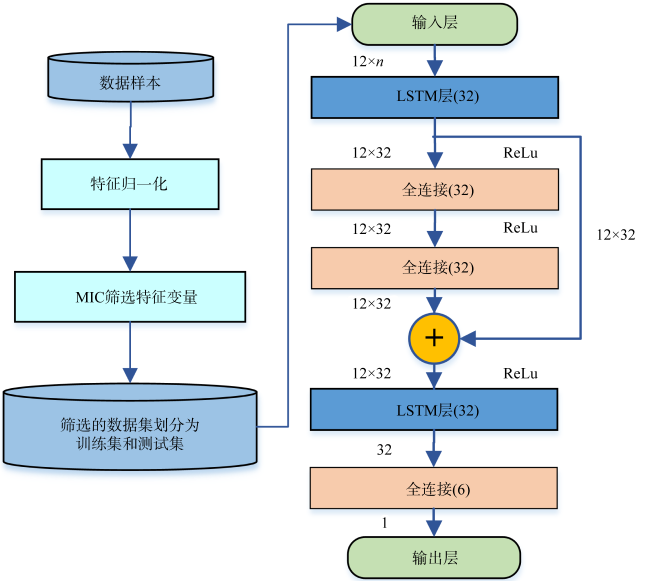
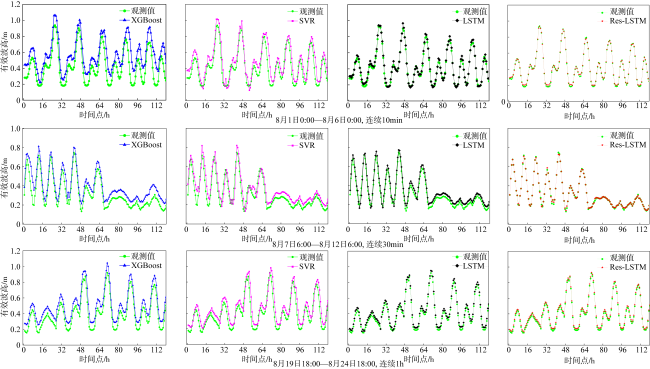
有效波高 (significant wave height, SWH)的预测在海洋运输和海上活动方面发挥着重要作用。基于中国阳江海陵岛近岸实测数据, 提出一种融合最大信息系数 (maximal information coefficient, MIC)、残差网络 (residual network, ResNet)和长短期记忆网络 (long short-term memory networks, LSTM)的预测模型。首先, 采用MIC算法从数据集中筛选出与预测指标相关性高的参数作为模型的输入; 然后将ResNet引入LSTM中, 构建Res-LSTM预测模型; 最后选择相关系数 (r-squared, R2)、均方根差(root mean squared error, RMSE)、平均绝对误差(mean absolute error, MAE)和平均绝对百分比误差(mean absolute percentage error, MAPE)来评价预测结果。同时, 对比了XGBoost (extreme gradient boosting)、SVR(support vector regression)和LSTM网络的预测效果。结果表明, MIC-Res-LSTM模型能够提高短时有效波高预测值的精度。
朱道恒 , 李彦 , 李志强 , 刘润 . 融合MIC与Res-LSTM模型的有效波高预测[J]. 热带海洋学报, 2024 , 43(4) : 76 -85 . DOI: 10.11978/2023113
The prediction of significant wave height (SWH) plays an important role in marine transportation and maritime activities. Based on the near-shore real measurement data of the Hailing Island, Yangjiang, China, a network model integrating the maximum information coefficient algorithm (MIC), residual network (ResNet) and long and short-term memory network (LSTM) is proposed. Firstly, the MIC algorithm was used to screen out the parameters with high correlation with the target predictors from the dataset as the input of the model. Then the residual network was introduced into the LSTM to construct the Res-LSTM prediction model. Finally, the r-squared (R2), root mean square error (RMSE), mean absolute error (MAE) and mean absolute percentage error (MAPE) were selected to evaluate the prediction results. Meanwhile, the prediction results of extreme gradient boosting (XGBoost) network, support vector regression (SVR) network and LSTM network were compared. The results demonstrate that the MIC-Res-LSTM model can improve the accuracy of the short-time significant wave height prediction values.
表1 样本数据信息Tab. 1 Information of sample data |
| 指标 | 大气温度/℃ | 风向/° | 风速/(m·s-1) | 大气压强/kpa | 相对湿度/% | 水温/℃ | 潮高/m | 深水波高/m | 深水波周期/s | 水深/m | 平均波周期/s | 有效波高/m |
|---|---|---|---|---|---|---|---|---|---|---|---|---|
| 平均值 | 30.23 | 200.62 | 1.31 | 99.89 | 76.24 | 28.79 | 1.68 | 0.71 | 4.68 | 0.93 | 4.95 | 0.32 |
| 最大值 | 35.00 | 359.00 | 4.30 | 100.19 | 88.10 | 36.92 | 3.32 | 1.03 | 6.41 | 2.54 | 9.76 | 0.92 |
| 最小值 | 26.00 | 0 | 0 | 99.59 | 35.40 | 25.00 | 0.25 | 0.39 | 3.53 | 0.21 | 2.46 | 0.08 |
| 标准偏差 | 1.98 | 93.99 | 0.84 | 1.22 | 7.17 | 1.98 | 66.87 | 0.15 | 0.63 | 0.53 | 0.95 | 0.16 |
| 变异系数/% | 6.54 | 46.85 | 64.31 | 0.12 | 9.41 | 6.90 | 39.80 | 20.73 | 13.43 | 57.26 | 19.19 | 51.13 |
表2 训练参数设置Tab. 2 Configuration of training parameters |
| 参数 | batch_size | learning_rate | epoch | beta1 | beta2 | epsilon | timesteps | dropout |
|---|---|---|---|---|---|---|---|---|
| 自测数据集实验 | 72 | 0.0025 | 100 | 0.9 | 0.999 | 1×10⁻⁸ | 12 | 0.001 |
| 公开数据集实验 | 128 | 0.001 | 150 | 0.9 | 0.999 | 1×10⁻⁸ | 12 | 0.001 |
表3 以不同相关系数计算各指标特征与有效波高的相关性Tab. 3 Correlation between significant wave height and each indicator based on different correlation coefficients |
| 特征指标 | MIC | Pearson | Spearman | Kendall |
|---|---|---|---|---|
| 大气温度 | 0.176 | 0.026 | 0.001 | 0.002 |
| 风向 | 0.154 | 0.003 | 0.015 | 0.010 |
| 风速 | 0.177 | 0.010 | 0.047 | 0.031 |
| 大气压强 | 0.202 | 0.003 | 0.108 | 0.072 |
| 相对湿度 | 0.173 | 0.019 | 0.031 | 0.002 |
| 水温 | 0.221 | 0.361 | 0.477 | 0.324 |
| 潮高 | 0.487 | 0.647 | 0.677 | 0.506 |
| 深水波高 | 0.379 | 0.286 | 0.293 | 0.199 |
| 深水波周期 | 0.361 | 0.432 | 0.401 | 0.349 |
| 平均波周期 | 0.473 | 0.298 | 0.312 | 0.217 |
| 水深 | 0.659 | 0.672 | 0.521 | 0.497 |
表4 短期预测的性能比较Tab. 4 Comparison of short-term forecast results |
| 模型 | 时间跨度 | R2 | RMSE | MAE | MAPE/% |
|---|---|---|---|---|---|
| XGboost | 10min | 0.7761 | 0.1084 | 0.0903 | 38.47 |
| SVR | 0.8256 | 0.1152 | 0.1017 | 45.59 | |
| LSTM | 0.9653 | 0.0373 | 0.0293 | 13.35 | |
| Res-LSTM | 0.9814 | 0.0194 | 0.0152 | 6.09 | |
| XGboost | 30min | 0.7345 | 0.1473 | 0.1049 | 32.16 |
| SVR | 0.8136 | 0.1137 | 0.0925 | 37.84 | |
| LSTM | 0.9567 | 0.0812 | 0.0675 | 14.60 | |
| Res-LSTM | 0.9641 | 0.0385 | 0.0141 | 6.79 | |
| XGboost | 1h | 0.7198 | 0.1266 | 0.1044 | 43.54 |
| SVR | 0.7761 | 0.0701 | 0.0572 | 23.72 | |
| LSTM | 0.9138 | 0.0575 | 0.0524 | 23.00 | |
| Res-LSTM | 0.9423 | 0.0516 | 0.0416 | 17.70 |
表5 各变量与有效波高的相关性计算结果Tab. 5 Correlation results of each variable and significant wave height |
| 变量名 | MIC | Pearson | Spearman | Kendall |
|---|---|---|---|---|
| 月份 | 0.1560 | 0.1011 | 0.0079 | 0.0033 |
| 小时 | 0.0744 | 0.0219 | 0.0690 | 0.0471 |
| 分钟 | 0.0663 | 0.0059 | 0.0071 | 0.0047 |
| 风向 | 0 | 0 | 0 | 0 |
| 平均风速 | 0.1847 | 0.0578 | 0.0426 | 0.0319 |
| 峰值风速 | 0.4814 | 0.5973 | 0.6078 | 0.4462 |
| 主波周期 | 0.3148 | 0.6088 | 0.6247 | 0.4572 |
| 平均波周期 | 0.1801 | 0.0980 | 0.0248 | 0.0088 |
| 主波方向 | 0.2276 | 0.5017 | 0.3329 | 0.2420 |
| 海平面压力 | 0.1477 | 0.1555 | 0.0900 | 0.0566 |
| 空气温度 | 0.0975 | 0.2818 | 0.1524 | 0.0989 |
| 海平面温度 | 0.1605 | 0.2554 | 0.3597 | 0.2030 |
| 露点温度 | 0.1864 | 0.2079 | 0.2978 | 0.2030 |
| 浮标能见度 | 0.1617 | 0.0353 | 0.3190 | 0.2146 |
表6 不同相关性阈值条件下的有效波高预测性能Tab. 6 Significant wave height prediction performance under different correlation thresholds |
| 模型 | 相关性阈值 | R2 | RMSE | MAE | MAPE/% |
|---|---|---|---|---|---|
| XGBoost | MIC=0 | 0.8271 | 0.4635 | 0.2711 | 22.22 |
| MIC=0.2 | 0.8483 | 0.5129 | 0.2889 | 21.15 | |
| MIC=0.3 | 0.8596 | 0.5265 | 0.3323 | 20.39 | |
| SVR | MIC=0 | 0.7686 | 0.5069 | 0.3854 | 40.89 |
| MIC=0.2 | 0.8108 | 0.5601 | 0.3555 | 32.84 | |
| MIC=0.3 | 0.8837 | 0.6092 | 0.3507 | 25.56 | |
| LSTM | MIC=0 | 0.9819 | 0.1733 | 0.1312 | 14.24 |
| MIC=0.2 | 0.9865 | 0.1346 | 0.0933 | 9.44 | |
| MIC=0.3 | 0.9879 | 0.1163 | 0.0771 | 7.31 | |
| Res-LSTM | MIC=0 | 0.9817 | 0.1349 | 0.0945 | 10.60 |
| MIC=0.2 | 0.9916 | 0.1089 | 0.0652 | 8.50 | |
| MIC=0.3 | 0.9932 | 0.0955 | 0.0644 | 6.48 |
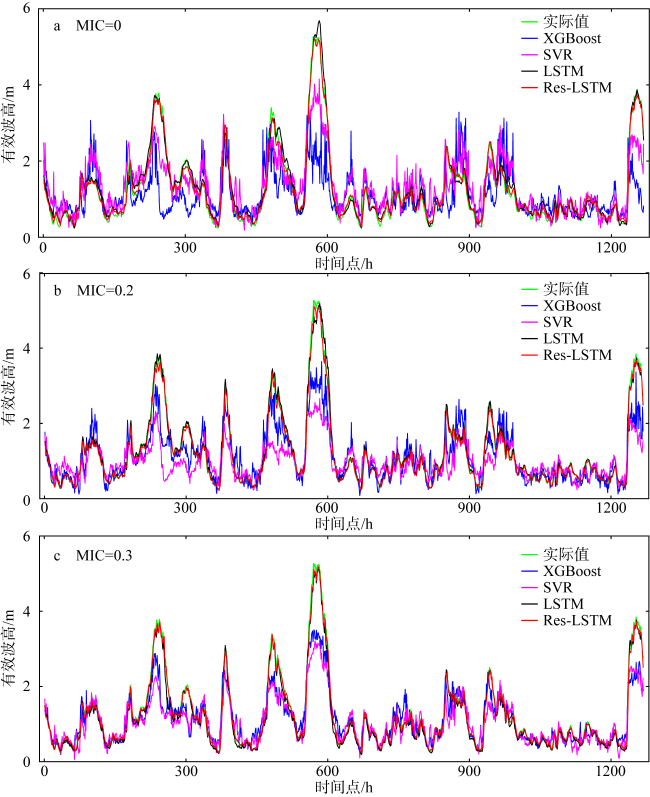
图5 不同模型对2019年浮标44013数据集的有效波高预测结果a. 筛选变量前; b、c: 分别是相关性阈值选为0.2和0.3时的预测结果 Fig. 5 Prediction results of various models before variable screening of buoy 44013 in 2019. (a) Before variables are screened; (b) and (c) are the predicted results when the correlation thresholds are selected as 0.2 and 0.3 |
| [1] |
周水华, 洪晓, 梁昌霞, 等, 2020. 基于人工神经网络的台风浪高快速计算方法[J]. 热带海洋学报, 39(4): 25-33.
|
| [2] |
朱道恒, 李志强, 2021. 最大互信息系数的并行计算方法研究[J]. 科学技术与工程, 21(34): 14625-14633.
|
| [3] |
|
| [4] |
|
| [5] |
|
| [6] |
|
| [7] |
|
| [8] |
|
| [9] |
|
| [10] |
|
| [11] |
|
| [12] |
|
| [13] |
|
| [14] |
|
| [15] |
|
| [16] |
|
| [17] |
|
| [18] |
|
| [19] |
|
| [20] |
|
| [21] |
|
| [22] |
|
| [23] |
|
| [24] |
|
| [25] |
|
| [26] |
|
| [27] |
|
| [28] |
|
| [29] |
|
| [30] |
|
/
| 〈 |
|
〉 |
