
南海西北部连续台风激发的近惯性内波观测研究
两位匿名审稿专家和编辑对稿件提出的修改意见。
|
刘杰(1997—), 男, 安徽省阜阳市人, 硕士研究生, 从事海洋内波研究。email: liujie5514@163.com |
Copy editor: 孙翠慈
收稿日期: 2024-01-30
修回日期: 2024-02-22
网络出版日期: 2024-05-09
基金资助
国家重点研发计划项目(2023YFC3008003)
国家重点研发计划项目(2023YFC3008001)
国家自然科学基金项目(42149907)
国家自然科学基金项目(42349907)
国家自然科学基金项目(42349584)
中国科学院南海海洋研究所自主部署项目(SCSIO202201)
中国科学院南海海洋研究所自主部署项目(SCSIO202204)
中国科学院南海海洋研究所自主部署项目(SCSIO202209)
中国科学院南海海洋研究所自主部署项目(SCSIO2023QY02)
Observations of near-inertial waves generated by three successive typhoons in the northwestern South China Sea
Copy editor: SUN Cuici
Received date: 2024-01-30
Revised date: 2024-02-22
Online published: 2024-05-09
Supported by
National Key Research and Development Program of China(2023YFC3008003)
National Key Research and Development Program of China(2023YFC3008001)
National Natural Science Foundation of China(42149907)
National Natural Science Foundation of China(42349907)
National Natural Science Foundation of China(42349584)
Development Fund of South China Sea Institute of Oceanology of the Chinese Academy of Sciences(SCSIO202201)
Development Fund of South China Sea Institute of Oceanology of the Chinese Academy of Sciences(SCSIO202204)
Development Fund of South China Sea Institute of Oceanology of the Chinese Academy of Sciences(SCSIO202209)
Development Fund of South China Sea Institute of Oceanology of the Chinese Academy of Sciences(SCSIO2023QY02)
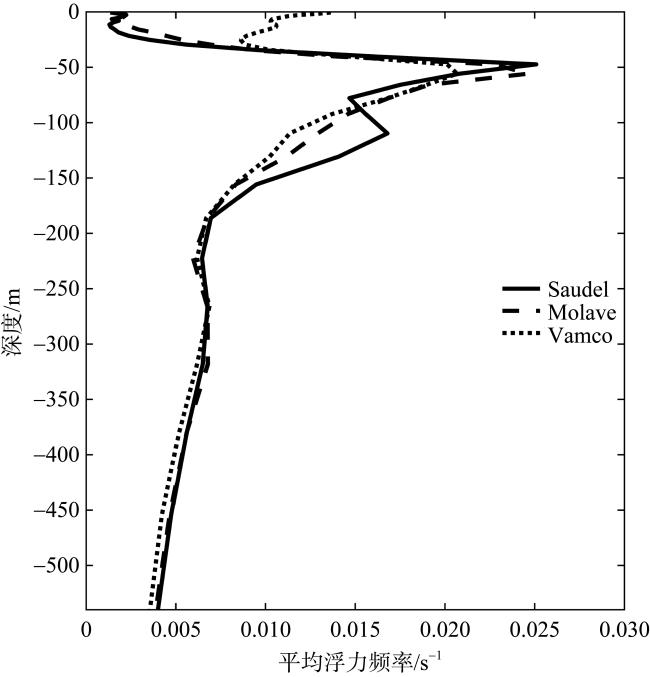
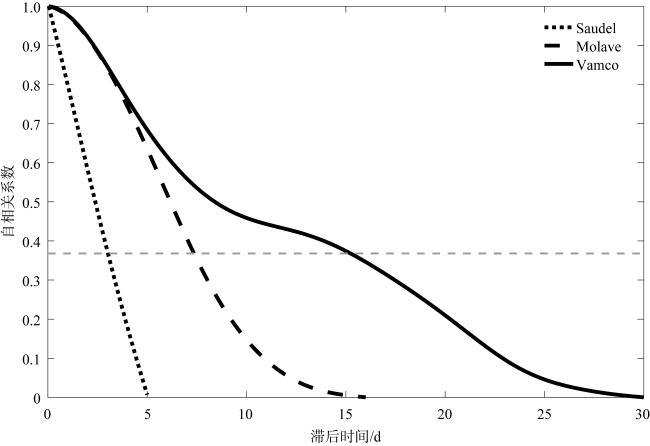
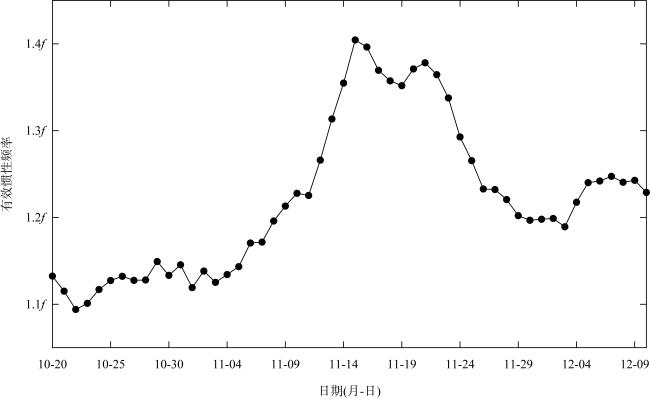
文章基于2020年10—11月南海西沙潜标观测资料, 详细研究了三个连续台风激发近惯性内波(near-inertial waves, NIWs)的特征, 分析了不同台风引起NIWs的特征参数、衰减时间尺度、垂向结构, 以及背景涡度和流场对NIWs频率的调制作用。观测期间, 台风Saudel、Molave和Vamco激发NIWs垂向波长分别为109m、133m和117m, 垂向群速度分别为29m·d-1、26m·d-1和18m·d-1, 衰减时间尺度分别为3d、7d和15d。分析表明, 层结效应对垂向群速度变化影响显著, 同时Vamco事件中的长时间衰减尺度应为远场传来的EOF(empirical orthogonal function)第2模态NIWs所致。动力模态分解(dynamical mode decomposition, DMD)和EOF分析整体结果一致, 第1模态贡献均显著占优, 且海洋上层NIWs垂向分布结构相近。 在100m以浅、100~150m和150~350m层内, 近惯性动能(near-inertial kinetic energy, NIKE)分别主要分布于DMD的第1、第3和第2模态中。观测的NIWs频率均表现出蓝移特征, 台风Saudel与Molave事件中的蓝移是背景流场的多普勒频移效应和背景涡度的共同作用, Vamco期间气旋式涡旋带来的显著正背景涡度则是蓝移的主要原因。研究结果对深入理解强风致NIWs的结构、传播、衰减与能量分布等特征及其产生机理有裨益, 并且为NIWs在数值模式中的模拟和合理刻画提供了参考。
刘杰 , 闫桐 , 经志友 . 南海西北部连续台风激发的近惯性内波观测研究[J]. 热带海洋学报, 2025 , 44(1) : 66 -81 . DOI: 10.11978/2024034
Based on mooring data deployed west of the Xisha Islands from October to November 2020, we investigated the characteristics of near-inertial waves (NIWs) triggered by three consecutive typhoons in detail, including the decay time scales and vertical structures of the NIWs, as well as the modulation of the background vorticity and current fields on the NIWs, etc. The vertical wavelengths of NIWs induced by Typhoon Saudel, Molave and Vamco are 109 m, 133 m and 117 m, respectively, and the vertical group speeds are 29 m·d-1, 26 m·d-1 and 18 m·d-1, respectively. The decay time scales for these internal waves are 3 d, 7 d and 15 d, respectively. It reveals that ocean stratification significantly impacts the vertical group speed of NIWs. The longest decay time in the Vamco case is attributed to the second EOF (empirical orthogonal function) mode of NIW propagated from far field. The results of the dynamical mode decomposition (DMD) and EOF are consistent with each other. Both show that the first modes contribute the most to near-inertial kinetic energy (NIKE), and the distributions of NIKE in different modes obtained from DMD and EOF are comparable. For example, the NIKE is mainly distributed in the first, third and second DMD modes at depths of < 100 m, 100~150 m and 150~350 m. The observed frequencies of the NIWs are all blue-shifted, and the blueshifts in Typhoon Saudel and Molave are due to the combination of the background current and vorticity, while the positive background vorticity due to the cyclonic eddy during the Vamco is the main reason for the observed blueshift. Our results are useful for a deeper understanding of the characteristics, propagation, dissipation and energy distribution of strong wind-induced NIWs and their mechanisms, and they also provide a good reference for numerical simulations.
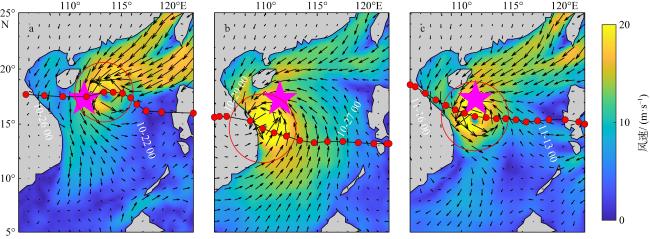
图1 台风Saudel(a)、Molave(b)和Vamco(c)的路径、过境潜标时的海面风场分布以及进入和离开研究区域的时间洋红色五角星为潜标所在位置, 红点黑线为台风路径, 红圈为台风七级风圈, 黑色箭头为风速矢量, 填色为风速大小。该图基于国家测绘地理信息局标准地图服务网站下载的审图号为琼S(2021)116号的标准地图制作 Fig. 1 Paths of Typhoons Saudel (a), Molave (b), and Vamco (c) and the distribution of the sea surface wind when three typhoons passed over the mooring, respectively. The magenta pentagram is the location of the mooring, the black line with red dots is the path of the typhoon, the red circle is the typhoon's category 7 wind circle, the black arrows are the wind speed vector, and the filled colors are the wind magnitude |
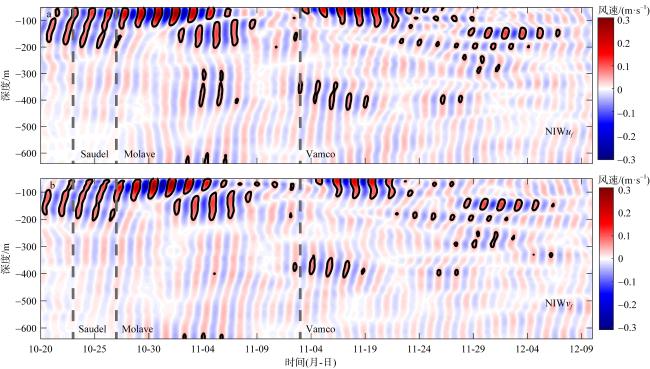
图2 纬向(a)和经向(b)近惯性流速垂直剖面时间演变黑色轮廓线为0.05m·s−1等值线, 黑色虚线为潜标第一次进入台风七级风圈的时刻 Fig. 2 Time evolution of vertical profiles of near-inertial current along the zonal (a) and meridional (b) directions. The black contour lines mark velocity of 0.05 m·s−1, and the black dashed lines denote the moment when the typhoon's Category 7 wind circle first impacted the mooring |
表1 台风Saudel、Molave和Vamco 的NIWs特征参数Tab. 1 Characteristics of NIWs induced by Typhoons Saudel, Molave, and Vamco |
| 台风 | feff | Cpz/(m·h-1) | Cgz/(m·d-1) | Cgh/(m·s-1) | λz/m | Te/d |
|---|---|---|---|---|---|---|
| Saudel | 1.12f | 2.7 | 29 | 0.074 | 109 | 3 |
| Molave | 1.13f | 3.3 | 26 | 0.062 | 133 | 7 |
| Vamco | 1.35f | 2.9 | 18 | 0.045 | 117 | 15 |
注: feff, Cpz, Cgz, Cgh, λz, Te分别表示有效惯性频率、垂向相速度、垂向群速度、水平群速度、垂向波长、e折时间 |
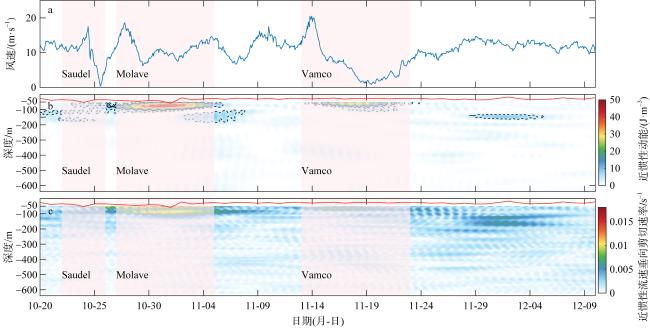
图4 a. 潜标站位海面10米风速时间序列; b. NIKE 的时间−深度变化, 红线代表混合层深度, 黑色实线为10J·m-3能量等值线, 黑色虚线是4J·m-3能量等值线; c. 近惯性流速垂向剪切速率阴影代表台风Saudel(10月22日至10月26日)、Molave(10月27日至11月5日)和Vamvo (11月13日至11月23日)影响时间范围 Fig. 4 (a) Time series of 10 m wind speeds above the sea surface at the mooring station; (b) Time depth variations of NIKE, with the red line denoting the mixed layer depth, the black solid line representing the 10 J·m-3 NIKE, and the black dashed line representing the 4 J·m-3; (c) Vertical shear rate of near-inertial current. The shading represents the periods when Typhoons Saudel (22 October to 26 October), Molave (27 October to 05 November), and Vamvo (13 November to 23 November) passed over the mooring |
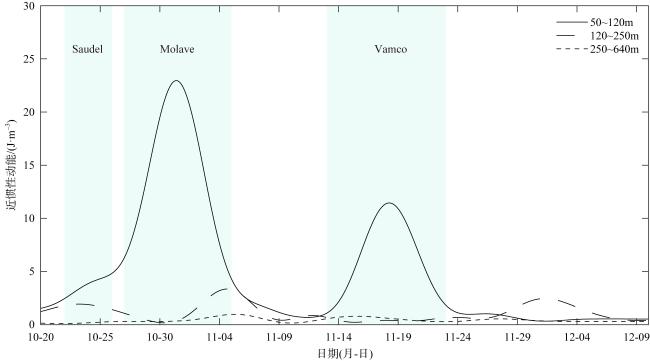
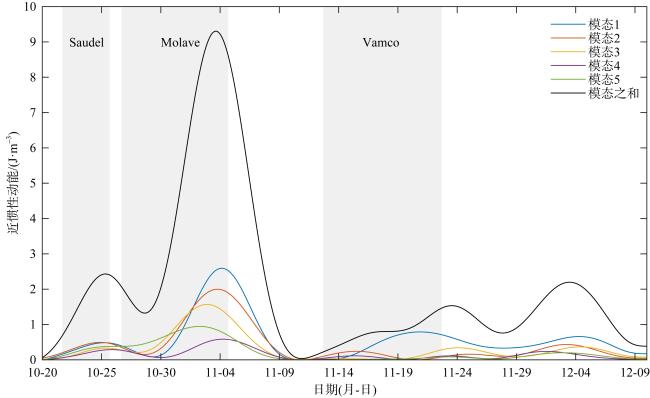
图5 4d低通滤波的深度平均NIKE时间序列阴影代表台风Saudel(10月22日至10月26日)、Molave(10月27日至11月5日)和Vamvo (11月13日至11月23日)影响时间范围 Fig. 5 Time series of depth-averaged NIKE after 4-day low-pass filtering. The shading represents the periods when Typhoons Saudel (22 October to 26 October), Molave (27 October to 05 November), and Vamvo (13 November to 23 November) passed over the mooring |
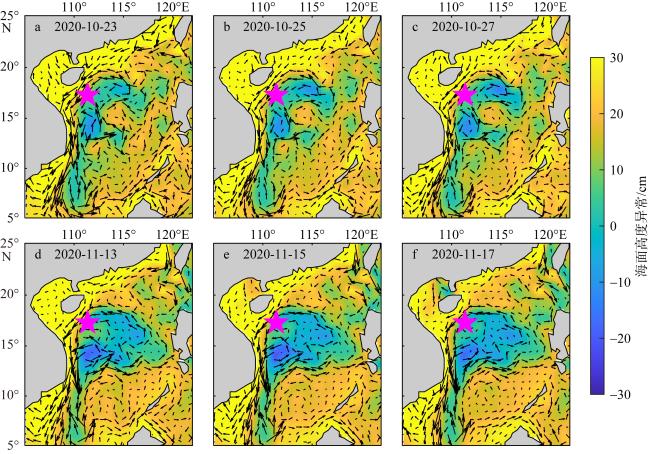
图7 2020年10月23日至10月27日AVISO再分析资料海面高度异常场(sea level anomaly, SLA)和海表地转流异常(a、b、c), 洋红色五角星代表潜标位置; 11月13日至11月17日海表高度异常场和海表地转流异常(d、e、f)该图基于国家测绘地理信息局标准地图服务网站下载的审图号为琼S(2021)120号的标准地图制作 Fig. 7 Sea level anomaly (a, b, c) and geostrophic current map (d, e, f) observed by satellite altimeters. The magenta pentagram represents the mooring station |
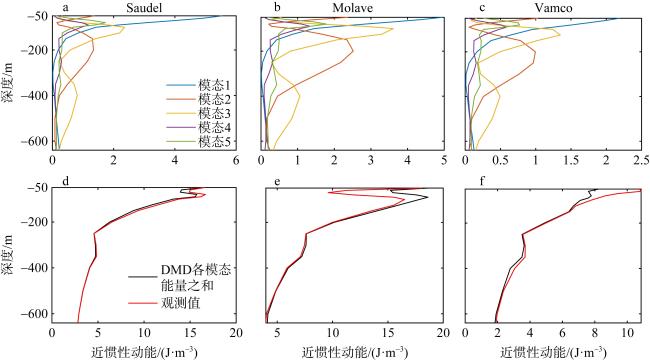
图9 a、b和c分别为三个台风事件DMD前5个斜压模态的时间平均NIKE垂向分布; d、e和f分别为三个台风期间总NIKE垂向分布红线为观测的NIKE, 黑线为DMD各模态能量之和 Fig. 9 (a), (b) and (c) are the time-averaged vertical distributions of NIKE for the first five baroclinic modes by DMD in the three typhoon events, respectively; (d), (e) and (f) are vertical distribution of NIKE, black lines represent the sum of energy of the DMD modes, and the red lines represent the observed total NIKE |
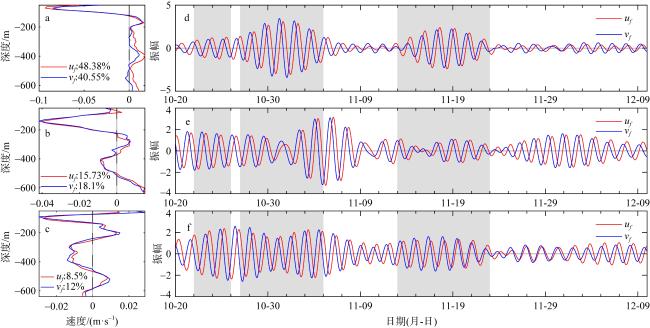
图11 a. 近惯性流EOF分解第1模态的垂直剖面和对应时间序列; b、c 分别为EOF第2、第3模态红线和蓝线分别代表纬向流和经向流; 阴影代表台风Saudel (10月22日至10月26日)、Molave (10月27日至11月5日)和Vamvo (11月13日至11月23日)影响时间范围 Fig. 11 Vertical profiles and corresponding time series of the first EOF mode of the near-inertial currents (a), (b) and (c) are for the second and third EOF modes, respectively. The red and blue lines represent the zonal and meridional current, respectively. The shading represents the periods when Typhoons Saudel (22 October to 26 October), Molave (27 October to 05 November), and Vamvo (13 November to 23 November) passed over the mooring |
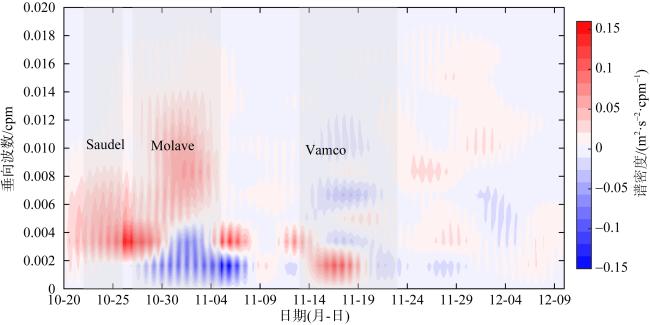
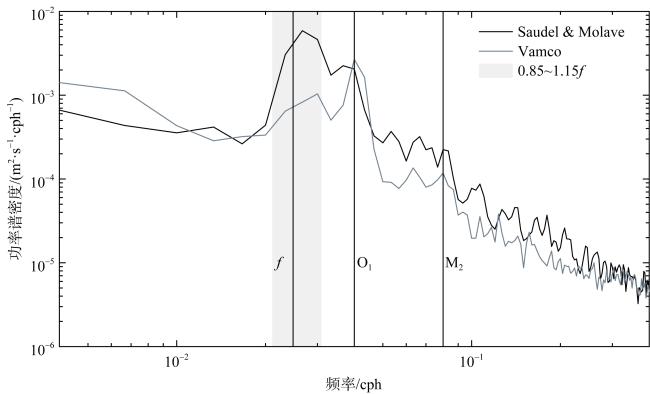
图12 台风Saudel & Molave(粗黑线)和台风Vamco(粗灰线)个例中50~150m深度平均的流速功率谱图黑色竖线分别为局地惯性频率f、全日潮O1、半日潮M2, 阴影表示近惯性频带范围 Fig. 12 The power spectrum of average velocity at depths ranging from 50 to 150 m for the typhoons Saudel&Molave (thick black line) and typhoon Vamco (thick gray line). The black vertical lines represent the local inertial frequency f, the diurnal tidal frequency O1, and the semidiurnal tidal frequency M2, respectively. The shaded area represents the near-inertial frequency band |
| [1] |
高大鲁, 王新怡, 李秉天, 等, 2016. 南海北部海域对台风尼格的响应特征分析[J]. 中国海洋大学学报(自然科学版), 46(6): 8-13,
|
| [2] |
黄妍丹, 许洁馨, 刘军亮, 等, 2018. 基于实测资料的南海北部台风“海鸥”致近惯性振荡研究[J]. 热带海洋学报, 37(6): 16-25.
|
| [3] |
江森汇, 吴泽文, 舒勰俊, 2019. 基于观测的南海西沙海域深层近惯性振荡特征分析[J]. 海洋通报, 38(5): 543-552.
|
| [4] |
马永贵, 张书文, 齐义泉, 等, 2019. 南海西北部上层海洋对连续台风的近惯性响应[J]. 中国科学: 地球科学, 49(4): 731-740.
|
| [5] |
于璐莎, 翟荣伟, 鲁远征, 等, 2020. 南海北部台风和中尺度暖涡对近惯性振荡的影响[J]. 海洋学报, 42(1): 1-11.
|
| [6] |
|
| [7] |
|
| [8] |
|
| [9] |
|
| [10] |
|
| [11] |
|
| [12] |
|
| [13] |
|
| [14] |
DE BOYER MONTÉGUT C,
|
| [15] |
|
| [16] |
|
| [17] |
|
| [18] |
|
| [19] |
|
| [20] |
|
| [21] |
|
| [22] |
|
| [23] |
|
| [24] |
|
| [25] |
|
| [26] |
|
| [27] |
|
| [28] |
|
| [29] |
|
| [30] |
|
| [31] |
|
| [32] |
|
| [33] |
|
| [34] |
|
| [35] |
|
| [36] |
|
| [37] |
|
| [38] |
|
| [39] |
|
| [40] |
|
| [41] |
|
| [42] |
|
| [43] |
|
| [44] |
|
| [45] |
|
| [46] |
|
| [47] |
|
| [48] |
|
| [49] |
|
| [50] |
|
| [51] |
|
| [52] |
|
| [53] |
|
| [54] |
|
| [55] |
|
| [56] |
|
| [57] |
|
| [58] |
|
| [59] |
|
| [60] |
|
| [61] |
|
| [62] |
|
/
| 〈 |
|
〉 |
