
基于短时调和分析的广东惠州双月湾潟湖体系潮汐动力特征分析
|
王雅君(1997—), 男, 江苏省常州市人, 主要从事河口海岸动力学研究。email: YajunWang1997@163.com |
Copy editor: 孙翠慈
收稿日期: 2024-03-01
修回日期: 2024-03-26
网络出版日期: 2024-05-15
基金资助
国家自然科学基金项目(52279080)
广东省基础与应用基础研究基金项目区域联合基金-青年项目(2020A1515110367)
Analysis of tidal hydrodynamics characteristics of the Shuangyue Bay Lagoon system in Huizhou, Guangdong based on modified harmonic analysis model using the credo of smoothness
Copy editor: SUN Cuici
Received date: 2024-03-01
Revised date: 2024-03-26
Online published: 2024-05-15
Supported by
National Natural Science Foundation of China(52279080)
Guangdong Provincial Basic and Applied Basic Research Fund Project Regional Joint Fund -Youth Project(2020A1515110367)
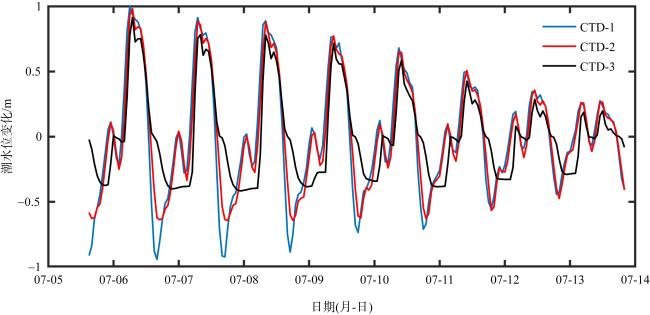
潟湖体系的潮汐动力对其地貌演变、生态环境保护与海岸带资源的可持续开发利用等具有重要影响。以广东惠州双月湾潟湖为研究靶区, 基于2020—2023年4次潮位观测资料, 采用基于光滑导纳原理的短时调和分析(modified harmonic analysis model on the basis of the credo of smoothness, MHACS)模型和数理统计方法初步探讨该潟湖体系潮波传播和变化过程。结果表明,双月湾潟湖体系平均潮差为0.52~0.69m, 潮波从口门传播至潟湖上段, 其能量明显减小, 特别是上游区域的潮波衰减率为近口门段20倍, 潮波传播速度亦降低至近口门段的12%。在潟湖中, 半日潮M2、全日潮K1和浅水潮M4占据主导, 其振幅分别为23.06cm、30.4cm和7.74cm。其中, 全日潮和半日潮的振幅月变化较为稳定, 而浅水分潮的季节波动更加明显, 尤其是向上游传播时, 分潮的振幅和迟角季节性变化更为显著。潮波通过口门传入双月湾潟湖, 受地形辐聚与底床摩擦效应影响, 不同河段的潮波传播速度差异显著, 尤其是半日潮在口门区的传播速度普遍高于全日潮。各分潮在潟湖内的振幅衰减明显, 特别是S2、M4和MS4分潮的振幅梯度最为显著(4×10⁻⁶m-1)。
关键词: 基于光滑导纳原理的短时调和分析(MHACS); 潮波传播; T-tide; 潮波衰减; 传播速度
王雅君 , 张司一 , 欧素英 , 蔡华阳 , 朱馨雨 , 朱磊 . 基于短时调和分析的广东惠州双月湾潟湖体系潮汐动力特征分析[J]. 热带海洋学报, 2025 , 44(1) : 93 -107 . DOI: 10.11978/2024048
The tidal dynamics of lagoon systems exert profound influences on their geomorphic evolution, ecological conservation, and sustainable development of coastal resources. This study focuses on the Shuangyue Bay Lagoon in Huizhou, Guangdong Province. Utilizing four sets of tidal level observations from 2020 to 2023, we employed a modified harmonic analysis model based on the principle of smoothness (MHACS) alongside statistical methods to preliminarily investigate the propagation and variation processes of tidal waves within the lagoon system. The results reveal that the average tidal range in the Shuangyue Bay lagoon system spans from 0.52 to 0.69 m. As tidal waves propagate from the mouth to the upper reaches of the lagoon, their energy diminishes significantly, with an attenuation rate in the upstream region approximately 20 times greater than that near the mouth. Additionally, the propagation speed of tidal waves decreases to approximately 12% of its value near the mouth. Dominant tidal constituents within the lagoon include the semi-diurnal tide M2, diurnal tide K1, and shallow-water tide M4, with amplitudes of 23.06 cm, 30.4 cm, and 7.74 cm, respectively. While the amplitudes of diurnal and semi-diurnal tides exhibit relatively stable monthly fluctuations, shallow-water tides display more pronounced seasonal variations, particularly evident when propagating upstream, where the amplitude and phase lag of tidal components undergo significant seasonal changes. Tidal waves enter the Shuangyue Bay Lagoon through its mouth, encountering influences from terrain convergence and bottom friction effects. The propagation speed of tidal waves varies significantly across different river sections, with the speed of semi-diurnal tides generally higher in the mouth area compared to diurnal tides. Moreover, the amplitude attenuation of each tidal component within the lagoon is substantial, particularly notable for the amplitude gradient of S2, M4, and MS4 tidal constituents, which reaches up to 4×10⁻⁶ m-1.
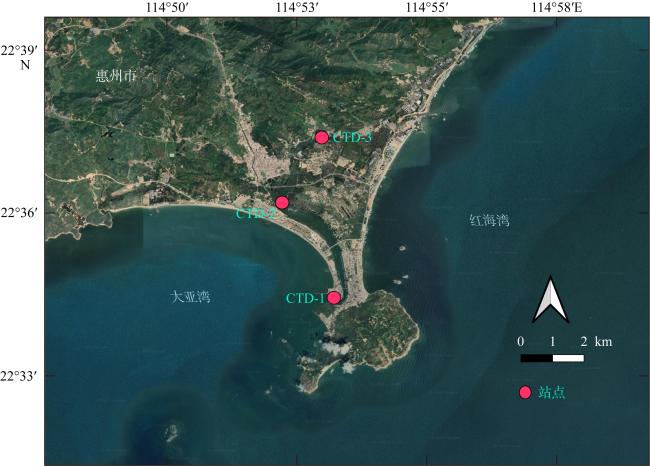
表1 广东惠州双月湾澙湖CTD-Diver观测站布设情况Tab.1 Layout of CTD-Diver observation station in the Shuangyue Bay Lagoon, Huizhou, Guangdong province |
| 编号 | 位置 | 经度 | 纬度 | 测量时间 | 时间长度/h |
|---|---|---|---|---|---|
| CTD-1 | 潟湖口门 | 114°53'24" E | 22°34'30"N | 2020-07-03, 16:00—2020-08-19, 16:00 | 1129 |
| 2022-08-22, 16:00—2022-11-09, 15:00 | 1896 | ||||
| 2022-11-10, 10:00—2023-04-25, 6:00 | 3981 | ||||
| 2023-06-19, 10:00—2023-12-02, 8:00 | 3983 | ||||
| CTD-2 | 潟湖中段 | 114°52'37"E | 22°36'29"N | 2020-07-04, 9:00—2020-08-19, 8:00 | 1104 |
| 2022-08-22, 16:00—2022-11-09, 15:00 | 1896 | ||||
| 2022-11-10, 10:00—2023-04-25, 6:00 | 3981 | ||||
| 2023-06-19, 10:00—2023-12-02, 8:00 | 3983 | ||||
| CTD-3 | 潟湖上段 | 114°53'31"E | 22°37'26"N | 2020-07-03, 16:00—2020-8-19, 16:00 | 1129 |
表2 观测期间双月湾潟湖沿程三站点潮汐特征值统计Tab. 2 Statistics of tidal characteristic parameters at three stations along the Shuangyue Bay Lagoon during the observed period |
| 特征值 | CTD-1 | CTD-2 | CTD-3 | |
|---|---|---|---|---|
| 平均涨潮潮差/m | 0.72 | 0.65 | 0.54 | |
| 平均落潮潮差/m | 0.67 | 0.63 | 0.49 | |
| 平均潮差/m | 0.69 | 0.64 | 0.52 | |
| 最大涨潮潮差/m | 1.17 | 1.09 | 1.01 | |
| 最大落潮潮差/m | 1.87 | 1.57 | 1.19 | |
| 平均潮波振幅/m | 0.34 | 0.31 | 0.25 | |
| 特征值 | 潟湖近口段 | 潟湖中上段 | ||
| 衰减率绝对值/(10-4·m-1) | 0.14 | 2.84 | ||
| 高潮位传播速度/(m·s-1) | 5.25 | 1.91 | ||
| 低潮位传播速度/(m·s-1) | 3.13 | 0.62 | ||
| 平均传播速度/(m·s-1) | 3.06 | 0.34 | ||
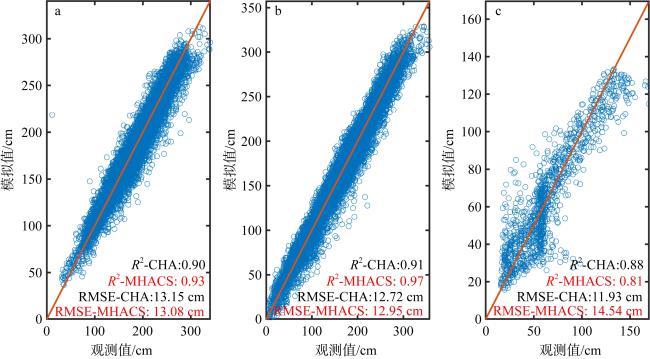
图3 双月湾3站点2020年观测期间MHACS模型和CHA模型模拟水位与实测水位对比a、b、c分别为CTD-1、CTD-2和CTD-3站点 Fig. 3 Comparison between simulated water levels and measured water levels using MHACS and CHA models during the observed period in 2020 at three stations along the Shuangyue Bay Lagoon. Panels (a), (b), and (c) correspond to CTD-1, CTD-2, and CTD-3 stations, respectively |
表3 2020年观测期间双月湾潟湖沿程三站点潮汐调和常数2种模型对比Tab. 3 Comparison of tidal harmonic constants at three stations along the Shuangyue Bay Lagoon during the observed period in 2020 |
| 潮汐 | CTD-1 | CTD-2 | CTD-3 | ||||||||||
|---|---|---|---|---|---|---|---|---|---|---|---|---|---|
| 振幅η/cm | 迟角 | 振幅η/cm | 迟角 | 振幅η/cm | 迟角 | ||||||||
| MHACS | CHA | MHACS | CHA | MHACS | MHACS | CHA | CHA | MHACS | CHA | MHACS | CHA | ||
| M2 | 29.77 | 30.18 | 239.75° | 240.90° | 27.01 | 26.83 | 252.73° | 253.02° | 11.55 | 12.72 | 580.83° | 428.05° | |
| S2 | 10.48 | 9.14 | 265.09° | 277.41° | 8.15 | 6.81 | 283.12° | 292.45° | 2.32 | 2.70 | 519.24° | 545.93° | |
| N2 | 5.50 | 5.55 | 230.61° | 259.75° | 5.04 | 5.14 | 248.42° | 247.99° | 2.45 | 3.18 | 565.30° | 610.42° | |
| K2 | 2.78 | - | 268.82° | - | 2.14 | - | 289.21° | - | 0.71 | - | 503.20° | - | |
| K1 | 32.38 | 37.00 | 288.34° | 301.69° | 30.18 | 36.63 | 298.42° | 308.78° | 25.95 | 29.59 | 296.38° | 316.75° | |
| O1 | 28.21 | 24.83 | 241.35° | 239.68° | 26.49 | 23.54 | 252.60° | 250.55° | 22.94 | 19.91 | 251.36° | 268.11° | |
| P1 | 10.49 | - | 281.40° | - | 9.72 | - | 291.69° | - | 8.38 | - | 290.80° | - | |
| Q1 | 4.38 | 3.89 | 232.83° | 216.41° | 4.44 | 4.34 | 247.50° | 231.97° | 3.67 | 3.21 | 237.83° | 249.69° | |
| M4 | 11.21 | 12.14 | 260.08° | 261.56° | 9.90 | 10.32 | 282.65° | 283.72° | 2.12 | 3.31 | 282.65° | 286.37° | |
| MS4 | 5.07 | - | 339.08° | - | 4.16 | - | 376.70° | - | 0.69 | - | 376.70° | - | |
注: “-”表示无数据 |
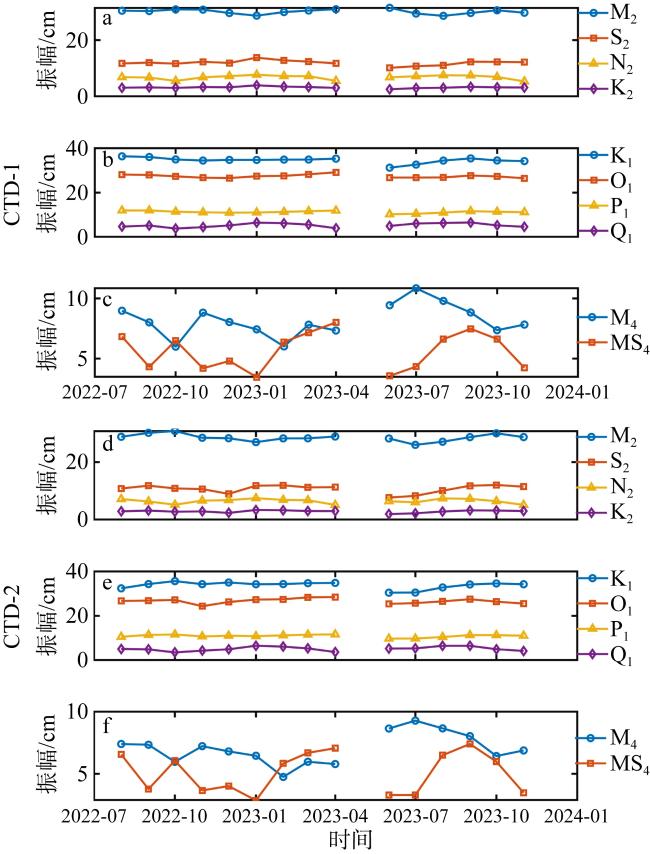
图4 2022—2023年观测期间分潮振幅的月变化a、b、c分别为CTD-1半日潮、全日潮和浅水分潮振幅; d、e、f分别为CTD-2半日潮、全日潮和浅水分潮振幅 Fig. 4 Monthly variation of tidal amplitude during the observed period from 2022 to 2023. Panels (a), (b), and (c) show the amplitudes of CTD-1 for the semi-diurnal tide, diurnal tide, and shallow water tidal components, respectively. Panels (d), (e), and (f) display the amplitudes of CTD-2 for the semi-diurnal tide, diurnal tide, and shallow water tidal components, respectively |
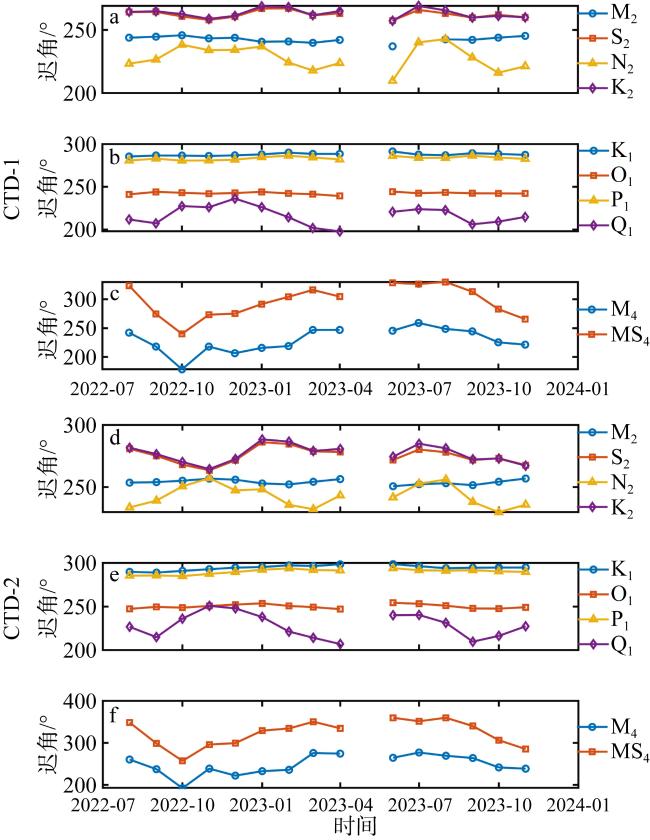
图5 2022—2023年观测期间分潮迟角的月变化a、b、c分别为CTD-1半日潮、全日潮和浅水分潮迟角; d、e、f分别为CTD-2半日潮、全日潮和浅水分潮迟角 Fig. 5 Monthly variation of tidal phase during the observed period from 2022 to 2023. Panels (a), (b), and (c) represent tidal phases for the semi-diurnal tide, diurnal tide, and shallow water tidal components of CTD-1, respectively. Panels (d), (e), and (f) depict tidal phases for the semi-diurnal tide, diurnal tide, and shallow water tidal components of CTD-2, respectively |
表4 全部观测期间双月湾潟湖沿程三站点潮汐调和常数平均值Tab. 4 The averaged tidal harmonic constants at three stations along the Shuangyue Bay Lagoon during the entire observed periods |
| 分潮 | CTD-1 | CTD-2 | CTD-3 | |||
|---|---|---|---|---|---|---|
| 振幅η/cm | 迟角φ | 振幅η/cm | 迟角φ | 振幅η/cm | 迟角φ | |
| M2 | 29.90 | 240.45° | 27.74 | 253.33° | 11.55 | 580.83° |
| S2 | 11.21 | 264.35° | 9.45 | 279.17° | 2.32 | 519.24° |
| N2 | 6.17 | 229.93° | 5.78 | 245.56° | 2.45 | 565.30° |
| K2 | 3.03 | 267.37° | 2.54 | 283.01° | 0.71 | 503.20° |
| K1 | 33.45 | 288.18° | 31.94 | 296.38° | 25.95 | 304.74° |
| O1 | 27.77 | 241.61° | 26.55 | 251.36° | 22.94 | 257.65° |
| P1 | 10.86 | 281.88° | 10.31 | 290.80° | 8.38 | 297.66° |
| Q1 | 4.81 | 228.72° | 4.77 | 237.83° | 3.67 | 251.72° |
| M4 | 11.21 | 260.08° | 9.90 | 265.47° | 2.12 | 597.32° |
| MS4 | 5.07 | 339.08° | 4.16 | 350.00° | 0.69 | 677.48° |
表5 分潮传播速度${{C}_{A}}$及潮波振幅梯度δ的潟湖沿程变化Tab.5 Tidal wave celerity${{C}_{A}}$and tidal wave amplitude gradient δ changes along the course of the lagoon |
| 分潮 | CTD-1至CTD-2 | CTD-2至CTD-3 | ||
|---|---|---|---|---|
| ${{C}_{A}}$/(m·s-1) | $\delta $/(10-6 m-1) | ${{C}_{A}}$/(m·s-1) | $\delta $/(10-6 m-1) | |
| M2 | 3.25 | -0.14 | 0.07 | -3.05 |
| S2 | 2.92 | -0.33 | 0.09 | -4.49 |
| N2 | 2.63 | -0.13 | 0.07 | -2.99 |
| K2 | 2.78 | -0.34 | 0.10 | -4.19 |
| K1 | 2.65 | -0.09 | 1.35 | -0.77 |
| O1 | 2.07 | -0.09 | 1.66 | -0.54 |
| P1 | 2.42 | -0.10 | 1.64 | -0.76 |
| Q1 | 2.13 | -0.02 | 0.72 | -0.97 |
| M4 | 3.71 | -0.24 | 0.14 | -4.80 |
| MS4 | 2.26 | -0.38 | 0.15 | -5.29 |
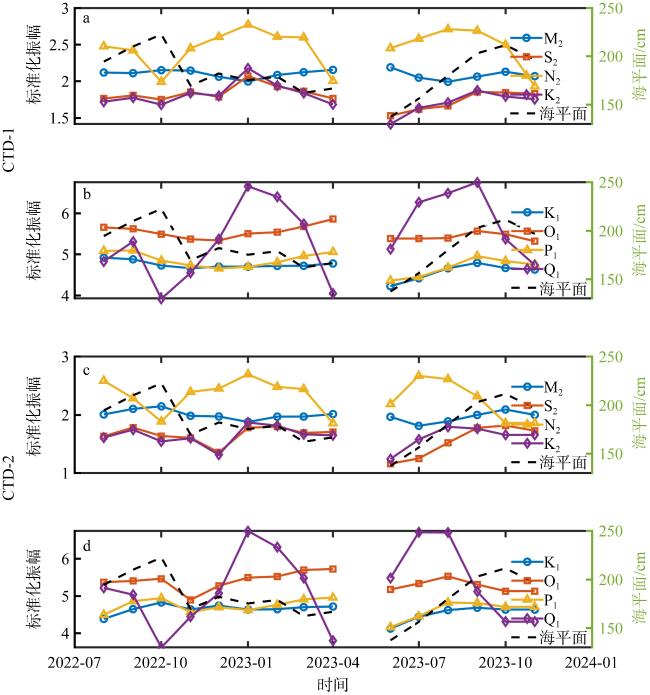
图6 八大分潮标准化振幅的月变化a、b分别为CTD-1半日潮和全日潮标准化振幅; c、d分别为CTD-2半日潮和全日潮标准化振幅 Fig. 6 The monthly variations of the standardized amplitudes of the eight major tidal components. (a) and (b) represent the semi-diurnal and diurnal tidal standardized amplitudes of CTD-1, respectively; (c) and (d) show the normalized amplitudes of the semi-diurnal and diurnal tides of CTD-2, respectively |
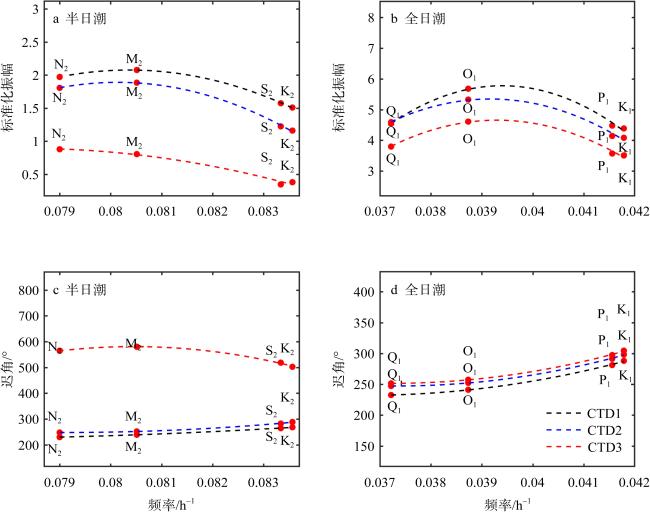
图7 全部观测期间双月湾澙湖振幅、迟角平均值与频率关系a. 澙湖半日潮的标准化振幅; b. 澙湖全日潮的标准化振幅; c. 澙湖半日潮的迟角; d. 澙湖全日潮的迟角 Fig. 7 The relationship between the tidal amplitude, phase, and frequency of the Shuangyue Bay Lagoon during all observed periods. (a) The standardized amplitude of the semi-diurnal tide in the lagoon; (b) the standardized amplitude of the diurnal tide in the lagoon; (c) the phase of the semi-diurnal tide in the lagoon, and (d) the phase of the diurnal tide in the lagoon |
| [1] |
陈浩, 2011. 粤西水东湾沙坝—潟湖海岸近期变化研究[D]. 上海: 华东师范大学.
|
| [2] |
丛新, 匡翠萍, 武云龙, 等, 2022. 侵蚀浪条件下沉水植被对沙坝—潟湖海岸的冲淤影响研究[J]. 热带海洋学报, 41(4): 31-37.
|
| [3] |
戴志军, 施伟勇, 陈浩, 2011. 沙坝—潟湖海岸研究进展与展望[J]. 上海国土资源, 32(3): 12-17.
|
| [4] |
季荣耀, 罗宪林, 陆永军, 等, 2007. 粤西博贺沙坝潟湖海岸体系形成发育与现代演变[J]. 海洋工程, 25(3): 103-108.
|
| [5] |
姜来想, 2010. 1973-2009年山东半岛沿岸潟湖遥感监测与变迁分析[D]. 青岛: 国家海洋局第一海洋研究所.
|
| [6] |
李春初, 罗宪林, 张镇元, 等, 1986. 粤西水东沙坝潟湖海岸体系的形成演化[J]. 科学通报, 31(20): 1579-1582 (in Chinese).
|
| [7] |
李长均, 2019. 双月湾康养旅游特色小镇发展策略研究[D]. 哈尔滨: 哈尔滨工业大学.
|
| [8] |
缪红兵, 乔璐璐, 仲毅, 等, 2022. 人类活动和自然演变共同驱动下黄河三角洲海域潮波及物质输运变化[J]. 海洋学报, 44(9): 73-86.
|
| [9] |
邱秀芳, 李博, 王博芝, 等, 2023. 珠江河网典型横向汊道径潮动力时空差异性分析—以“南沙—南华”横向汊道为例[J]. 热带海洋学报, 42(4): 77-90.
|
| [10] |
孙阳, 2021. 近50年来天鹅湖沙坝海岸地貌演变[J]. 鲁东大学学报(自然科学版), 37(4): 366-373.
|
| [11] |
孙宗勋, 赵焕庭, 1992. 大亚湾大鹏澳菱角石水下沿岸沙坝成因[J]. 海洋通报, 11(2): 45-49.
|
| [12] |
谢梅芳, 张萍, 杨昊, 等, 2021. 珠江“伶仃洋河口湾—虎门—潮汐通道”的潮波传播特征[J]. 热带海洋学报, 40(4): 1-13.
|
| [13] |
辛红雨, 谢强, 王卫强, 2022. 东印度沿岸流的季节变化及其热盐输运[J]. 热带海洋学报, 41(2): 38-51.
|
| [14] |
杨红强, 谭飞, 徐辉龙, 等, 2022. 环礁潟湖沉积物重建南沙群岛小冰期以来的热带气旋活动[J]. 热带海洋学报, 41(6): 171-182.
|
| [15] |
杨世伦, 1989. 我国潮汐沼泽的类型及其开发利用[J]. 自然资源, 11(1): 29-34 (in Chinese).
|
| [16] |
英晓明, 严金辉, 赵明利, 2023. 惠州大亚湾海域风暴潮期间溢油情景模拟研究[J]. 海洋预报, 40(5): 81-89.
|
| [17] |
余建奎, 任宗海, 战超, 等, 2022. 山东荣成天鹅湖沙坝水下岸坡地貌冲淤演变分析[J]. 热带海洋学报, 41(4): 61-70.
|
| [18] |
张乔民, 陈欣树, 王文介, 等, 1995. 华南海岸沙坝瀉湖型潮汐汊道口门地貌演变[J]. 海洋学报, 17(2): 69-77 (in Chinese).
|
| [19] |
郑哲昊, 庄伟, 孙振宇, 等, 2020. 大亚湾及其邻近海域冬季温度、盐度的分布及日变化特征[J]. 应用海洋学学报, 39(1): 71-79.
|
| [20] |
|
| [21] |
|
| [22] |
|
| [23] |
|
| [24] |
|
| [25] |
|
| [26] |
|
| [27] |
|
| [28] |
|
| [29] |
|
| [30] |
|
| [31] |
|
| [32] |
|
| [33] |
|
| [34] |
|
| [35] |
|
| [36] |
|
| [37] |
|
| [38] |
|
| [39] |
|
| [40] |
|
| [41] |
|
| [42] |
|
| [43] |
|
| [44] |
|
| [45] |
|
| [46] |
|
| [47] |
|
| [48] |
|
| [49] |
|
| [50] |
|
| [51] |
|
/
| 〈 |
|
〉 |
