
OBN转换横波分裂分析刻画东海西湖凹陷裂缝分布*
*感谢CGG北京技术支持团队给予的指导和帮助, 感谢中石化上海海洋油气分公司朱立新、郝晓红的宝贵修改意见
|
李亚清(1991—), 女, 湖北省郧西县人, 博士, 中级工程师, 海洋地球物理方向。email: liyaq.shhy@sinopec.com |
Copy editor: 孙翠慈
收稿日期: 2024-03-13
修回日期: 2024-03-27
网络出版日期: 2024-05-17
OBN converted shear wave splitting analysis depicts the fracture distribution in the Xihu Sag in the East China Sea*
Copy editor: SUN Cuici
Received date: 2024-03-13
Revised date: 2024-03-27
Online published: 2024-05-17
裂缝方位和发育强度是各向异性研究的重要参数, 通过常规纵波地震数据难以辨识。相比之下, 裂缝引起的横波分裂现象更加明显。为研究中国东海西湖凹陷探区裂缝发育情况, 本文利用四分量海底节点(ocean bottom nodes, OBN)地震数据中记录的转换横波信息进行了横波分裂分析。研究发现: 浅层(0~3000ms)快慢横波时间延迟3~5ms, 平均裂缝方向约111°—117°, 裂缝方位相似度高达80%~90%, 裂缝发育比较集中; 深层(大于3000ms)裂缝分布较复杂, 快慢横波时间延迟主要集中于6~8ms, 主要方位集中于119°, 但裂缝方位相似度低(低于50%), 方位不集中, 出现约20°—40°方位的裂缝。研究区浅层主要发育NW(西北)向裂缝, 深层主要发育NW(西北)和NE(东北)向裂缝, 与研究区断层发育方向基本一致; 横波分裂时间延迟量从浅部到深部逐渐增大, 表明越往深层, 裂缝发育强度越强; 研究区南侧时间延迟明显高于北侧, 表明南侧裂缝发育强度高于北侧。
李亚清 , 刘苗 , 赵秀莲 , 陈茂根 , 朱宝衡 , 陈琳枝 , 李振伟 . OBN转换横波分裂分析刻画东海西湖凹陷裂缝分布*[J]. 热带海洋学报, 2025 , 44(1) : 189 -199 . DOI: 10.11978/2024056
The orientation and intensity of fracture are important information for studying anisotropy, but they are difficult to identify through the conventional compression wave (P) of seismic data. In contrast, the shear wave splitting (SWS) caused by azimuth anisotropy in the converted seismic wave (PS) is helpful to characterize the strength and azimuth of fractures. In order to study the distribution characteristics of fractures in the Xihu Sag of East China Sea, the converted shear wave information recorded in four-component submarine nodes (ocean bottom nodes, OBN) was used to conduct SWS analysis. First, the principle of SWS and the layer-stripped method were introduced in detail. Then, the SWS analysis with the seismic data in the study area was carried out. The results show that in the shallow layer (0~3000 ms), the time delay of fast and slow shear waves is 3~5 ms, the average fracture direction is about 111°-117°, and the fracture similarity is as high as 80%~90%, which indicates that the fracture orientation is relatively concentrated. However, in the deep layer, the distribution of fracture is rather complex, for which the time delay is about 6~8 ms and the main azimuth is concentrated at 119°, but the fracture similarity is low (less than 50%) and the fracture direction is about 20°−40°, which indicates that the azimuth is not concentrated. The results show that NW-trending fractures are mainly developed in the shallow layer of the study area, and NW- and NE-trending fractures are mainly developed in the deep layer, which is consistent with the fault development directions obtained from the P results in the study area. The time delay gradually increases from the shallow to the deep part, indicating that the deeper the layer, the more intense the fracture develops. The time delay in the south of the study area is significantly higher than that in the north, indicating that the intensity of fracture in the south is higher than that in the north.
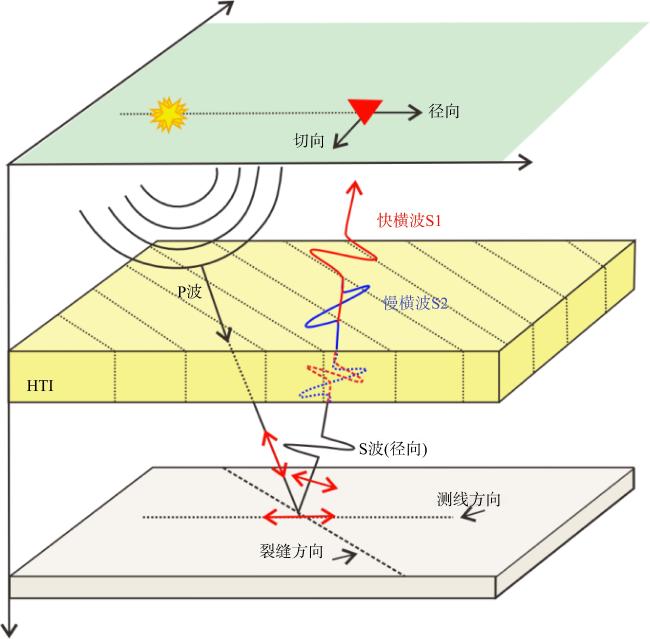
图1 横波传播的极化现象示意图各向异性介质中, SV(shear vertical wave) 会发生剪切波分裂, 由各向异性的断裂方向决定的(图修改自Bale et al, 2009); HTI: 水平横截面各向同性 Fig. 1 Schematic diagram of the polarization phenomenon of transverse wave propagation. In anisotropic media, shear wave splitting occurs in SV, which is determined by the direction of the anisotropic fracture (modified from Bale et al, 2009). HTI: horizontal transverse isotropy |
表1 OBN观测系统参数Tab. 1 Parameters of the OBN geometry |
| 内容 | 参数 |
|---|---|
| 记录道数/道 | 133 |
| 最小炮检距/m | 25.67 |
| 最大炮检距/m | 6482.12 |
| 面元尺寸/(m×m) | 12.5×25 |
| 覆盖次数 | 8横×80纵=640次 |
| 道距/m | 50 |
| 横向炮间距/m | 50 |
| 纵向炮间距/m | 37.5 |
| 横向滚动距/m | 300 |
| 接收线方位角 | 120° |
图4 横波分裂示意图a. 观测系统示意图, 有效源位于CCP中心位置, 径向和切向数据在八个接收器位置测量; b. 沿着裂缝方向(绿色)和垂直与裂缝方向(橙色)快速和慢速振幅变化示意图, 图中红色表示快波, 蓝色表示慢波, 快速和慢速的振幅随对称轴的角度而变化; c、d分别为径向分量和切向分量上快波(红色)和慢波(蓝色)平面视图和分方位角叠加数据, 在(c)中信号振幅随方位角变化而变化, 在(d)中快速和慢速横波的极性在对称平面上反转; 图片修改自Bale et al, 2009 Fig. 4 3D “feature” illustration of shear wave splitting. In (a), representative geometries are shown, with the active source at the center of the CCP and the radial transverse data measured at eight receiver positions. In (b), fast and slow amplitude changes are shown in red and blue, respectively, relative to the isotropic (green) and axis of symmetry (orange) planes. Note that the signal amplitude of fast and slow shear waves varies with the angle of the plane of symmetry. (c) and (d) are the overlay data of the upper fast wave (red) and slow wave (blue) plane views and sub-azimuth angles on the radial and tangential components, respectively, to illustrate the effect of azimuth changes. In (c), the signal amplitude varies with azimuth; In (d), the polarity of the fast and slow transverse waves is reversed in the plane of symmetry. (Modified from Bale et al., 2009) |
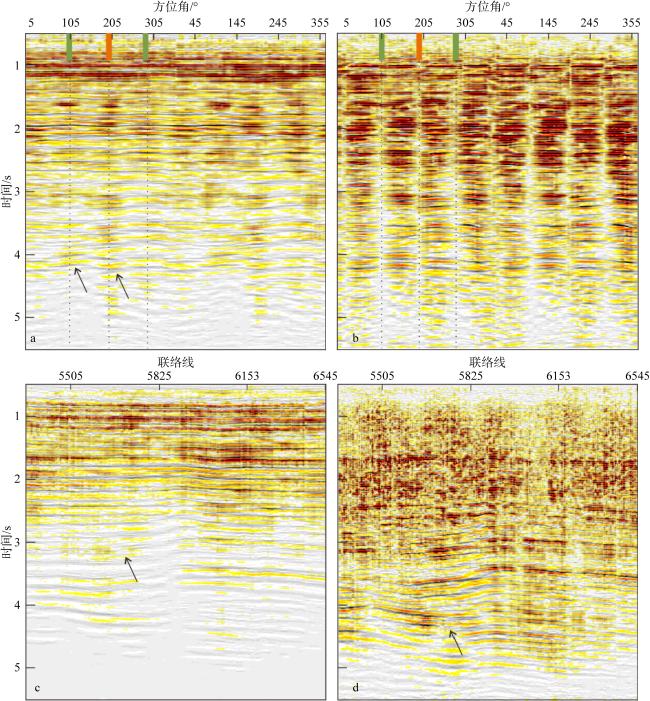
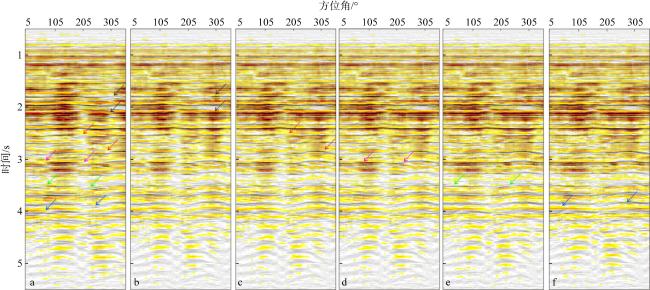
图7 (a)原始R分量地震数据分方位角叠加结果; 1000ms(b)、1600ms(c)、约2400ms(d)、约3100ms(e)、约3500ms(f)分别进行横波分裂分析后的叠加结果Fig. 7 (a) The original azimuth stack of R component; azimuth stack of R component for (b) 1000 ms, (c) 1600 ms, (d) about 2400 ms, (e) about 3100 ms, and (f) about 3500 ms respectively after shear wave splitting analysis |
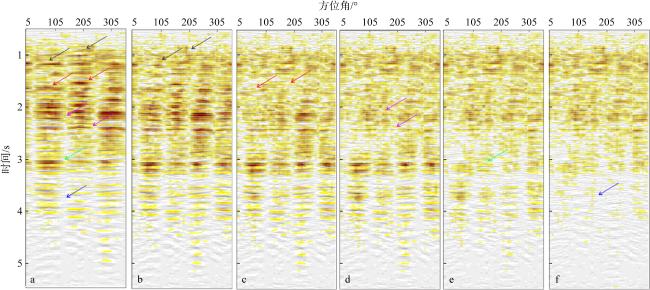
图8 (a)原始T分量地震数据分方位角叠加结果; 1000ms(b)、1600ms(c)、约2400ms(d)、约3100ms(e)、约3500ms(f)分别进行横波分裂分析后的叠加Fig. 8 (a) The original azimuth stack of T component; azimuth stack of T component for (b) 1000 ms, (c) 1600 ms, (d) about 2400 ms, (e) about 3100 ms, and (f) about 3500 ms respectively after shear wave splitting analysis |
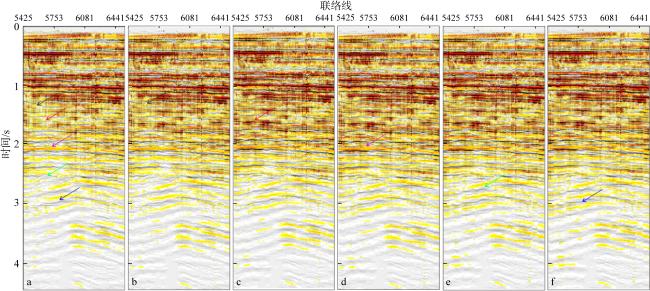
图9 (a)原始数据R分量叠加; 1000ms(b)、1600ms(c)、约2400ms(d)、约3100ms(e)、约3500ms(f)进行横波分裂分析后的R分量叠加Fig. 9 (a) R component stack of the original data; stack of R component for (b) 1000 ms, (c) 1600 ms, (d) about 2400 ms, (e) about 3100 ms, and (f) 3500 ms respectively after shear wave splitting analysis |
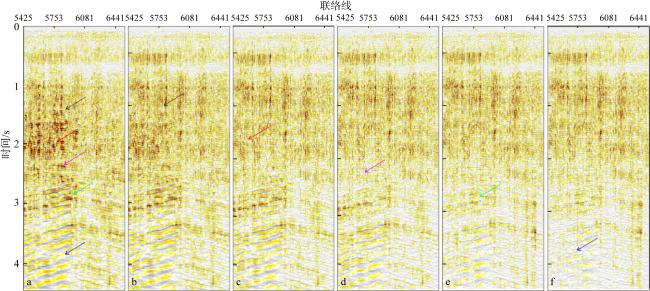
图10 (a)原始数据T分量叠加; 1000ms(b)、1600ms(c)、约2400ms(d)、约3100ms(e)、约3500ms(f)分别进行横波分裂分析后的T分量叠加Fig. 10 (a) T component stack of the original data; stack of T component for (b) 1000 ms, (c) 1600 ms, (d) about 2400 ms, (e) about 3100 ms, and (f) about 3500 ms respectively after shear wave splitting analysis |
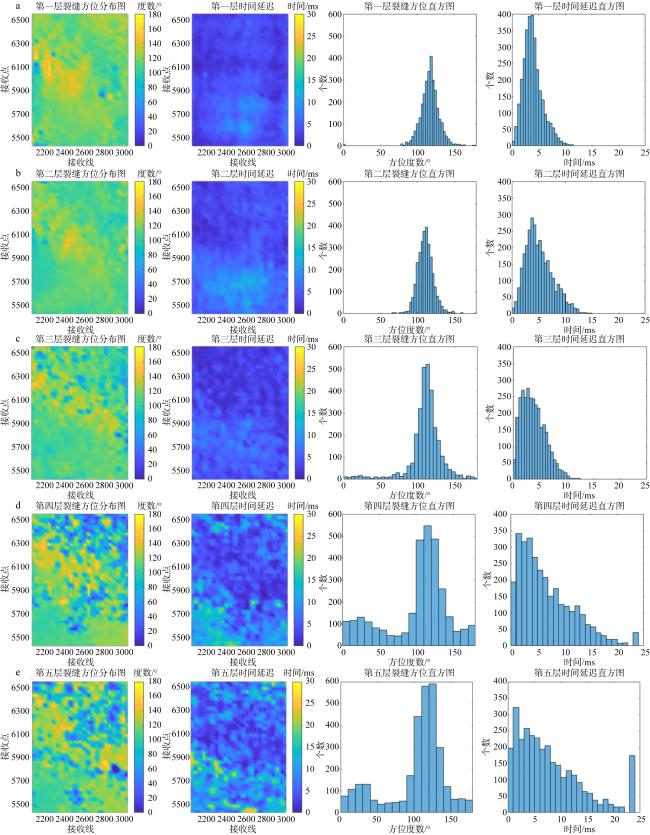
图11 层剥法揭示的裂缝方位角分布图、层段内累积时间延迟图和裂缝方位角直方图和时间延迟直方图(从左至右)a. 层1, 1000ms; b. 层2, 1600ms; c. 层3, 约2400ms; d. 层4, 约3100ms; e. 层5, 约3500ms Fig. 11 Azimuth distribution map of the fractures, time delay, the histogram of crack azimuth and the histogram of time delay obtained by layer-stripped method for (a) layer 1, 1000 ms, (b) layer 2, 1600 ms, (c) layer 3, about 2400 ms, (d) layer 4, about 3100 ms, and (e) layer 5, about 3500 ms |
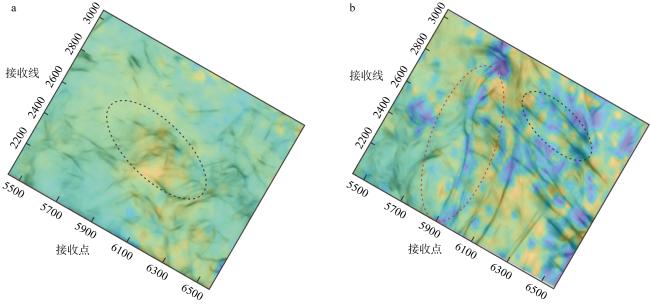
图12 P波(a)浅层(对应于层1)和(b)深层(对应于层5)PP波断层相干图与转换横波分裂分析得到的裂缝方位叠合图Fig. 12 P-wave (a) shallow part (corresponding to layer 1) and (b) deep part (corresponding to layer 5) fault coherence diagram obtained from PP wave and fracture azimuth diagram obtained from converted shear wave splitting analysis |
| [1] |
肖维德, 徐天吉, 丁蔚楠, 2013. 利用转换横波层剥离分析技术检测裂缝[J]. 石油地球物理勘探, 48(6): 966-971.
|
| [2] |
|
| [3] |
|
| [4] |
|
| [5] |
|
| [6] |
|
| [7] |
|
| [8] |
|
| [9] |
|
| [10] |
|
| [11] |
|
| [12] |
|
| [13] |
|
| [14] |
|
| [15] |
|
| [16] |
|
| [17] |
|
| [18] |
|
/
| 〈 |
|
〉 |


