
台风影响下西沙灰沙岛的时空变化特征
|
肖海婷(2000—), 女, 江西省赣州市人, 硕士研究生, 从事珊瑚礁遥感研究。email: xht_gis@163.com |
Copy editor: 殷波 , YIN Bo
收稿日期: 2024-04-30
修回日期: 2024-06-12
网络出版日期: 2024-06-20
基金资助
国家自然科学基金项目(4192200195)
国家自然科学基金项目(42030502)
国家自然科学基金项目(42090041)
Spatiotemporal changes of lime-sand islands in the Xisha Islands under the impacts of typhoons
Copy editor: YIN Bo
Received date: 2024-04-30
Revised date: 2024-06-12
Online published: 2024-06-20
Supported by
National Natural Science Foundation of China(4192200195)
National Natural Science Foundation of China(42030502)
National Natural Science Foundation of China(42090041)
文章基于哨兵二号(Sentinel-2)遥感影像, 使用梯度向量流-主动轮廓模型(gradient vector flow-snake, GVF-Snake)提取南海西沙北岛、中岛和南岛的海滩基部线(toe of beach, ToB)和植被边界线, 获取了灰沙岛及其海滩面积。采用突变检验法, 判别出2016—2022年造成研究区岛屿面积发生突变的台风事件。通过统计台风事件中灰沙岛归一化植被指数(normalized difference vegetation index, NDVI)和海滩面积变化, 以及ToB线和植被边界线的移动距离, 分析了西沙灰沙岛受台风影响后的时空变化特征及其影响因素。结果显示: 1) 台风导致灰沙岛植被以轻度受损为主, 中度及以上受损植被分布在岛屿沿岸, 导致了植被边界线的后退, 而沉积物随受损植被剥脱, 并随风浪冲刷至海滩, 导致了ToB线的向海推进。受台风路径方向影响, 迎风面沿岸首先遭受冲击, 灰沙岛迎风面沿岸植被重度受损, 因而导致ToB线和植被边界线在迎风面具有更大的移动距离; 2) 在台风影响末期, 由于灰沙岛沿岸植被受损, 植被边界线的后退和ToB线的向海推进, 使得海滩面积扩大, 而在台风过后, 因失去植被的固定, 在海滩堆积的松散沉积物在风浪作用下从岛屿运离至礁坪, 使得海滩面积缩减。因此, 具有固定与缓冲作用的沿岸植被在维持灰沙岛的稳定性方面具有重要作用; 3) 台风风速增大和台风路径与灰沙岛之间距离的缩短, 以及台风期间海洋表层流速的增加, 易使得灰沙岛遭受极端波浪和风暴流的影响, 将增大灰沙岛严重受损植被的面积, 进而造成更大的岸线移动的距离和海滩面积的变化。此外, 台风可引起沉积物在灰沙岛及其周围环境中的运移, 进而直接改变灰沙岛海滩面积及其形态。台风过后灰沙岛上大量松散沉积物的流失, 导致了灰沙岛面积突变减小, 加之全球变暖造成生物碳酸盐产率下降, 以及来自周围环境的沉积物供应不足, 可能是南海西沙灰沙岛面积长期呈下降趋势的原因。
肖海婷 , 黄荣永 , 刘羿 , 余克服 . 台风影响下西沙灰沙岛的时空变化特征[J]. 热带海洋学报, 2025 , 44(2) : 157 -177 . DOI: 10.11978/2024099
In this study, we explored the changing characteristics of spatial patterns of lime-sand islands in the Xisha Islands under the impacts of typhoons and their driving factors, which are of great significance to the ecological protection and sustainable development of lime-sand islands in the South China Sea (SCS). First, to determine the area of the BeiDao, ZhongDao and Nandao islands of the Xisha Islands and their beaches, the toe of beach line (ToB) and the boundary of vegetation were extracted using the gradient vector flow-snake (GVF-snake) model based on Sentinel-2 remote sensing images. The monthly average area of the study islands from 2016 to 2022 was examined using the change point detection method, and the typhoon events that had caused significant changes in the size of the study islands were identified. Finally, the spatial and temporal characteristics of the islands affected by typhoons were analyzed based on the changes in lime-sand islands area, vegetation area, beach area and normalized difference vegetation index (NDVI) during typhoon events. The results are shown as follows. 1) The vegetation of the islands was mainly slightly stressed by the typhoons, and the severely stressed areas were mainly located along the shorelines. The typhoons caused a significant retreat of the vegetation boundary of the islands, and the sediments were stripped off with the damaged vegetation and washed to the beach with the wind and waves, resulting in the seaward advancement of the ToB line. The windward coasts were the first to be impacted by the direction of the typhoon path, and the vegetation along the windward side of the islands was heavily damaged, resulting in more significant changes in vegetation, vegetation boundary, and the ToB line on the windward side. 2) As the vegetation along the lime-sand islands was damaged, the retreat of the vegetation boundary line and the seaward advancement of the ToB line resulted in the expansion of the beach area, whereas after the typhoon, due to the loss of vegetation fixation, the loose sediment accumulated on the beach was transported away from the islands to the reef flats by the wind and wave action, resulting in the reduction of the beach area. Therefore, coastal vegetation that buffers and fixes the sand is critical to the stability of lime-sand islands. 3) Increased typhoon wind speeds and shorter distances between typhoon paths and the islands, as well as increased surface currents during the typhoon, made the islands exposed to extreme wave and storm currents, which led to an increase in the area of severely damaged vegetation on the islands, resulting in greater shoreline movement and changes in beach area. In addition, typhoons can cause sediment transport between the lime-sand islands and their surroundings, which can directly change the beach area and morphology of the lime-sand islands. The loss of large amounts of unconsolidated sediments on the lime-sand islands after the typhoon, which led to an abrupt decrease in the size of the islands, together with the decrease in the rate of biogenic carbonate production due to global warming and the insufficient supply of sediments from the surrounding environment, may be the reasons for the long-term decreasing trend in the size of the lime-sand islands in the Xisha Islands.
Key words: lime-sand island; typhoon; remote sensing; Xisha Islands
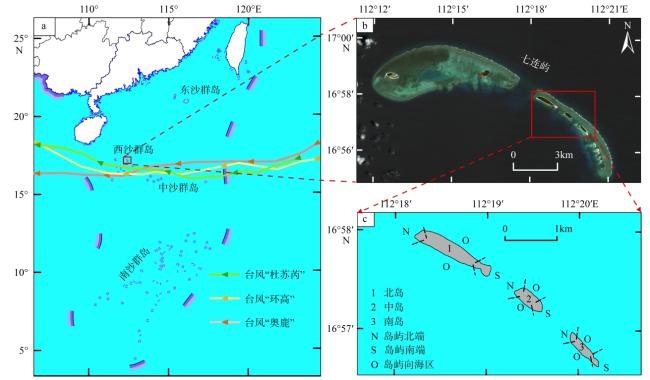
图1 研究区位置示意图a. 西沙群岛位置及台风路径示意图。基于自然资源部标准地图服务网站下载的审图号为GS(2023)2762号标准地图制作; b. 七连屿Sentinel-2卫星数据(成像日期: 2021年4月9日); c. 北岛、中岛和南岛及其分区示意图 Fig. 1 Location of study area. (a) Location of Xisha Islands and typhoon tracks; (b) Sentinel-2 satellite data for Qilianyu (imaging date: April 9, 2021); (c) Map of the BeiDao, ZhongDao and NanDao islands and the islands sections |
表1 对研究区造成影响的台风信息Tab. 1 The list of typhoons information affecting study islands |
| 序号 | 编号 | 名称 | 日期 | 强度等级 |
|---|---|---|---|---|
| 1 | 1603 | 银河 | 20160725—20160728 | 强热带风暴 |
| 2 | 1621 | 莎莉嘉 | 20161012—20161020 | 超强台风 |
| 3 | 1704 | 塔拉斯 | 20170710—20170717 | 强热带风暴 |
| 4 | 1710 | 海棠 | 20170727—20170803 | 热带风暴 |
| 5 | 1719 | 杜苏芮 | 20170911—20170916 | 强台风 |
| 6 | 1720 | 卡努 | 20171011—20171016 | 强台风 |
| 7 | 1809 | 山神 | 20180716—20180724 | 热带风暴 |
| 8 | 1822 | 山竹 | 20180907—20180917 | 强台风 |
| 9 | 1826 | 玉兔 | 20181021—20181103 | 强台风 |
| 10 | 1904 | 木恩 | 20190702—20190704 | 热带风暴 |
| 11 | 1907 | 韦帕 | 20190730—20190803 | 热带风暴 |
| 12 | 1912 | 杨柳 | 20190825—20190830 | 热带风暴 |
| 13 | 1928 | 北冕 | 20191125—20191206 | 强台风 |
| 14 | 2003 | 森拉克 | 20200731—20200803 | 热带风暴 |
| 15 | 2011 | 红霞 | 20200914—20200919 | 强热带风暴 |
| 16 | 2022 | 环高 | 20201108—20201116 | 强台风 |
| 17 | 2104 | 小熊 | 20210611—20210613 | 热带风暴 |
| 18 | 2113 | 康森 | 20210905—20210913 | 强热带风暴 |
| 19 | 2118 | 圆规 | 20211008—20211014 | 台风 |
| 20 | 2122 | 雷伊 | 20211212—20211221 | 超强台风 |
| 21 | 2203 | 暹芭 | 20220629—20220707 | 台风 |
| 22 | 2207 | 木兰 | 20220808—20220811 | 热带风暴 |
| 23 | 2209 | 马鞍 | 20220821—20220826 | 台风 |
| 24 | 2216 | 奥鹿 | 20220921—20220929 | 超强台风 |
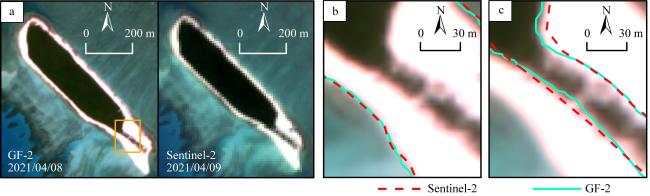
图3 Sentinel-2和GF-2影像提取结果对比a. 遥感数据及成像时间; b. 图a中黄色方框所指区域中ToB线提取结果对比; c. 植被边界线提取结果对比。图b和图c中红色虚线表示Sentinel-2影像提取结果; 绿色曲线表示GF-2影像提取结果 Fig. 3 Comparison of Sentinel-2 and GF-2 image extraction results. (a) Remote sensing data and time of imaging; (b) Comparison of ToB line extraction results in the region indicated by the yellow box in (a); (c) Comparison of vegetation boundary extraction results. The red dashed lines in Figures b and c represent the Sentinel-2 image extraction results; The green curve represents the GF-2 image extraction result |
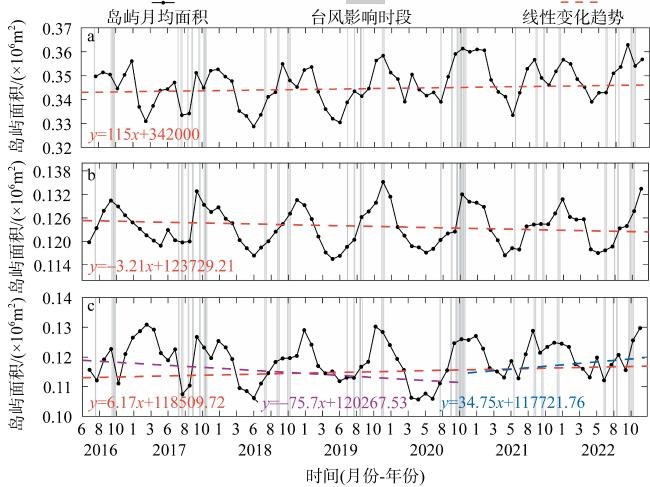
图4 2016—2022年研究区岛屿的面积时间序列及其线性趋势a. 北岛; b. 中岛; c. 南岛。图中方程式表示灰沙岛面积的一元线性拟合方程 Fig. 4 Time series of the area of study islands and their linear trends (dashed line) from 2016 to 2022. (a) BeiDao island; (b) ZhongDao island; (c) NanDao island. The equation in the figure represents a univariate linear fitting equation for the area of Grey Sand Island |
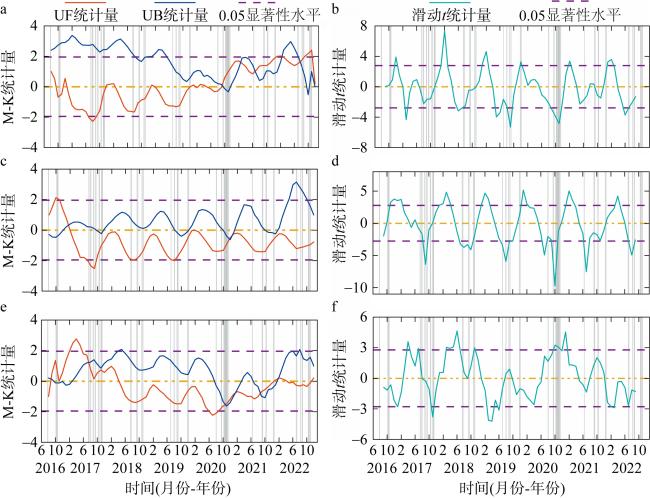
图5 研究区岛屿面积的Mann-Kendall检验(a、c、e)和滑动t检验(b、d、f)a, b: 北岛; c, d: 中岛; e, f: 南岛。图中灰色竖纹表示台风影响时段 Fig. 5 Mann-Kendall test (a, c, e) and moving t-test (b, d, f) for the area of study islands. (a, b) BeiDao island; (c, d) ZhongDao island; (e, f) NanDao island. The gray vertical lines in the figure indicate the period of typhoon influence |
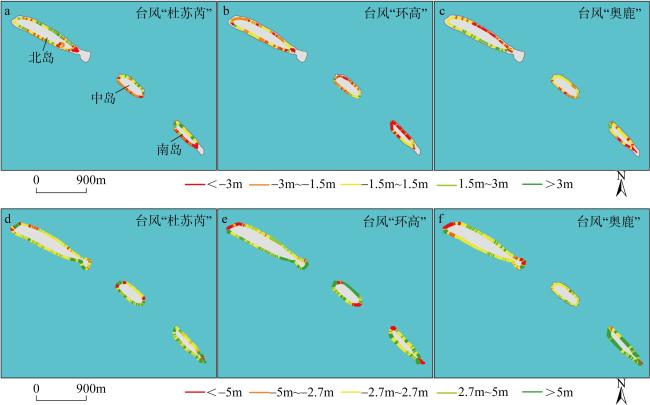
表2 台风“杜苏芮”、“环高”和“奥鹿”影响前后Sentinel-2影像选取Tab. 2 Selection of Sentinel-2 images before and after the impacts of Typhoons Doksuri, Vamco and Noru |
| 名称 | 台风路径至岛屿 最短距离/km | 距岛最近时风速/(m·s-1) | 影像日期 | ||
|---|---|---|---|---|---|
| 台风前 | 台风影响末期 | 台风后 | |||
| 杜苏芮 | 88.91 | 48 | 2017/08/13 | 2017/09/17 | 2017/10/27 |
| 环高 | 75.95 | 33 | 2020/10/31 | 2020/11/25 | 2020/12/15 |
| 奥鹿 | 147.56 | 52 | 2022/09/16 | 2022/10/01 | 2022/11/05 |
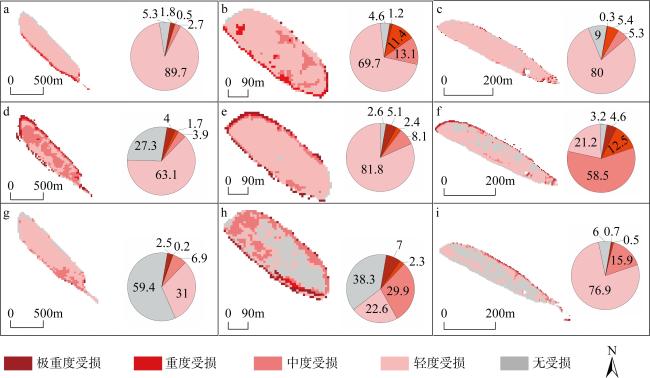
图6 研究区岛屿受台风“杜苏芮”(a~c)、“环高”(d~f)和“奥鹿”(g~i)影响后植被受损格局及不同受损情况像元占比a, d, g: 北岛; b, e, h: 中岛; c, f, i: 南岛。各分图中的饼状图为不同损伤程度的像元占比(单位: %) Fig. 6 Damage pattern and proportion of stressed pixels of vegetation in study islands after the impact of Typhoons Doksuri (a~c), Vamco (d~f) and Noru (g~i). (a, d, g) BeiDao island; (b, e, h) ZhongDao island; (c, f, i) NanDao island |
图7 研究区岛屿受不同台风影响后植被边界线净移动量(a~c)和ToB线净移动量(d~f)Fig. 7 Net movements of vegetation boundary (a~c) and ToB line (d~f) in study islands after the impact of different typhoons |
表3 研究区岛屿受台风“杜苏芮”影响后ToB线和植被边界线移动情况Tab. 3 The NSM of the ToB line and vegetation boundary of study islands after Typhoon Doksuri |
| 岛屿 | 分区 | 海滩基部线 | 植被边界线 | |||||||||||
|---|---|---|---|---|---|---|---|---|---|---|---|---|---|---|
| 平均/m | 最大/m | 最小/m | 向陆/% | 向海/% | 稳定/% | 平均/m | 最大/m | 最小/m | 后退/% | 扩张/% | 稳定/% | |||
| 背风面 | ||||||||||||||
| 北岛 | 北端 | -3.0 | 7.7 | -10.2 | 37.78 | 18.89 | 43.33 | -0.1 | 6.3 | -3.9 | 21.64 | 17.16 | 61.19 | |
| 向海区 | -1.0 | 6.7 | -9.1 | 28.68 | 6.65 | 64.67 | 1.5 | 7.0 | -3.9 | 5.29 | 44.87 | 49.83 | ||
| 南端 | 0.2 | 3.2 | -7.6 | 20.20 | 24.75 | 55.05 | -3.8 | 4.0 | -6.4 | 52.05 | 23.29 | 24.66 | ||
| 中岛 | 北端 | 0.6 | 8.8 | -9.2 | 35.29 | 18.18 | 19.79 | 0.5 | 6.1 | -0.1 | 0.00 | 11.76 | 88.24 | |
| 向海区 | -0.2 | 4.5 | -7.7 | 5.45 | 3.96 | 90.59 | 1.0 | 5.6 | -3.4 | 2.87 | 19.77 | 77.36 | ||
| 南端 | -0.8 | 9.9 | -5.5 | 40.56 | 32.87 | 26.57 | 0.5 | 5.2 | -3.9 | 11.03 | 20.69 | 68.28 | ||
| 南岛 | 北端 | 4.5 | 10.5 | -0.4 | 0.00 | 55.04 | 44.96 | 0.5 | 7.2 | -0.1 | 0.00 | 10.77 | 89.23 | |
| 向海区 | 1.6 | 7.1 | -7.7 | 10.30 | 28.66 | 61.04 | 1.3 | 7.5 | -7.6 | 3.97 | 29.44 | 66.60 | ||
| 南端 | 6.1 | 12.6 | -10.0 | 20.57 | 68.00 | 11.43 | -2.3 | -0.3 | -4.2 | 77.08 | 0.00 | 22.92 | ||
| 迎风面 | ||||||||||||||
| 北岛 | 北端 | 2.1 | 13.9 | -8.6 | 26.45 | 17.77 | 55.79 | 0.8 | 4.0 | -0.1 | 0.00 | 21.32 | 78.68 | |
| 向海区 | 2.2 | 8.9 | -3.7 | 4.47 | 57.18 | 38.36 | -0.5 | 6.2 | -8.5 | 23.28 | 18.05 | 58.67 | ||
| 南端 | 6.5 | 6.2 | -7.5 | 11.44 | 70.56 | 18.00 | -4.8 | 1.3 | -5.7 | 81.22 | 0.00 | 18.78 | ||
| 中岛 | 北端 | 4.9 | 8.7 | -5.3 | 29.41 | 58.82 | 11.76 | -1.2 | 0.1 | -4.3 | 19.13 | 0.00 | 80.87 | |
| 向海区 | 3.6 | 11.0 | -2.0 | 0.00 | 70.43 | 29.57 | -1.6 | -0.7 | -5.1 | 71.87 | 0.00 | 28.13 | ||
| 南端 | 3.6 | 6.2 | -1.0 | 0.00 | 69.86 | 30.14 | -2.5 | -1.0 | -8.2 | 84.18 | 0.00 | 15.82 | ||
| 南岛 | 北端 | 3.7 | 9.8 | -0.3 | 0.00 | 55.88 | 44.12 | 2.8 | 6.5 | 0.1 | 0.00 | 80.49 | 19.51 | |
| 向海区 | 3.1 | 9.1 | -3.3 | 3.05 | 59.49 | 37.46 | -2.9 | 3.3 | -9.6 | 67.76 | 5.75 | 26.49 | ||
| 南端 | 4.9 | 12.9 | -8.1 | 0.00 | 59.36 | 40.64 | -4.0 | -5.6 | -2.0 | 100.00 | 0.00 | 0.00 | ||
表4 研究区岛屿受台风“环高”影响后ToB线和植被边界线移动情况Tab. 4 The NSM of the ToB line and vegetation boundary of study islands after Typhoon Vamco |
| 岛屿 | 分区 | 海滩基部线 | 植被边界线 | |||||||||||
|---|---|---|---|---|---|---|---|---|---|---|---|---|---|---|
| 平均/m | 最大/m | 最小/m | 向陆/% | 向海/% | 稳定/% | 平均/m | 最大/m | 最小/m | 后退/% | 扩张/% | 稳定/% | |||
| 背风面 | ||||||||||||||
| 北岛 | 北端 | -7.8 | 5.3 | -12.2 | 73.11 | 5.30 | 21.59 | 8.8 | 10.5 | 3.4 | 95.48 | 0.00 | 4.52 | |
| 向海区 | 1.4 | 5.7 | -8.1 | 4.88 | 43.59 | 51.52 | 4.5 | 10.2 | -0.1 | 74.78 | 0.00 | 25.22 | ||
| 南端 | 2.1 | 4.0 | -8.1 | 14.09 | 24.66 | 61.25 | 3.5 | 36.3 | -8.0 | 10.89 | 72.28 | 16.83 | ||
| 中岛 | 北端 | 3.9 | 7.1 | -5.6 | 26.24 | 61.70 | 12.06 | -3.5 | 3.1 | -6.7 | 72.79 | 5.88 | 21.32 | |
| 向海区 | 4.4 | 6.7 | 0.0 | 0.00 | 98.50 | 0.00 | -3.0 | 0.1 | -9.1 | 61.03 | 7.16 | 31.81 | ||
| 南端 | 1.8 | 9.4 | -10.5 | 11.19 | 55.24 | 33.57 | -0.2 | 4.4 | -4.0 | 17.24 | 10.34 | 72.41 | ||
| 南岛 | 北端 | -3.8 | 5.3 | -8.6 | 60.47 | 21.71 | 17.83 | -3.4 | -1.3 | -9.1 | 77.94 | 0.00 | 22.06 | |
| 向海区 | 1.5 | 7.6 | -12.2 | 7.40 | 39.19 | 53.41 | -4.8 | 0.1 | -7.4 | 72.12 | 0.00 | 27.88 | ||
| 南端 | 1.8 | 13.0 | -15.6 | 5.71 | 67.43 | 26.86 | -1.5 | 3.5 | -9.9 | 28.85 | 3.85 | 67.31 | ||
| 迎风面 | ||||||||||||||
| 北岛 | 北端 | -1.8 | 18.4 | -18.0 | 48.31 | 25.00 | 26.69 | -1.9 | 2.7 | -4.2 | 61.15 | 22.29 | 16.56 | |
| 向海区 | -0.7 | 9.1 | -1.6 | 0.00 | 67.85 | 32.15 | -0.4 | 2.9 | -7.9 | 48.36 | 8.59 | 43.05 | ||
| 南端 | 7.5 | 8.0 | -1.4 | 0.00 | 75.54 | 24.46 | -1.3 | 2.2 | -5.9 | 59.47 | 18.42 | 22.11 | ||
| 中岛 | 北端 | 3.2 | 4.5 | 1.1 | 0.00 | 80.21 | 19.79 | 2.5 | 7.3 | -4.2 | 26.25 | 58.75 | 15.00 | |
| 向海区 | 3.3 | 7.4 | -7.0 | 0.79 | 57.74 | 41.47 | -1.9 | 3.5 | -4.1 | 75.08 | 12.77 | 12.15 | ||
| 南端 | -7.1 | 4.9 | -14.8 | 76.71 | 9.59 | 13.70 | 0.7 | 4.3 | -3.5 | 20.25 | 20.89 | 58.86 | ||
| 南岛 | 北端 | 3.6 | 14.5 | -6.0 | 10.78 | 47.06 | 42.16 | -2.7 | 0.7 | -4.2 | 79.27 | 0.00 | 20.73 | |
| 向海区 | 2.7 | 9.6 | -0.6 | 0.00 | 41.10 | 58.90 | -1.7 | 1.2 | -7.5 | 29.16 | 0.00 | 70.84 | ||
| 南端 | 8.0 | 10.6 | -4.6 | 1.60 | 69.52 | 28.88 | -0.6 | 0.4 | -3.3 | 9.68 | 0.00 | 90.32 | ||
图8 研究区岛屿各分区的海滩在台风“杜苏芮”(a, d, g)、“环高”(b, e, h)和“奥鹿”(c, f, i)影响下不同时期的面积大小a~c: 北岛; d~f: 中岛; g~i: 南岛 Fig. 8 The beach areas of study islands in each subsection under the impact of Typhoons Doksuri (a, d, g), Vamco (b, e, h) and Noru (c, f, i) in each phase. (a—c) BeiDao island; (d—f) ZhongDao island; (g—i) NanDao island |
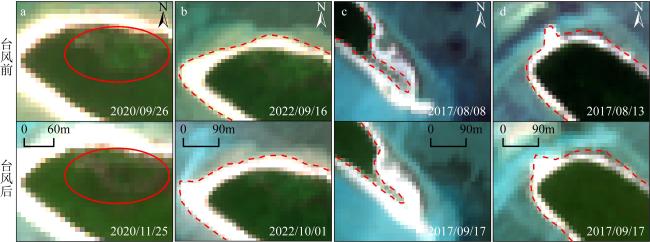
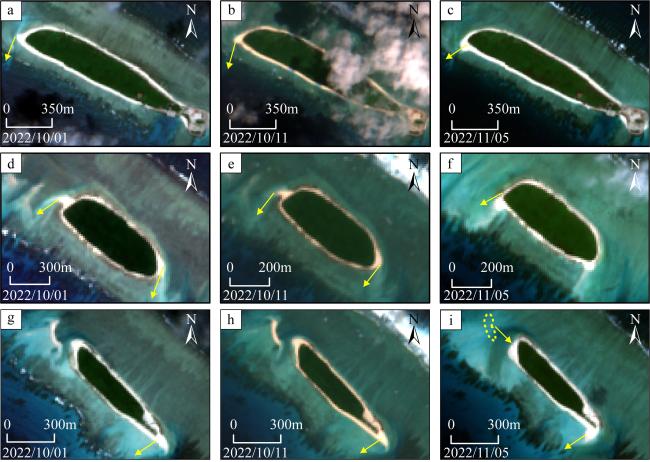
图9 Sentinel-2卫星影像上灰沙岛的典型变化a. 植被受损; b. ToB线移动; c. 植被线后退; d. 沙嘴旋转。图a中红圈区域显示为台风前后植被区状况对比 Fig. 9 Typical variations of lime-sand islands on Sentinel-2 satellite images |
表5 研究区岛屿受台风“奥鹿”影响后ToB线和植被边界线移动情况Tab. 5 The NSM of the ToB line and vegetation boundary of study islands after Typhoon Noru |
| 岛屿 | 分区 | 海滩基部线 | 植被边界线 | |||||||||||
|---|---|---|---|---|---|---|---|---|---|---|---|---|---|---|
| 平均/m | 最大/m | 最小/m | 向陆/% | 向海/% | 稳定/% | 平均/m | 最大/m | 最小/m | 后退/% | 扩张/% | 稳定/% | |||
| 背风面 | ||||||||||||||
| 北岛 | 北端 | -6.0 | 4.3 | -19.4 | 66.67 | 4.02 | 29.32 | -0.5 | 1.4 | -1.2 | 0.00 | 0.00 | 100.00 | |
| 向海区 | 1.9 | 7.8 | -3.8 | 1.90 | 31.49 | 66.61 | -3.4 | 1.9 | -9.0 | 73.65 | 0.00 | 26.35 | ||
| 南端 | -1.2 | 8.9 | -11.1 | 50.13 | 6.62 | 43.26 | -2.7 | 0.1 | -5.7 | 64.71 | 0.00 | 35.29 | ||
| 中岛 | 北端 | -0.7 | 2.4 | 0.0 | 0.00 | 0.00 | 100.00 | 0.6 | 1.3 | -0.1 | 0.00 | 0.00 | 100.00 | |
| 向海区 | 1.3 | 6.9 | -6.3 | 5.44 | 29.23 | 65.33 | -0.2 | 0.5 | -1.5 | 0.00 | 0.00 | 100.00 | ||
| 南端 | 1.6 | 5.7 | 0.1 | 0.00 | 25.87 | 74.13 | 0.3 | 1.9 | -1.1 | 0.00 | 9.09 | 90.91 | ||
| 南岛 | 北端 | 2.9 | 13.0 | -5.1 | 13.18 | 51.94 | 41.09 | 0.1 | 3.3 | -4.5 | 9.33 | 6.67 | 84.00 | |
| 向海区 | 5.7 | 9.2 | -4.8 | 0.44 | 73.57 | 25.84 | -0.8 | 0.2 | -4.2 | 18.66 | 0.00 | 81.34 | ||
| 南端 | 8.6 | 14.2 | -5.9 | 13.14 | 77.14 | 9.71 | -2.6 | -0.4 | -5.6 | 60.42 | 0.00 | 39.58 | ||
| 迎风面 | ||||||||||||||
| 北岛 | 北端 | -3.4 | 11.2 | -15.9 | 64.69 | 18.53 | 16.78 | 0.3 | 4.0 | -0.1 | 0.00 | 8.79 | 91.21 | |
| 向海区 | 1.1 | 7.9 | -7.4 | 8.13 | 12.54 | 79.33 | 1.4 | 6.1 | -0.1 | 0.00 | 37.30 | 62.70 | ||
| 南端 | 0.7 | 6.6 | -4.1 | 12.08 | 14.33 | 73.60 | 2.5 | 5.5 | -3.5 | 13.58 | 44.44 | 41.98 | ||
| 中岛 | 北端 | -0.4 | 0.0 | -4.1 | 8.74 | 0.00 | 91.26 | -0.4 | 0.1 | -4.1 | 6.56 | 0.00 | 93.44 | |
| 向海区 | 2.2 | 8.5 | -0.1 | 0.00 | 42.86 | 57.14 | -1.6 | 0.1 | -4.7 | 24.53 | 0.00 | 75.47 | ||
| 南端 | 1.4 | 4.0 | -0.1 | 0.00 | 18.99 | 81.01 | -1.6 | 1.2 | -2.0 | 74.68 | 0.00 | 25.32 | ||
| 南岛 | 北端 | 6.5 | 12.7 | 3.2 | 0.00 | 100.00 | 0.00 | 1.8 | 3.9 | 0.1 | 0.00 | 54.88 | 45.12 | |
| 向海区 | 4.3 | 5.4 | -0.8 | 0.00 | 82.68 | 17.32 | -1.3 | 0.4 | -3.6 | 36.19 | 0.00 | 63.81 | ||
| 南端 | 5.0 | 8.6 | -0.4 | 0.00 | 72.73 | 27.27 | -1.7 | 0.1 | -3.0 | 54.84 | 0.00 | 45.16 | ||
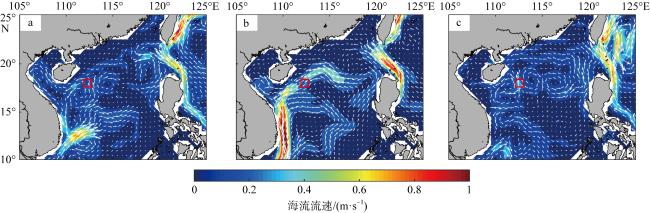
图11 台风过境期间南海海域30m以浅平均海流流速(色柱)及流向(箭头)a. 台风“杜苏芮”, 日期为2017/09/15; b. 台风“环高”, 日期为2020/11/13; c. 台风“奥鹿”, 日期为2022/09/24。红色方框表示七连屿所在位置。基于自然资源部标准地图服务网站下载的审图号为GS(2019)3266号标准地图制作, 底图无修改 Fig. 11 Mean speed and direction of currents in the South China Sea at depths of 30 m during the passage of typhoons. (a) Typhoon Doksuri; (b) Typhoon Vamco; (c) Typhoon Noru. Red box indicates the location of Qilianyu |
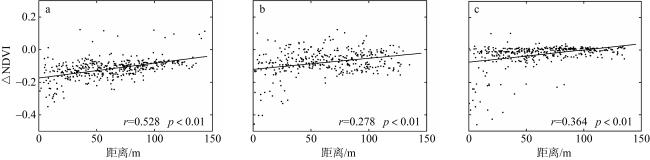
图12 研究区岛屿植被受损程度与距植被边界线远近的相关性分析(黑色直线表示线性趋势)a. 台风“杜苏芮”, 日期为2017/09/15; b. 台风“环高”, 日期为2020/11/13; c. 台风“奥鹿”, 日期为2022/09/24 Fig. 12 Correlation analysis between the stress degree of islands vegetation and distance from the vegetation boundary (the solid black lines indicate the linear trend) a. Typhoon Dujuan, with a date of September 15, 2017; b. Typhoon "Huan Gao", with a date of November 13, 2020; c. Typhoon "Aolu", with a date of September 24, 2022 |
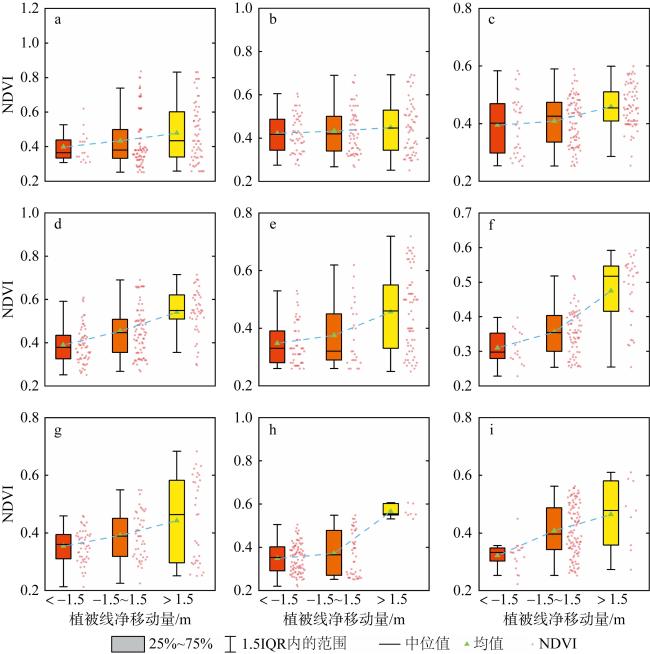
图13 台风“杜苏芮”(a, d, g)、“环高”(b, e, h)和“奥鹿”(c, f, i)发生前灰沙岛沿岸植被NDVI与台风后植被边界线净移动量的关系a—c: 北岛; d—f: 中岛; g—i: 南岛。 Fig. 13 Relationship between the NDVI of coastal vegetation before Typhoons Doksuri (a, d, g), Vamco (b, e, h) and Noru (c, f, i) and the NSM of vegetation boundary after the typhoons. (a—c) BeiDao island; (d—f) ZhongDao island; (g—i) NanDao island |
| [1] |
包为民, 沈丹丹, 倪鹏, 等, 2018. 滑动平均差检测法的提出及验证[J]. 地理学报, 73(11): 2075-2085.
|
| [2] |
陈雪霏, 邓文峰, 韦刚健, 2023. 工业革命以来南海珊瑚钙化生长对海洋升温的响应[J]. 第四纪研究, 43(2): 448-457.
|
| [3] |
陈依妮, 2022. 基于WAVEWATCH Ⅲ的近岛礁波浪数值模拟[D]. 大连: 大连理工大学.
|
| [4] |
杜建会, 陈嘉健, 李升发, 2024. 台风干扰下海岸森林受损及灾后恢复的影响因素研究进展[J]. 生态学报, 44(1): 1-17.
|
| [5] |
海南省自然资源和规划厅, (2023-07-19)[2024-05-27]. 2022年海南省海洋灾害公报[EB/OL]. 海口: 海南省自然资源和规划厅: 5-6. https://lr.hainan.gov.cn/xxgk_317/0200/0202/202307/t20230720_3458144.html (in Chinese).
|
| [6] |
洪小帆, 2021. 基于Ecopath模型的西沙群岛七连屿珊瑚礁礁栖性生物的生态承载力研究[D]. 上海: 上海海洋大学.
|
| [7] |
黄荣永, 余克服, 王英辉, 等, 2019. 珊瑚礁遥感研究进展[J]. 遥感学报, 23(6): 1091-1112.
|
| [8] |
柯佩辉, 黄企洲, 陈福培, 等, 1987. 南海北部陆架边缘海台风下海流的一个初步分析[J]. 大气科学, 11(4): 441-445.
|
| [9] |
李晓敏, 2021. 南海西沙群岛珊瑚岛礁高分遥感监测与动态研究[D]. 呼和浩特: 内蒙古大学.
|
| [10] |
李晓敏, 马毅, 张杰, 等, 2022. 基于高分遥感的西沙群岛珊瑚礁沙洲稳定性评估[J]. 海洋环境科学, 41(1): 48-58.
|
| [11] |
梁鹏飞, 2022. 近岛礁区域波浪在海流作用下演化规律研究[D]. 大连: 大连理工大学.
|
| [12] |
刘达, 许映龙, 2022. 2022年9月大气环流和天气分析[J]. 气象, 48(12): 1629-1636.
|
| [13] |
刘嘉鎏, 2020. 南海珊瑚岛、礁对近40年气候变暖响应的遥感影像记录[D]. 南宁: 广西大学.
|
| [14] |
陆俊, 2022. 西北太平洋热带气旋移动与强度的年际变率和长期趋势研究[D]. 南京: 南京信息工程大学 (in Chinese).
|
| [15] |
马潇潇, 王海兵, 左合君, 2019. 近54年内蒙古自治区西部沙尘暴的变化趋势[J]. 水土保持通报, 39(4): 17-21, 101.
|
| [16] |
欧阳宏达, 赵书河, 张新明, 2023. 基于多源遥感数据和EC-LUE模型的冬小麦产量估算[J]. 中国农业信息, 35(1): 27-42.
|
| [17] |
宋效东, 汤国安, 周毅, 等, 2013. 基于并行GVF Snake模型的黄土地貌沟沿线提取[J]. 中国矿业大学学报, 42(1): 134-140.
|
| [18] |
孙冲, 2018. 基于支持向量机的遥感影像道路提取[D]. 长春: 吉林大学.
|
| [19] |
孙晓慧, 史建康, 李新武, 等, 2021. 西沙群岛精细植被分布的遥感制图及动态变化[J]. 遥感学报, 25(7): 1473-1488.
|
| [20] |
王峰萍, 王卫星, 薛柏玉, 等, 2017. GVF Snake与显著特征相结合的高分辨率遥感图像道路提取[J]. 测绘学报, 46(12): 1978-1985.
|
| [21] |
汪路, 卢莹, 赵海坤, 2023. 台风灾害时空特征分析与评估模型构建[J]. 灾害学, 38(4): 187-194.
|
| [22] |
王宇喆, 邱隆伟, 许红, 等, 2021. 七连屿海滩沙-沿岸沙丘-现代植物-砂岛成因模式[J]. 海洋地质前沿, 37(6): 92-100.
|
| [23] |
王圆圆, 刘志刚, 李京, 等, 2007. 珊瑚礁遥感研究进展[J]. 地球科学进展, 22(4): 396-402.
|
| [24] |
吴迪, 杨鹏, 周黎勇, 等, 2023. 基于Sentinel-2破碎化地块灌区作物种植结构的提取[J]. 灌溉排水学报, 42(4): 74-80.
|
| [25] |
向怡衡, 沈铁元, 殷志远, 等, 2023. 清江流域近60 a日降水特征变化分析[J]. 武汉大学学报(工学版), 56(3): 264-273.
|
| [26] |
谢雨涵, 史建康, 孙晓慧, 等, 2022. 基于大疆精灵4无人机多光谱影像的西沙植被监测[J]. 遥感技术与应用, 37(5): 1170-1178.
|
| [27] |
熊媛, 黄荣永, 余克服, 2022. 基于多时相多光谱遥感影像的珊瑚礁面积估算方法研究——以西沙群岛羚羊礁为例[J]. 海洋学报, 44(8): 151-168.
|
| [28] |
姚杰鹏, 杨磊库, 陈探, 等, 2021. 基于Sentinel-1, 2和Landsat 8时序影像的鄱阳湖湿地连续变化监测研究[J]. 遥感技术与应用, 36(4): 760-776.
|
| [29] |
张骞, 廖光洪, 蔺飞龙, 等, 2019. 南海西北部上层海洋对台风“杜苏芮”的响应分析[J]. 海洋学报, 41(7): 22-35.
|
| [30] |
张展, 2022. 各地旱情备受关注[J]. 现代职业安全, (10): 9 (in Chinese).
|
| [31] |
周园园, 师长兴, 范小黎, 等, 2011. 国内水文序列变异点分析方法及在各流域应用研究进展[J]. 地理科学进展, 30(11): 1361-1369.
|
| [32] |
周旻曦, 刘永学, 李满春, 等, 2015. 多目标珊瑚岛礁地貌遥感信息提取方法——以西沙永乐环礁为例[J]. 地理研究, 34(4): 677-690.
|
| [33] |
|
| [34] |
|
| [35] |
|
| [36] |
|
| [37] |
|
| [38] |
|
| [39] |
|
| [40] |
|
| [41] |
|
| [42] |
|
| [43] |
|
| [44] |
|
| [45] |
|
| [46] |
|
| [47] |
|
| [48] |
|
| [49] |
|
| [50] |
|
| [51] |
|
| [52] |
|
| [53] |
|
| [54] |
|
| [55] |
|
| [56] |
|
| [57] |
IPCC, 2022. Weather and climate extreme events in a changing climate[C]// Climate change 2021:the physical science basis. Contribution of working group Ⅰ to the sixth assessment report of the Intergovernmental Panel on Climate Change. Cambridge: Cambridge University Press: 1513-1766.
|
| [58] |
|
| [59] |
|
| [60] |
|
| [61] |
|
| [62] |
|
| [63] |
|
| [64] |
|
| [65] |
|
| [66] |
|
| [67] |
|
| [68] |
|
| [69] |
|
| [70] |
|
| [71] |
|
| [72] |
|
| [73] |
|
| [74] |
|
| [75] |
|
| [76] |
|
| [77] |
|
| [78] |
|
| [79] |
|
| [80] |
|
| [81] |
|
/
| 〈 |
|
〉 |


