
基于精细温度观测的南海东北部陆坡-深海盆底层湍流混合*
|
李杨(1996—), 女, 江苏省东台市人, 硕士, 从事深海动力学研究。email: |
Copy editor: 姚衍桃
收稿日期: 2021-02-05
修回日期: 2021-04-13
网络出版日期: 2021-04-16
基金资助
国家自然科学基金项目(91952106)
国家自然科学基金项目(41776033)
国家自然科学基金项目(42006196)
广州市科技计划项目(201904010312)
广州市科技计划项目(201804020056)
Bottom turbulent mixing of continental slope - deep sea basin in northeastern South China Sea based on high-resolution temperature observation
Copy editor: YAO Yantao
Received date: 2021-02-05
Revised date: 2021-04-13
Online published: 2021-04-16
Supported by
National Natural Science Foundation of China(91952106)
National Natural Science Foundation of China(41776033)
National Natural Science Foundation of China(42006196)
Science and Technology Foundation of Guangzhou(201904010312)
Science and Technology Foundation of Guangzhou(201804020056)
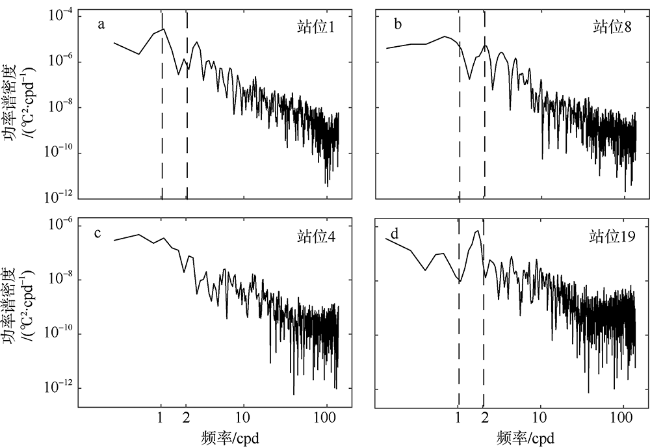
南海是存在强湍流混合的边缘海之一, 但前人对南海湍流混合的研究更多关注的是中上层, 对底层则鲜有关注。本文基于高分辨率温度传感器于2019年5月在南海东北部22个站位海底上方0.5m处持续观测4.4d的温度数据, 分析了2216~3200m深度范围内底层海水温度的时间变化特征, 并探讨了地形粗糙度和内潮对底层湍流混合的影响。分析结果表明, 南海东北部各站位底层海水的温度变化量级约为10-4~10-3℃; 温度变化趋势与正压潮变化趋势不同, 温度能谱显示多数站位在全日和半日频带区间出现谱峰, 温度变化更多地受斜压潮影响, 全日、半日内潮起主要调制作用。陆坡-深海盆过渡区及深海盆底层的湍动能耗散率量级为10-10~10-9m2∙s-3, 涡扩散系数量级为10-4~10-3m2∙s-1。观测数据未能显示底层湍流混合与地形粗糙度存在明显的相关性。底层湍流混合的空间分布与过去观测到的南海北部深海盆内潮的南北不对称性分布一致。
李杨 , 黄鹏起 , 鲁远征 , 屈玲 , 郭双喜 , 岑显荣 , 周生启 , 张佳政 , 丘学林 . 基于精细温度观测的南海东北部陆坡-深海盆底层湍流混合*[J]. 热带海洋学报, 2022 , 41(1) : 62 -74 . DOI: 10.11978/2021015
The South China Sea (SCS) is one of the marginal seas with strong turbulent mixing. More attention was paid on turbulent mixing in the upper and middle layers than that in the bottom layer in previous studies of the SCS. Based on the temperature data obtained in the northeastern SCS with high-resolution records at 0.5 m above the seafloor at 22 stations for about 4.4 days in May 2019, we analyzed the time variation characteristics of bottom-water temperature with ocean depth varying from 2216 to 3200 m, and discuss the influence of topographic roughness and internal tides on bottom turbulent mixing. The analysis results show that the bottom temperature fluctuation at each station is 10-4~10-3℃, the trend of temperature variation is different from that of barotropic tide elevation, the temperature variation is affected by baroclinic process, mainly modulated by the diurnal and semi-diurnal tides at most stations. The magnitude of the turbulent kinetic energy dissipation rate at the bottom of the continental slope-deep basin transition zone and the deep basin is 10-10~10-9m2∙s-3, and turbulent diffusivity is 10-4~10-3 m2∙s-1. The results, however, cannot reveal the significant positive correlation between the intensity of bottom turbulence mixing and topographic roughness. The spatial distribution of bottom turbulent dissipation is in accord with the north-south asymmetry of internal tides in the deep basin west of the Luzon Strait.
表1 各测站详细信息Tab. 1 Detailed information of each station |
| 站位 | 东经 | 北纬 | 深度 /m | 测试 时长/d | 地形粗 糙度/m2 | 温度梯度 /(℃∙m-1) | 浮力频率 /(rad∙s-1) | 底混合层厚度1/m | 底混合层厚度2/m | 湍动能耗散率中值/(m2∙s-3) | 涡扩散系数中值/(m2∙s-1) | ||||
|---|---|---|---|---|---|---|---|---|---|---|---|---|---|---|---|
| 1 | 118°43′12″ | 19°40′48″ | 3201 | 3.24 | 6390 | 5.36×10⁻⁵ | 2.67×10⁻⁴ | 4 | 8 | 2.80×10⁻⁹ | 7.90×10⁻³ | ||||
| 2-1 | 118°43′48″ | 19°46′48″ | 3172 | 3.32 | 236 | 5.59×10⁻⁵ | 2.74×10⁻⁴ | 8 | 45 | 2.93×10⁻¹⁰ | 7.82×10⁻⁴ | ||||
| 2-2 | 118°43′48″ | 19°46′48″ | 3172 | 3.32 | 236 | 5.59×10⁻⁵ | 2.74×10⁻⁴ | 8 | 40 | 6.99×10⁻¹⁰ | 1.90×10⁻³ | ||||
| 3 | 118°45′0″ | 19°53′24″ | 3173 | 3.39 | 277 | 5.58×10⁻⁵ | 2.73×10⁻⁴ | 68 | 68 | 1.89×10⁻¹⁰ | 5.04×10⁻⁴ | ||||
| 4 | 118°45′36″ | 20°0′0″ | 3085 | 3.47 | 4970 | 6.33×10⁻⁵ | 2.95×10⁻⁴ | 63 | 40 | 1.80×10⁻¹⁰ | 4.14×10⁻⁴ | ||||
| 5-1 | 118°48′0″ | 20°12′36″ | 2801 | 3.62 | 653 | 9.55×10⁻⁵ | 3.79×10⁻⁴ | 151 | 21 | 1.96×10⁻¹⁰ | 2.72×10⁻⁴ | ||||
| 5-2 | 118°48′0″ | 20°12′36″ | 2801 | 3.62 | 653 | 9.55×10⁻⁵ | 3.79×10⁻⁴ | 151 | 21 | 4.55×10⁻¹⁰ | 6.32×10⁻⁴ | ||||
| 6 | 118°48′36″ | 20°19′12″ | 2725 | 3.69 | 1910 | 1.07×10⁻⁴ | 4.06×10⁻⁴ | 85 | 35 | 1.88×10⁻¹⁰ | 2.29×10⁻⁴ | ||||
| 7-1 | 118°49′48″ | 20°25′12″ | 2659 | 3.78 | 736 | 1.17×10⁻⁴ | 4.30×10⁻⁴ | 6 | 53 | 2.10×10⁻¹⁰ | 2.27×10⁻⁴ | ||||
| 7-2 | 118°49′48″ | 20°25′12″ | 2659 | 3.78 | 736 | 1.17×10⁻⁴ | 4.30×10⁻⁴ | 6 | 60 | 2.76×10⁻¹⁰ | 2.99×10⁻⁴ | ||||
| 8 | 118°51′36″ | 20°38′24″ | 2591 | 4.04 | 105 | 1.29×10⁻⁴ | 4.57×10⁻⁴ | 4 | 91 | 1.58×10⁻⁹ | 1.50×10⁻³ | ||||
| 9-1 | 118°52′48″ | 20°44′24″ | 2636 | 4.11 | 2150 | 1.21×10⁻⁴ | 4.39×10⁻⁴ | 8 | 30 | 5.36×10⁻¹⁰ | 5.57×10⁻⁴ | ||||
| 9-2 | 118°52′48″ | 20°44′24″ | 2636 | 4.11 | 2150 | 1.21×10⁻⁴ | 4.39×10⁻⁴ | 8 | 25 | 5.69×10⁻¹⁰ | 5.91×10⁻⁴ | ||||
| 10 | 118°53′24″ | 20°51′0″ | 2677 | 4.18 | 2260 | 1.14×10⁻⁴ | 4.23×10⁻⁴ | 27 | 40 | 2.86×10⁻¹⁰ | 3.19×10⁻⁴ | ||||
| 11-1 | 118°54′36″ | 20°57′36″ | 2706 | 4.26 | 100 | 1.10×10⁻⁴ | 4.13×10⁻⁴ | 29 | 30 | 3.95×10⁻¹⁰ | 4.64×10⁻⁴ | ||||
| 11-2 | 118°54′36″ | 20°57′36″ | 2706 | 4.26 | 100 | 1.10×10⁻⁴ | 4.13×10⁻⁴ | 30 | 35 | 3.88×10⁻¹⁰ | 4.56×10⁻⁴ | ||||
| 12 | 118°55′12″ | 21°4′12″ | 2735 | 4.33 | 392 | 1.05×10⁻⁴ | 4.02×10⁻⁴ | 30 | 80 | 5.32×10⁻¹⁰ | 6.58×10⁻⁴ | ||||
| 13-1 | 118°55′48″ | 21°6′36″ | 2752 | 4.38 | 62 | 1.02×10⁻⁴ | 3.96×10⁻⁴ | 32 | 69 | 1.90×10⁻¹⁰ | 2.42×10⁻⁴ | ||||
| 13-2 | 118°55′48″ | 21°6′36″ | 2752 | 4.38 | 62 | 1.02×10⁻⁴ | 3.96×10⁻⁴ | 32 | 70 | 3.18×10⁻¹⁰ | 4.06×10⁻⁴ | ||||
| 14-1 | 118°56′24″ | 21°9′0″ | 2775 | 5.53 | 624 | 9.92×10⁻⁵ | 3.88×10⁻⁴ | 25 | 75 | 5.68×10⁻¹⁰ | 7.54×10⁻⁴ | ||||
| 14-2 | 118°56′24″ | 21°9′0″ | 2775 | 5.53 | 624 | 9.92×10⁻⁵ | 3.88×10⁻⁴ | 40 | 75 | 7.47×10⁻¹⁰ | 9.91×10⁻⁴ | ||||
| 15 | 118°57′0″ | 21°14′24″ | 2831 | 4.52 | 99 | 9.15×10⁻⁵ | 3.70×10⁻⁴ | 80 | 41 | 2.64×10⁻¹⁰ | 3.87×10⁻⁴ | ||||
| 16 | 118°58′12″ | 21°19′48″ | 2847 | 4.65 | 1010 | 8.94×10⁻⁵ | 3.64×10⁻⁴ | 37 | 0 | 6.81×10⁻¹⁰ | 1.00×10⁻³ | ||||
| 17 | 118°58′12″ | 21°22′48″ | 2818 | 4.69 | 3480 | 9.32×10⁻⁵ | 3.74×10⁻⁴ | 78 | 53 | 1.27×10⁻¹⁰ | 1.84×10⁻⁴ | ||||
| 18 | 118°59′24″ | 21°30′36″ | 2666 | 5.17 | 800 | 1.16×10⁻⁴ | 4.27×10⁻⁴ | 10 | 70 | 2.99×10⁻¹⁰ | 3.27×10⁻⁴ | ||||
| 19-1 | 119°0′0″ | 21°33′0″ | 2613 | 5.21 | 1000 | 1.25×10⁻⁴ | 4.48×10⁻⁴ | 80 | 58 | 4.98×10⁻¹⁰ | 4.97×10⁻⁴ | ||||
| 19-2 | 119°0′0″ | 21°33′0″ | 2613 | 5.21 | 1000 | 1.25×10⁻⁴ | 4.48×10⁻⁴ | 93 | 58 | 1.82×10⁻¹⁰ | 1.81×10⁻⁴ | ||||
| 20-1 | 119°0′36″ | 21°36′0″ | 2556 | 5.53 | 1010 | 1.36×10⁻⁴ | 4.71×10⁻⁴ | 41 | 48 | 2.01×10⁻¹⁰ | 1.82×10⁻⁴ | ||||
| 20-2 | 119°0′36″ | 21°36′0″ | 2556 | 5.53 | 1010 | 1.36×10⁻⁴ | 4.71×10⁻⁴ | 41 | 48 | 2.40×10⁻¹⁰ | 2.16×10⁻⁴ | ||||
| 21-1 | 119°1′12″ | 21°42′36″ | 2403 | 5.32 | 643 | 1.70×10⁻⁴ | 5.39×10⁻⁴ | 4 | 35 | 6.87×10⁻¹⁰ | 4.74×10⁻⁴ | ||||
| 21-2 | 119°1′12″ | 21°42′36″ | 2403 | 5.32 | 643 | 1.70×10⁻⁴ | 5.39×10⁻⁴ | 6 | 42 | 6.63×10⁻¹⁰ | 4.57×10⁻⁴ | ||||
| 22-1 | 119°2′24″ | 21°48′36″ | 2216 | 5.39 | 359 | 2.22×10⁻⁴ | 6.35×10⁻⁴ | 15 | 12 | 9.23×10⁻¹⁰ | 4.57×10⁻⁴ | ||||
| 22-2 | 119°2′24″ | 21°48′36″ | 2216 | 5.39 | 359 | 2.22×10⁻⁴ | 6.35×10⁻⁴ | 15 | 12 | 8.89×10⁻¹⁰ | 4.40×10⁻⁴ | ||||
注: 底混合层厚度1、厚度2分别是下降和上升廓线的底混合层厚度 |
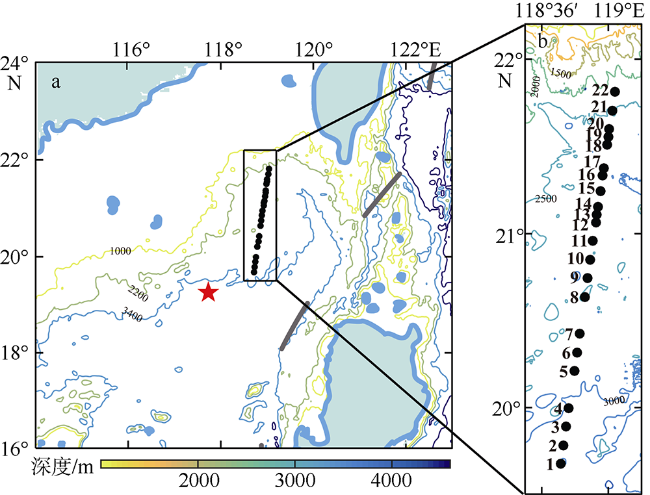
图1 研究区OBS和CTD站位示意图该图基于国家测绘地理信息局标准地图服务网站下载的审图号为GS(2016)1666号的标准地图制作; 图中黑色实心圆为2019年OBS测站, 红色五角星为2017年CTD站位 Fig. 1 (a) The location of the OBS and CTD stations; (b) Regional bathymetric map indicated by the solid rectangle in the left panel; black dots are the OBS stations in 2019, and red pentagram are the CTD station in 2017 |
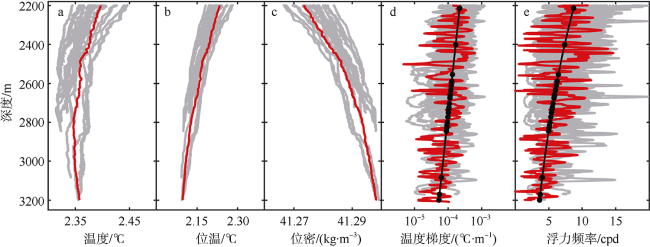
图2 温度传感器(灰)和CTD数据廓线(红)对比图a. 现场温度; b. 位势温度; c. 位势密度; d. 温度梯度; e. 浮力频率; 图d和e中的黑色线为拟合直线, 黑点代表背景值 Fig. 2 Comparison of vertical profiles obtained with the temperature loggers (gray) and historical CTD data (red): (a) in-situ temperature; (b) potential temperature; (c) potential density; (d) temperature gradient; (e) buoyancy frequency. The black dotted line in (d) and (e) is the fitting line |
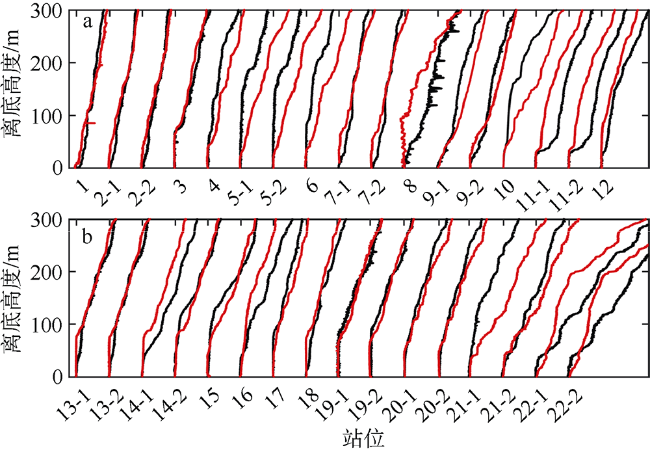
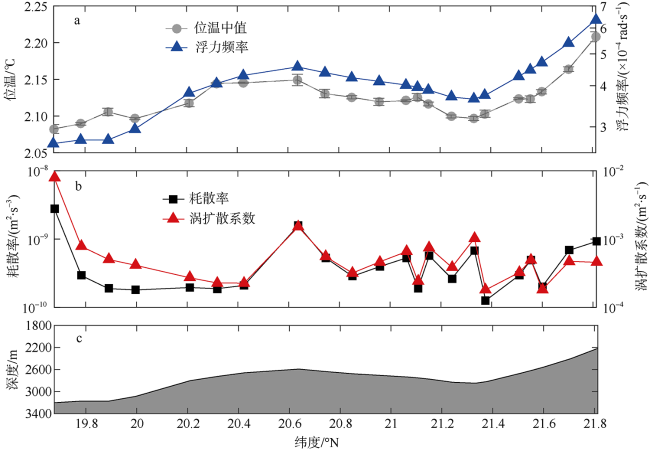
图5 各站位底层温度和湍流混合的空间分布a. 位温中值和浮力频率, 其中误差棒代表温度的标准差; b. 湍动能耗散率和涡扩散系数; c. 地形起伏 Fig. 5 Spatial distribution of turbulent mixing and bottom temperature at each station: (a) median value of potential temperature and buoyancy frequency, the error bar represents the standard deviation of temperature; (b) turbulent kinetic energy dissipation rate and turbulent diffusivity; (c) topographic relief |
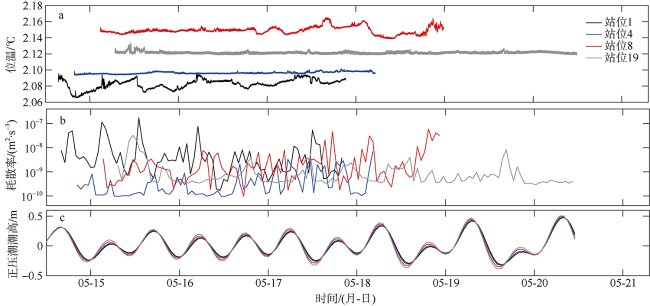
图10 2019年1(黑)、4(蓝)、8(红)和19(灰)号站位底层位温(a)、湍动能耗散率(b)和正压潮潮高时间序列(c)Fig. 10 Time series of bottom temperature at stations 1 (black), 4 (blue), 8 (red), and 19 (gray) in 2019: (a) bottom potential temperature; (b) turbulent kinetic energy dissipation rate; (c) barotropic tidal elevation predicted from TPXO 8.0 |
*感谢中国科学院南海海洋研究所科考船队工程技术中心和“实验2”号船对数据获取的帮助。
| [1] |
李敏, 2013. 基于Thorpe尺度对南海深层混合的研究[D]. 青岛: 中国海洋大学.
|
| [2] |
梁辉, 郑洁, 田纪伟, 2016. 南海西北陆坡区内潮与近惯性内波观测研究[J]. 海洋学报, 38(11): 32-42.
|
| [3] |
刘倩, 2016. 南海内潮的结构与变化[D]. 北京: 中国科学院大学.
|
| [4] |
尚晓东, 卢著敏, 谢晓辉, 等, 2010. 海洋湍流与海洋混合研究及其进展[C]// 第八届全国实验流体力学学术会议论文集. 广州: 中国力学学会: 1. (in Chinese)
|
| [5] |
|
| [6] |
谢皆烁, 2015. 水体层化及中尺度涡旋对南海北部内孤立波生成演化的影响[D]. 北京: 中国科学院大学.
|
| [7] |
张效谦, 2005. 南海北部陆架陆坡区内波与混合研究[D]. 青岛: 中国海洋大学.
|
| [8] |
赵斌, 刘胜旋, 李丽青, 等, 2018. 南海冷泉分布特征及油气地质意义[J]. 海洋地质前沿, 34(10): 32-43.
|
| [9] |
赵玖强, 张艳伟, 刘志飞, 等, 2019. 南海北部深海潮汐的季节性变化特征[J]. 中国科学 D辑: 地球科学, 49(4): 717-730.
|
| [10] |
|
| [11] |
|
| [12] |
|
| [13] |
|
| [14] |
|
| [15] |
|
| [16] |
|
| [17] |
|
| [18] |
|
| [19] |
|
| [20] |
|
| [21] |
|
| [22] |
|
| [23] |
|
| [24] |
|
| [25] |
|
| [26] |
|
| [27] |
|
| [28] |
|
| [29] |
|
| [30] |
|
| [31] |
|
| [32] |
|
| [33] |
|
| [34] |
|
| [35] |
|
| [36] |
|
| [37] |
|
| [38] |
|
| [39] |
|
| [40] |
|
| [41] |
|
| [42] |
|
| [43] |
|
| [44] |
|
| [45] |
|
| [46] |
|
| [47] |
|
| [48] |
|
| [49] |
|
| [50] |
|
| [51] |
|
| [52] |
|
| [53] |
|
| [54] |
|
| [55] |
|
| [56] |
|
/
| 〈 |
|
〉 |
