
濒临死亡哈德掌状藻沉降行为的时频特征
|
石天应(1999—), 女, 湖南省长沙市人, 硕士研究生, 从事海洋硅藻沉降研究。email: sty2303@163.com |
Copy editor: 林强
收稿日期: 2024-10-26
修回日期: 2024-12-04
网络出版日期: 2024-12-09
基金资助
广西自然科学基金(2025GXNSFAA069768)
Time-frequency characteristics of the sinking behavior in dying Palmeria hardmaniana
Copy editor: LIN Qiang
Received date: 2024-10-26
Revised date: 2024-12-04
Online published: 2024-12-09
Supported by
Guangxi Natural Science Foundation(2025GXNSFAA069768)
石天应 , 陆家昌 , 庄军莲 , 赖俊翔 , 李朗 . 濒临死亡哈德掌状藻沉降行为的时频特征[J]. 热带海洋学报, 2025 , 44(3) : 85 -94 . DOI: 10.11978/2024202
Palmeria hardmaniana, a common large planktonic diatom in coastal waters, shows sinking behavior in its living cells and actively regulates its own sinking rate, which is significantly different from the sinking process of its dead cells. Besides living and dead cells, the ocean also contains diatom cells that are in the process of dying due to environmental stress. The sinking behavior of these dying cells remains unclear. The subject of this study is the sinking behavior of P. hardmaniana on the brink of death obtained by heat treatment, with healthy cells in the exponential growth phase serving as the reference. To explore the characteristics of the sinking behavior of dying P. hardmaniana cells, this study tracked and recorded their sedimentation process using videography and employed continuous wavelet analysis to extract the time-frequency characteristics of their sinking behavior. The results show that the heat treatment severely damaged the photosynthetic system of the dying P. hardmaniana cells, leading to faster sedimentation velocities and longer sedimentation distances compared to the healthy cells. The sinking behaviors of both the dying and healthy P. hardmaniana cells fall within the frequency range below 400 mHz. There is a correlation between the behaviors of these two types of cells in the frequency range of 128~400 mHz, suggesting that this range may encompass the fundamental sinking behavior of P. hardmaniana. The sinking behavior of the dying cells is characterized by high-frequency, high-energy regulation, primarily occurring in the frequency range of 300~400 mHz. In contrast, the sinking behavior of the healthy cells is marked by low-frequency, low-energy regulation, predominantly observed between 100~350 mHz. In comparison to their healthy counterparts, the dying cells exhibited fewer active regulatory events and each regulatory event lasted for a shorter duration during the observation period.
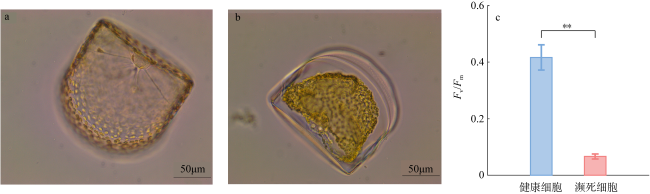
图3 哈德掌状藻濒死细胞和健康细胞的形态及Fv/Fm值a. 光镜下健康哈德掌状藻细胞环面观; b. 光镜下濒死哈德掌状藻细胞环面观; c. 哈德掌状藻细胞的Fv/Fm值(**表示差异极显著, P<0.01) Fig. 3 Morphology and Fv/Fm values of dying and healthy P. hardmaniana cells. (a) Girdle view of a healthy P. hardmaniana cell under a light microscope; (b) girdle view of a dying P. hardmaniana cell under a light microscope; (c) Fv/Fm values of the healthy and heat-treated P. hardmaniana cells (** indicates a highly significant difference, P<0.01) |
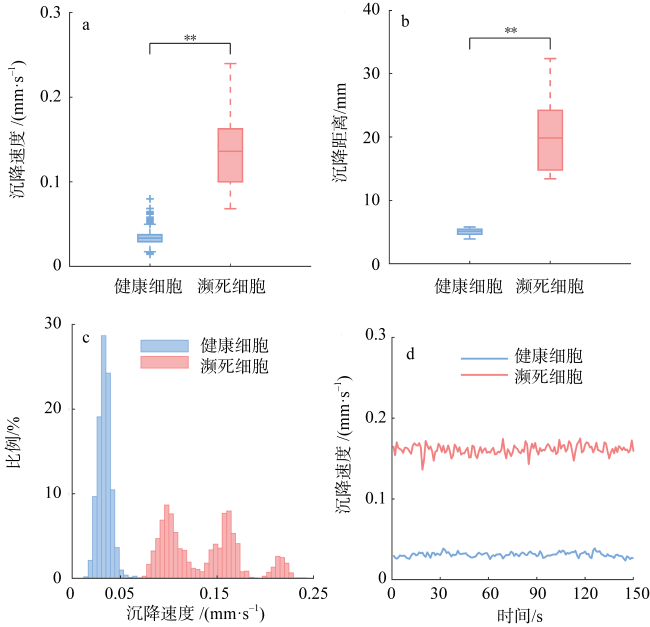
图4 150s观察时间内哈德掌状藻濒死组与健康组藻细胞沉降行为的时域特征a. 哈德掌状藻濒死组和健康组瞬时沉降速度的箱线图(10个细胞); b. 150s内哈德掌状藻濒死组和健康组沉降距离的箱线图(10个细胞); c. 150s沉降过程中哈德掌状藻濒死组与健康组所有被观察细胞的瞬时沉降速度的分布情况; d. 哈德掌状藻某濒死细胞与某健康细胞瞬时沉降速度随时间变化的曲线图 Fig. 4 Temporal and frequency characteristics of the sinking behavior of P. hardmaniana cells between the dying and healthy groups during the 150 seconds of observation time. (a) Box plot of the instantaneous sinking speed of P. hardmaniana cells in the dying and healthy groups (10 cells); (b) box plot of sinking distances of P. hardmaniana cells in the dying and healthy groups within 150 seconds (10 cells); (c) distribution of instantaneous sinking speed of all observed cells in the dying and healthy groups during the 150 seconds of sedimentation process; (d) curve showing the variations of instantaneous sinking speed over time for a dying cell and a healthy cell of P. hardmaniana |
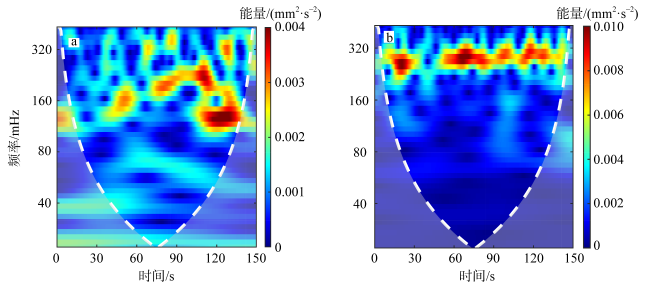
图5 哈德掌状藻濒死细胞(b)与健康细胞(a)小波功率谱示例图白色虚线表示影响锥, 虚线外区域受边缘效应影响, 信号特征的准确性受到影响 Fig. 5 Sample graph of wavelet power spectra for a dying (b) and healthy (a) P. hardmaniana cell. The white dashed line represents the cone of influence (COI) and the area outside of it is subject to edge effects and the accuracy of signal characteristics may be affected |
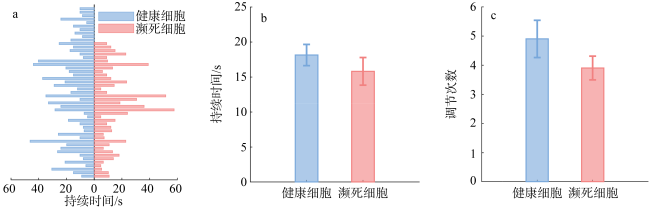
图6 濒死和健康哈德掌状藻细胞沉降过程中行为调节次数及持续时间的统计a. 所有观察的濒死和健康细胞的所有主动调节行为的持续时间; b. 濒死细胞和健康细胞调节持续时间柱状图(t-test, P>0.05); c. 濒死细胞和健康细胞平均调节次数柱状图(t-test, P>0.05)。数据由10个濒死细胞和10个健康细胞的小波功率谱统计获得 Fig. 6 The number of behavioral regulation events and their duration during the sinking process of dying and healthy P. hardmaniana cells (Data obtained from the wavelet power spectrum statistics of 10 dying cells and 10 healthy cells). (a) Duration of all observed active regulation behaviors in both dying and healthy cells; (b) column for the regulation duration of dying and healthy cells; (c) column for the mean regulation frequency of dying and healthy cells |
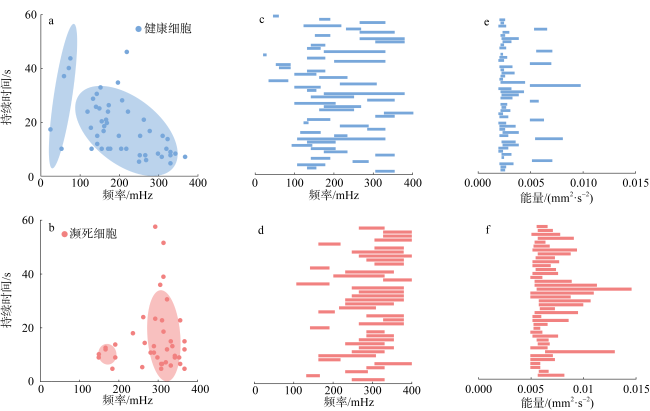
图7 濒死和健康哈德掌状藻细胞沉降过程中行为调节的频率与能量a和b分别是10个健康细胞和10个濒死细胞沉降调节行为持续时间与其对应频率中值的散点图; c和d分别是10个健康细胞和10个濒死细胞所有沉降调节行为的频率(mHz)范围; e和f分别是10个健康细胞和10个濒死细胞所有沉降调节行为的能量范围。数据由10个濒死细胞和10个健康细胞的小波功率谱统计获得 Fig. 7 The frequency and power of behavioral regulation during the sinking process of dying and healthy P. hardmaniana cells (Data obtained from the wavelet power spectrum statistics of 10 dying cells and 10 healthy cells). The plots in (a) and (b) representing the duration of sinking regulation and its corresponding median frequency for 10 healthy cells and 10 dying cells, respectively; (c) and (d) showing the range of frequencies (mHz) for all sinking regulation of 10 healthy cells and 10 dying cells, respectively; (e) and (f) presenting the range of power (mm2·s-2) for all sinking regulation of 10 healthy cells and 10 dying cells, respectively. |
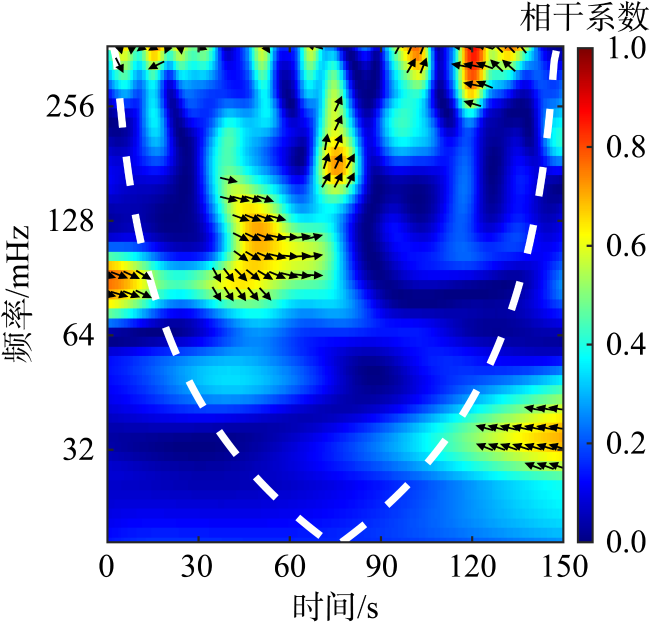
图8 哈德掌状藻濒死细胞与健康细胞沉降行为小波相干谱示例图箭头向右表示两组信号为正相干, 向左表示负相干, 其余的表示存在超前或者之后的相位差 Fig. 8 Sample graph of wavelet coherence spectrum of sinking behavior in dying and healthy P. hardmaniana cells |
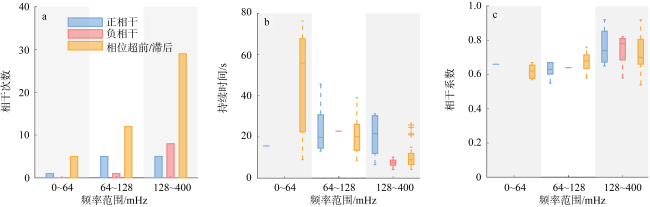
图9 10组不重复的随机配对的濒死和健康细胞沉降行为的小波相干谱图统计a. 不同频率内正相干、负相干和超前/滞后性的统计; b. 不同频率范围内正相干、负相干和超前/滞后性的持续时间; c. 不同频率内正相干、负相干和超前/滞后性的相干系数 Fig. 9 Statistics of wavelet coherence spectra for the sinking behavior of 10 non-repeating random pairs of dying and healthy cells. (a) The statistics of each in-phase, anti-phase and out-of-phase situation at different frequencies; (b) the duration of each in-phase, anti-phase and out-of-phase situation across different frequency ranges; (c) the coherence values of each in-phase, anti-phase and out-of-phase situation at different frequencies |
| [1] |
高亚辉, 虞秋波, 齐雨藻, 等, 2003. 长江口附近海域春季浮游硅藻的种类组成和生态分布[J]. 应用生态学报, 14(7): 1044-1048.
|
| [2] |
孙军, 李晓倩, 陈建芳, 等, 2016. 海洋生物泵研究进展[J]. 海洋学报, 38(4): 1-21.
|
| [3] |
魏静, 林莉, 潘雄, 等, 2020. 不同环境胁迫因子对藻类分子生物学特性的影响研究进展[J]. 长江科学院院报, 37(4): 14-24.
|
| [4] |
谢文玲, 康燕玉, 高亚辉, 2006. 硅藻休眠孢子生活史的研究进展[J]. 海洋科学, 30(9): 75-78.
|
| [5] |
张萍, 陆家昌, 李朗, 等, 2023. 硅壳和细胞内含物对硅藻沉降速率的影响[J]. 海洋环境科学, 42(6): 927-934.
|
| [6] |
|
| [7] |
|
| [8] |
|
| [9] |
|
| [10] |
|
| [11] |
|
| [12] |
|
| [13] |
|
| [14] |
|
| [15] |
|
| [16] |
|
| [17] |
|
| [18] |
|
| [19] |
|
| [20] |
|
| [21] |
|
| [22] |
|
| [23] |
|
| [24] |
|
| [25] |
|
| [26] |
|
| [27] |
|
| [28] |
|
| [29] |
|
| [30] |
|
| [31] |
|
| [32] |
|
| [33] |
|
| [34] |
|
| [35] |
|
| [36] |
|
| [37] |
|
| [38] |
|
| [39] |
|
| [40] |
|
| [41] |
|
| [42] |
|
| [43] |
|
/
| 〈 |
|
〉 |

