
南海南部珊瑚骨骼δ18O和Sr/Ca对ENSO的分级响应
|
李若安(2001—), 女, 广东省江门市人, 硕士研究生, 主要从事气候变化研究。email: 2023022746@m.scnu.edu.cn |
Copy editor: 孙翠慈
收稿日期: 2024-10-29
修回日期: 2024-11-23
网络出版日期: 2024-12-12
基金资助
科技基础资源调查专项(2022FY100601)
国家自然科学基金项目(42076065)
Graded responses of coral skeletal δ18O and Sr/Ca to ENSO in the southern South China Sea
Received date: 2024-10-29
Revised date: 2024-11-23
Online published: 2024-12-12
Supported by
Special Foundation for National Science and Technology Basic Research Program of China(2022FY100601)
National Natural Science Foundation of China(42076065)
李若安 , 李旭清 , 陈天然 . 南海南部珊瑚骨骼δ18O和Sr/Ca对ENSO的分级响应[J]. 热带海洋学报, 2025 , 44(4) : 45 -55 . DOI: 10.11978/2024203
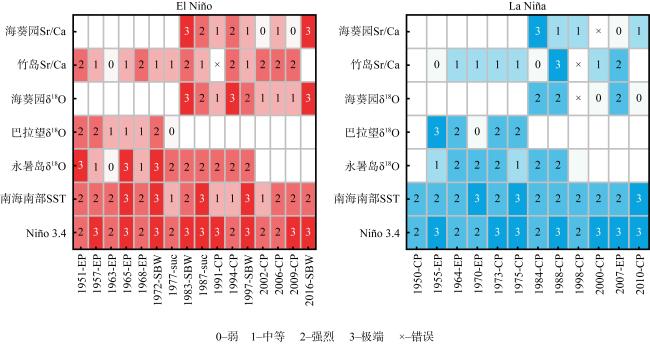
Understanding the differential responses of coral geochemical proxies to El Niño-Southern Oscillation (ENSO) events of various intensities and types is crucial for reconstructing pre-instrumental ENSO variability. This study extracts sea surface temperature (SST) data from the southern South China Sea (SCS) since 1950, along with published coral skeletal δ18O and Sr/Ca time series from four locations (from west to east: Hòn Tre Island, Yongshu Island, Anemone’s Garden, and Palawan Island). Employing methods such as frequency-domain analysis and lag correlation analysis, we investigate the responses of SST and coral geochemical proxies in the southern South China Sea to different types and grades of ENSO events. The results indicate that the accuracy of coral geochemical proxies in classifying EP (east Pacific)-El Niño and CP (central Pacific)-El Niño events increases from east to west, whereas the classification accuracy for SBW (strong basin-wide)-El Niño events gradually decreases from east to west. Similarly, for CP-La Niña events, the classification accuracy of coral geochemical proxy improves progressively from east to west, while the opposite trend is observed for EP-La Niña events. Overall, the classification capability of coral geochemical proxies in the southern SCS is weaker for EP-El Niño and CP-La Niña events compared to SBW-El Niño and EP-La Niña events, with better performance in classifying strong ENSO events than extreme ENSO events.
Key words: southern South China Sea; ENSO; coral; Sr/Ca; δ18O; graded response
表1 珊瑚地球化学指标的数据来源Tab. 1 Data sources for coral geochemical indicators |
| 参考文献 | 采样地点 | 经纬度 | 样品年代 | 地球化学指标 | 分辨率 |
|---|---|---|---|---|---|
| Goodkin et al, 2021 | 竹岛(Hòn Tre Island) | 12°12′N, 109°18′E | 1950年1月—2010年10月 | Sr/Ca | 月 |
| Yu et al, 2001 | 永暑岛(Yongshu Island) | 9°33′N, 112°54′E | 1951年1月—1999年4月 | δ18O | 季节、月 |
| Wu et al, 2020 | 巴拉望岛(Palawan Island) | 11°28′N, 119°01′E | 1947年1月—1981年1月 | δ18O | 半年至双月 |
| Krawczyk et al, 2020 | 海葵园(Anemone’s Garden) | 4°17′N, 113°49′E | 1982年1月—2016年1月 | δ18O、Sr/Ca | 月 |
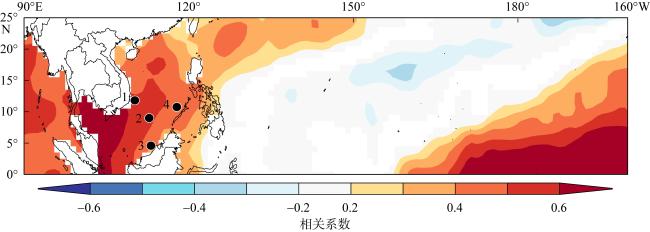
图1 南海SST(滞后4个月)和Niño3.4的空间相关性本图由在线工具Climate Explorer创建(Trouet et al, 2013)。其中, 南海南部SST与Niño3.4呈显著正相关(P<0.1)。SST数据来自1950至2020年的月度分辨率HadISST(Hadley Centre Sea Ice and Sea Surface Temperature)资料(https://www.metoffice.gov.uk/hadobs/hadisst/)。图中黑色圆点表示各珊瑚的采样地点(1: 竹岛; 2: 永暑岛; 3: 海葵园; 4: 巴拉望) Fig. 1 Spatial correlation between SST in the southern SCS (lagged by 4 months) and Niño3.4 index. Created by Climate Explorer, an online tool (Trouet et al, 2013). The SST in the southern SCS shows a significant positive correlation (P<0.1) with the Niño3.4 index. The SST data used for this analysis were derived from the monthly HadISST dataset, covering the period from 1950 to 2020 (https://www.metoffice.gov.uk/hadobs/hadisst/). Black dots on the map indicate coral sampling locations: (1) Hòn Tre Island; (2) Yongshu Island; (3) Anemone’s Garden, (4) Palawan Island |
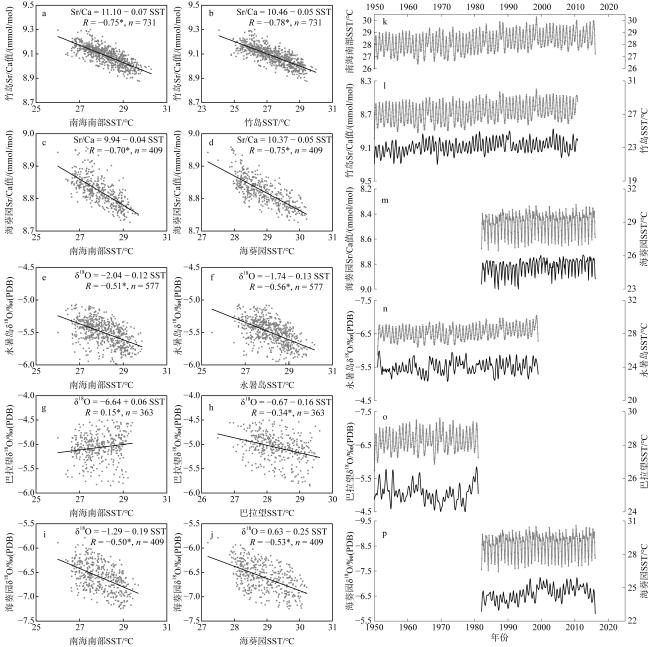
图2 经过13个月滑动平均处理后的珊瑚骨骼月分辨率地球化学指标(黑色折线)与南海南部和局地SST(灰色点线)的相关关系(a—j)及时间序列(k—p)*表示二者具有统计学显著性(P<0.05) Fig. 2 Correlation analyses (a-j) and time series (k-p) of monthly-resolution geochemical proxies in coral skeletons (black folded line) with sea surface temperature (SST) from southern SCS and local SST records (gray dotted line), both processed with a 13-month moving average. Asterisks (*) represent statistically significant correlations (P<0.05) |
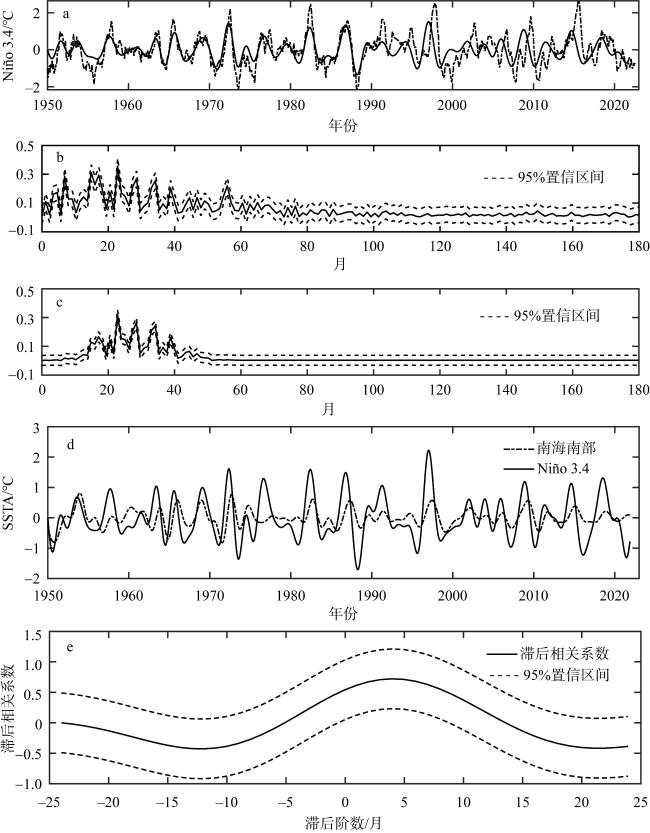
图3 器测SST序列的信号处理a. Niño3.4 SST信号处理前后的时域图, 其中点线为处理前的信号序列, 实线为12~48Hz滤波处理后的信号序列; b. Niño3.4 SST原信号的频域图, 频域分布主要集中在12~48Hz(1~4年)频段; c. Niño3.4 SST经12~48Hz滤波处理后的信号频域图; d. 经12~48Hz带通滤波处理后的Niño3.4(实线)与南海南部(点线)海表温度异常(sea surface temperature anomaly, SSTA)的时间序列; e. 滞后相关分析结果表明, 当南海南部SST滞后4个月时, 与Niño3.4 SST的相关性达到最大, 相关系数为0.72(P<0.05) Fig. 3 Signal processing of instrumental SST sequence: (a) time-domain plot of the Niño3.4 signal before and after processing, with the dotted line representing the raw signal sequence and the solid line representing the signal sequence after applying a 12~48 Hz filter; (b) frequency-domain plot of the original Niño3.4 signal, showing that the frequency distribution is primarily concentrated in the 12~48 Hz (1~4 years) frequency band; (c) frequency-domain plot of the Niño3.4 signal after 12~48 Hz filtering; (d) time series of Niño3.4 (solid line) and sea surface temperature anomaly (SSTA) (dotted line) in the southern SCS after 12~48 Hz band-pass filtering; (e) results of the lagged correlation analysis, showing that the correlation with Niño3.4 reaches its peak when the SST in the southern SCS is lagged by 4 months, with a correlation coefficient of 0.72 (P<0.05) |
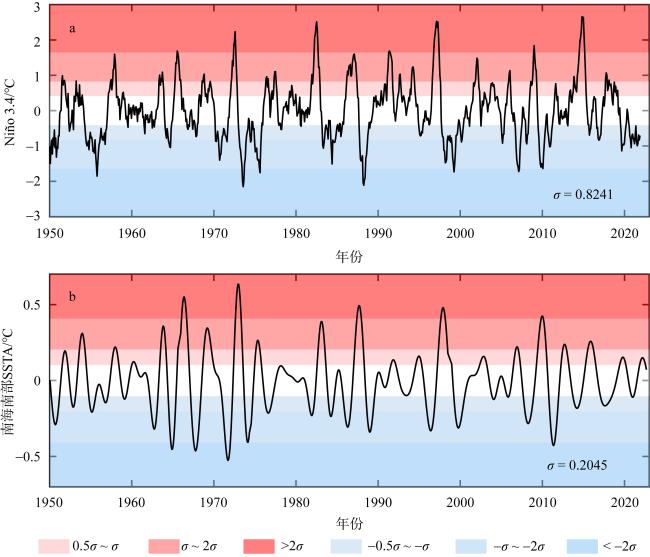
图4 根据±1σ和±2σ标准差作为阈值, 将El Niño和La Niña事件划分为中等、强烈和极端3个等级a. Niño3.4的时间序列; b. 经12~48Hz带通滤波处理后的南海南部SSTA的时间序列 Fig. 4 Classification of El Niño and La Niña events into moderate, intense, and extreme categories, using ±1σ and ±2σ standard deviations as thresholds. (a) Time series of Niño3.4; (b) time series of SSTA in the southern SCS after 12~48 Hz band-pass filtering |
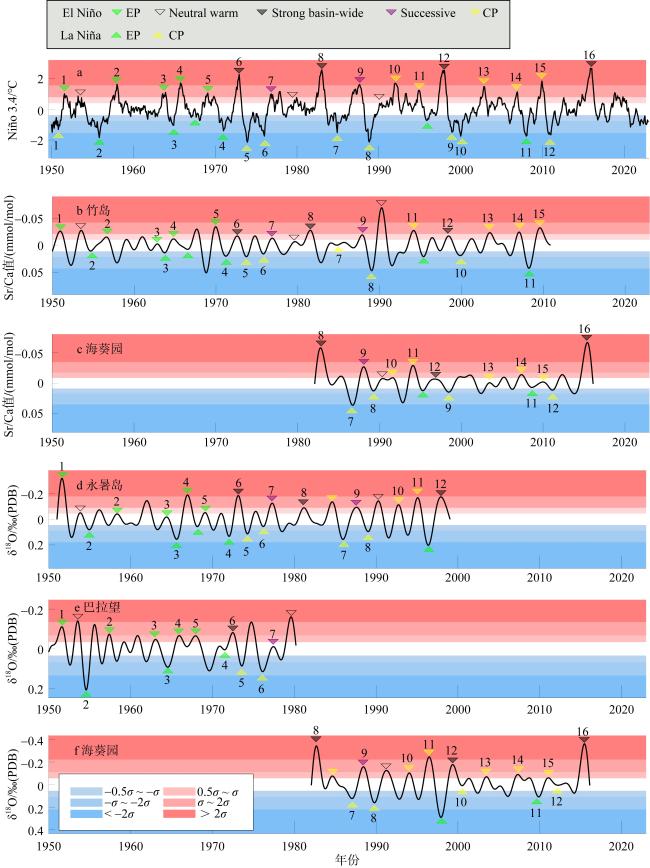
图5 珊瑚地球化学指标记录的不同类型和强度的ENSO事件a. 1950—2020年Niño3.4序列记录的不同类型和强度的ENSO事件作为标准; b. 1950—2010年竹岛珊瑚Sr/Ca距平; c. 1982—2016年海葵园珊瑚Sr/Ca距平; d. 1951—1999年永暑岛珊瑚δ18O距平; e. 1950—1981年巴拉望珊瑚δ18O距平; f. 1982—2016年海葵园珊瑚δ18O距平; 中性变暖事件(▽ neutral warm)未参与后续统计计算 Fig. 5 Different types and intensities of ENSO events as recorded by coral geochemical proxies: (a) different types and intensities of ENSO events recorded in the Niño3.4 index series from 1950 to 2020 as reference standard; (b) Sr/Ca anomalies from Hòn Tre Island, 1950-2010; (c) Sr/Ca anomalies from Anemone’s Garden, 1982-2016; (d) δ18O anomalies from Yongshu Island, 1951-1999; (e) δ18O anomalies from Palawan Island, 1950-1981; (f) δ18O anomalies from Anemone’s Garden, 1982-2016; Neutral warming events (▽) were excluded from subsequent statistical analyses |
| [1] |
陈梦燕, 王鑫, 刘钦燕, 等, 2017. 南海海温在两类El Niño衰退期的季节响应差异[J]. 热带海洋学报, 36(1): 1-8.
|
| [2] |
黄卓, 徐海明, 杜岩, 等, 2009. 厄尔尼诺期间和后期南海海面温度的两次显著增暖过程[J]. 热带海洋学报, 28(5): 49-55.
|
| [3] |
林婷婷, 李春, 2019. ENSO与南海SST关系的年代际变化[J]. 海洋气象学报, 39(2): 68-75.
|
| [4] |
刘羿, 彭子成, 程继满, 等, 2006. 海南岛东部海域滨珊瑚Sr/Ca比值温度计及其影响因素初探[J]. 第四纪研究, 26(3): 470-476.
|
| [5] |
晏宏, 孙立广, 刘晓东, 等, 2010. 近50年来南海西沙群岛海域气候异常的ENSO效应[J]. 热带海洋学报, 29(5): 29-35.
|
| [6] |
|
| [7] |
|
| [8] |
|
| [9] |
|
| [10] |
|
| [11] |
|
| [12] |
|
| [13] |
|
| [14] |
|
| [15] |
|
| [16] |
|
| [17] |
|
| [18] |
|
| [19] |
|
| [20] |
|
| [21] |
|
| [22] |
|
| [23] |
|
| [24] |
|
| [25] |
|
| [26] |
|
| [27] |
|
| [28] |
|
| [29] |
|
| [30] |
|
| [31] |
|
| [32] |
|
| [33] |
|
| [34] |
|
| [35] |
|
| [36] |
|
| [37] |
|
| [38] |
|
/
| 〈 |
|
〉 |
