
基于变分法与卫星海表信息重构西北太平洋涡旋三维结构
|
李林(1999—), 男, 安徽省芜湖市人, 硕士研究生, 从事海洋三维重构研究。email: lin_lee@hhu.edu.cn |
Copy editor: 殷波
收稿日期: 2024-12-02
修回日期: 2025-02-07
网络出版日期: 2025-02-18
基金资助
国家重点研发计划项目(2022YFE0106400)
国家自然科学基金项目(62073332)
Three-dimensional eddy structure reconstruction in the Northwest Pacific using variational method and satellite sea surface data
Received date: 2024-12-02
Revised date: 2025-02-07
Online published: 2025-02-18
Supported by
National Key Research and Development Program of China(2022YFE0106400)
National Natural Science Foundation of China(62073332)
李林 , 王喜冬 , 何子康 , 陈志强 , 曹源 , 刘科峰 , 陈建 . 基于变分法与卫星海表信息重构西北太平洋涡旋三维结构[J]. 热带海洋学报, 2025 , 44(5) : 39 -49 . DOI: 10.11978/2024226
This study reconstructs the three-dimensional dynamic temperature field in the Northwest Pacific Ocean using high-resolution satellite sea surface data and historical ocean temperature and salinity profile data, based on the variational method. Compared to the array for real-time geostrophic oceanography (Argo) temperature profiles, the reconstructed temperature field reasonably reproduces the vertical distribution of seawater temperature, particularly in the thermocline region, where the results closely match the actual observed temperature profiles. Two typical mesoscale eddy cases were selected for analysis of their entire evolution process — from generation to decay — using the reconstructed temperature field, displaying the dynamic changes in the vertical and horizontal distribution of temperature anomalies induced by the eddies. In particular, during the mature stage of the eddies, the intensity and vertical extent of the temperature anomalies reach their maximum, reflecting the significant impact of the eddies on the oceanic thermocline. By analyzing the distribution of temperature anomalies at different stages, the study reveals the evolution of the spatial structure of cold and warm cores and the anomalous regions. The results show that the method can effectively utilize satellite sea surface observations to reconstruct the underwater temperature structure and dynamic evolution of mesoscale eddies, providing valuable data support for understanding their role in oceanic material and heat transport.
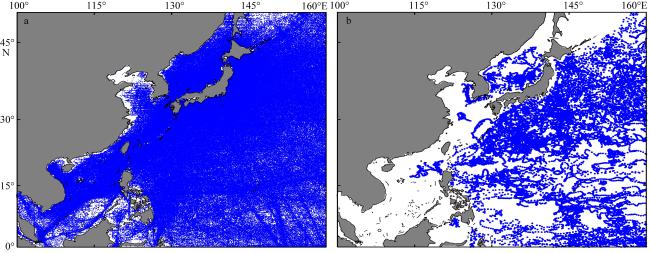
图1 研究海域建立模型所用历史温盐剖面资料分布图(a)和2021—2022年用于结果检验的温剖面分布图(b)该图基于自然资源部标准地图服务网站下载的审图号为GS(2016)1664号的标准地图制作, 底图无修改 Fig. 1 Distribution of historical temperature and salinity profiles used for model construction in the study area (a) and temperature profiles used for result validation in 2021-2022 (b) |
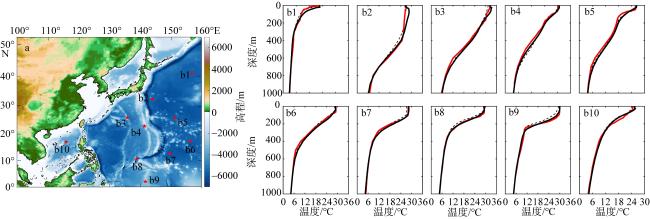
图3 Argo数据空间分布(a)和Argo观测、重构场、WOA18月均气候态单点温度垂向廓线图(b1—b10)图a基于自然资源部标准地图服务网站下载的审图号为GS(2016)1664号的标准地图制作, 底图无修改, 红色星号表示Argo的空间点位b1—b10。图b中红色实线表示Argo观测数据, 黑色实线表示重构场数据, 黑色虚线表示WOA18月均气候态数据 Fig. 3 Spatial distribution of Argo data (a) and vertical temperature profiles of Argo observations, reconstructed field, and WOA18 monthly climatology for individual locations (b1—b10). (a) Shading represents sea surface height with red stars indicating Argo spatial locations; (b1—b10) Red solid lines: Argo observations; black solid lines: reconstructed field; black dashed lines: WOA18 monthly climatology |
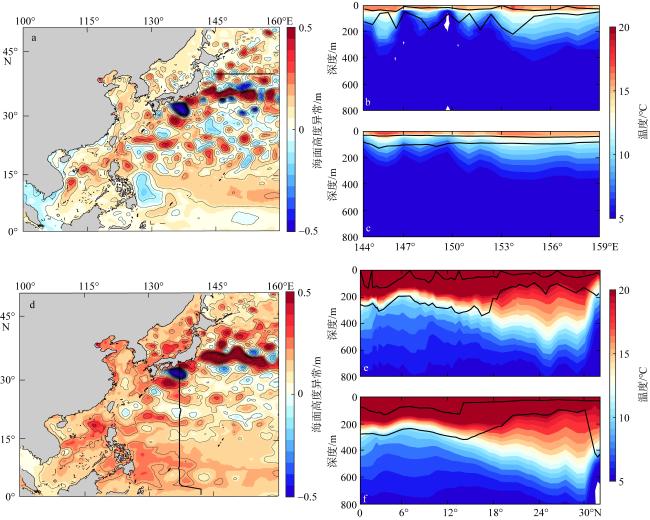
图4 实测数据轨迹(a、d)及重构场与实测数据温度断面图(b、c、e、f)a. 2019年6月17日—6月29日实测数据在西北太平洋中的轨迹(黑色曲线)及实测数据期间卫星观测的平均海面高度异常(填色); d. 2022年8月7日—10月10日实测数据在西北太平洋中的轨迹(黑色曲线)及实测数据期间卫星观测的平均海表面高度异常(填色), 该图基于自然资源部标准地图服务网站下载的审图号为GS(2016)1664号的标准地图制作, 底图无修改。b, e. 实测数据温度剖面; c, f. 重构数据温度剖面。剖面图中黑色折线表示温跃层上下边界 Fig. 4 Observed data trajectories (a, d) and cross-sections of the reconstructed field versus observed temperature (b, c, e, f). (a) Trajectory of observed data in the Northwest Pacific from June 17 to 29, 2019 (black curve) and the mean sea surface height anomaly (SSHA) from satellite observations during the observation period (color shading); (d) trajectory of observed data in the Northwest Pacific from August 7 to October 10, 2022 (black curve) and the mean SSHA from satellite observations during the observation period (color shading); (b, e) observed temperature profiles; (c, f) reconstructed temperature profiles. In the cross-section plots, the black polylines represent the upper and lower boundaries of the thermocline |
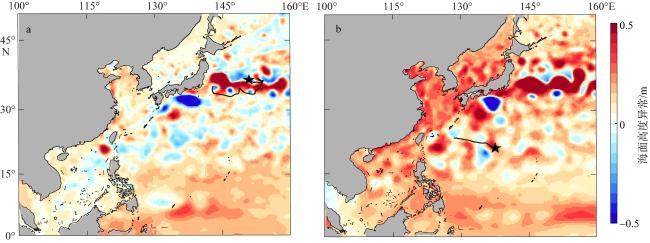
图5 编号827620中尺度涡旋(a)和编号796972中尺度涡旋(b)的轨迹图黑色星形表示涡旋生成位置, 黑色曲线表示涡旋轨迹, 填色表示涡旋生成初期卫星观测海面高度异常。该图基于自然资源部标准地图服务网站下载的审图号为GS(2016)1664号的标准地图制作, 底图无修改 Fig. 5 Trajectories of mesoscale eddies 827620 (a) and 796972 (b). Black stars indicate the eddy generation location, and shading represents initial sea level anomaly during eddy formation |
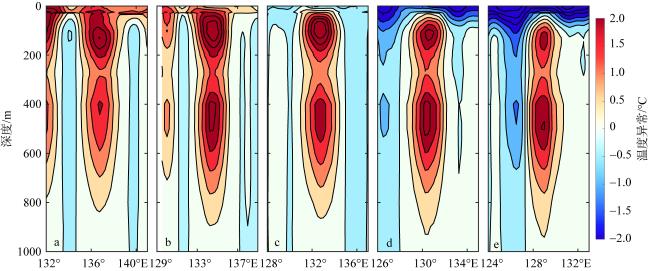
图6 827620中尺度涡旋不同阶段的重构场过涡心的温度异常纬向断面图a. 2021年3月1日; b. 2021年5月10日; c. 2021年8月8日; d. 2021年9月27日; e. 2021年12月6日。图中黑线为温度异常等值线 Fig. 6 Zonal sections of temperature anomalies across eddy 827620 center at different development stages of the reconstructed field (a-e). Shading represents anomaly intensity (red: positive/warm; blue: negative/cold). Black contours represent temperature anomaly isotherms |
图7 796972中尺度涡旋不同阶段的重构场过涡心的温度异常纬向断面图a. 2021年10月10日; b. 2021年11月4日; c. 2021年11月30日; d. 2021年12月25日; e. 2022年1月20日。图中黑线为温度异常等值线 Fig. 7 Zonal sections of temperature anomalies across eddy 796972 center at different development stages of the reconstructed field (a-e). Visualization convention follows Fig. 6 |
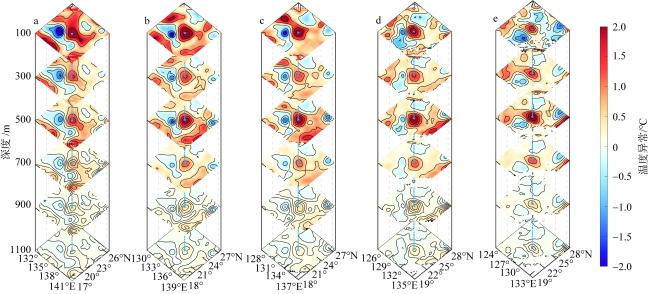
图8 827620中尺度涡旋不同阶段的重构场温度异常三维结构图a. 2021年3月1日; b. 2021年5月10日; c. 2021年8月8日; d. 2021年9月27日; e. 2021年12月6日。图中黑线为温度异常等值线 Fig. 8 Three-dimensional structures of temperature anomalies for eddy 827620 at different stages of the reconstructed field (a-e). Visualization convention follows Fig. 6 |
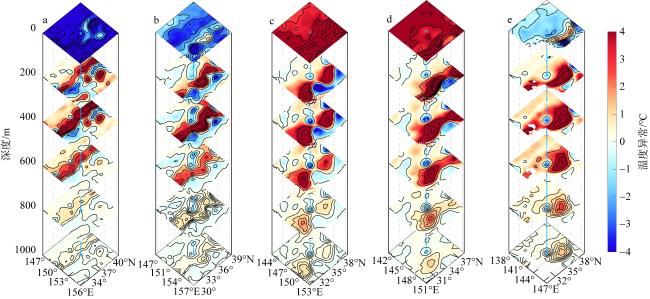
图9 796972中尺度涡旋不同阶段的重构场温度异常三维结构图a. 2021年10月10日; b. 2021年11月4日; c. 2021年11月30日; d. 2021年12月25日; e. 2022年1月20日。图中黑线为温度异常等值线 Fig. 9 Three-dimensional structures of temperature anomalies for eddy 796972 at different stages of the reconstructed field (a-e). Visualization convention follows Fig. 6 |
| [1] |
戴玉玲, 张伟, 包畯, 2018. 热带西太平洋海域温跃层判别方法比较[J]. 海洋预报, 35(5): 17-24.
|
| [2] |
王喜冬, 韩桂军, 李威, 等, 2011. 利用卫星观测海面信息反演三维温度场[J]. 热带海洋学报, 30(6): 10-17.
|
| [3] |
|
| [4] |
|
| [5] |
|
| [6] |
|
| [7] |
|
| [8] |
|
| [9] |
|
| [10] |
|
| [11] |
|
| [12] |
|
| [13] |
|
| [14] |
|
| [15] |
|
| [16] |
|
| [17] |
|
| [18] |
|
| [19] |
|
| [20] |
|
| [21] |
|
| [22] |
|
| [23] |
|
| [24] |
|
| [25] |
|
| [26] |
|
| [27] |
|
| [28] |
|
| [29] |
|
| [30] |
|
| [31] |
|
| [32] |
|
| [33] |
|
| [34] |
|
| [35] |
|
/
| 〈 |
|
〉 |


