
ENSO与内部变率对印度洋偶极子影响的估算*
*感谢两位审稿老师对本工作提出的建设性意见。感谢美国国家海洋和大气管理局(NOAA)提供ERSST资料, 欧洲中期天气预报中心(ECMWF)提供ERA5大气再分析资料, 和英国气象局哈德利中心(Met Office Hadley Centre)提供的EN4资料。感谢中国科学院南海海洋研究所高性能计算中心提供数据计算的支持
|
张涟漪(1993—), 男, 天津市人, 助理研究员, 主要从事海气相互作用与海洋动力过程方面的研究。email: lyzhang@scsio.ac.cn |
Editor: 孙翠慈
收稿日期: 2024-12-23
修回日期: 2025-01-15
网络出版日期: 2025-03-07
基金资助
国家自然科学基金(U21A6001)
国家自然科学基金(42106021)
中国科学院项目(183311KYSB20200015)
中国科学院南海海洋研究所项目(SCSIO202201)
中国科学院南海海洋研究所项目(SCSIO2023HC07)
广州市科技项目(2023A04J0186)
南方海洋科学与工程广东省实验室(广州)项目(2019BT02H594)
广东省基础与应用基础研究基金杰出青年项目(2024B1515020037)
广东省基础与应用基础研究基金面上项目(2023A1515012691)
Quantifying impacts of ENSO and internal variability on the Indian Ocean Dipole*
Editor: SUN Cuici
Received date: 2024-12-23
Revised date: 2025-01-15
Online published: 2025-03-07
Supported by
National Natural Science Foundation of China(U21A6001)
National Natural Science Foundation of China(42106021)
Chinese Academy of Sciences(183311KYSB20200015)
South China Sea Institute of Oceanology(SCSIO202201)
South China Sea Institute of Oceanology(SCSIO2023HC07)
Science and Technology Projects in Guangzhou(2023A04J0186)
Southern Marine Science and Engineering Guangdong Laboratory (Guangzhou)(2019BT02H594)
Guangdong Natural Science Funds for Distinguished Young Scholar(2024B1515020037)
Guangdong Basic and Applied Basic Research Foundation(2023A1515012691)
印度洋偶极子(Indian Ocean Dipole, IOD)是印度洋固有的一种气候现象, 通常发生在北半球秋季, 会影响印度洋周边国家和地区乃至我国的天气、气候状况。IOD同时受到厄尔尼诺-南方涛动(El Niño-Southern Oscillation, ENSO)和印度洋内部变率的影响。因增暖中心和气候影响的差异, ENSO被分为两种主要类型, 即东太平洋型(eastern Pacific, EP)和中太平洋型(central Pacific, CP)。然而, 当前研究并未充分讨论两种类型ENSO对IOD的影响机制, 也未量化两类ENSO和内部变率的影响程度。在此, 以上因素对IOD的贡献可以通过一种新型联合线性回归方法进行估算。该方法分离了两类ENSO与内部变率的影响, 结果表明印度洋内部变率是IOD海温变化主要来源, 占比可达60%以上; ENSO的总贡献约占三分之一, 其中以CP型为主, 而EP型则倾向于在极端事件中影响IOD。ENSO与内部变率对IOD的作用机制不同: ENSO主要通过沃克环流影响印度洋风场, 但因为EP型和CP型的增暖核心不同, 两者影响程度有所差异; 内部变率则倾向于通过印度洋内部的海洋过程造成海温异常进而引起IOD。此外, 由于厄尔尼诺生命期更长, 与之共发的IOD正事件有更大几率转化为下一年春季的印度洋海盆尺度增暖, 其中ENSO总贡献超过70%。虽然内部变率对该转化并无显著统计关系, 但强的IOD正事件仍有机会触发海盆尺度增暖。以上结果有助于提高对气候模态以及跨海盆相互作用的认识。
张涟漪 , 张玉红 , 杜岩 . ENSO与内部变率对印度洋偶极子影响的估算*[J]. 热带海洋学报, 2026 , 45(1) : 91 -104 . DOI: 10.11978/2024238
The Indian Ocean Dipole (IOD) is an intrinsic climate mode in the Indian Ocean, typically occurring during the boreal fall, influencing weather and climate in surrounding regions and even China. The IOD is affected by both the El Niño-Southern Oscillation (ENSO) and internal variability within the Indian Ocean. However, the quantitative contributions of two types of ENSO, namely the eastern Pacific (EP) and the central Pacific (CP), and internal variability to the IOD remain unclear. Here, a binary combined linear regression method is used to separate and estimate the contributions of these three factors. The results show that internal variability is the primary source of IOD sea surface temperature (SST) changes, accounting for more than 60% of the variance. The contribution of ENSO is about one-third, predominantly driven by the CP ENSO, whereas the EP type tends to exert a stronger influence on the IOD during extreme events. Their influencing mechanisms are different: ENSO affects the Indian Ocean wind field primarily via the Walker circulation, with the efficiency depending on the location of the warming cores (EP vs. CP). In comparison, internal variability tends to induce SST anomalies through oceanic processes within the Indian Ocean, facilitating IOD development. Due to the longer lifetime of El Niño events, a co-occurring positive IOD has a higher chance of transforming into an Indian Ocean basin-wide warming event in the following spring, for which ENSO contributes more than 70% of the transition. Although internal variability does not show a significant statistical relationship with this transition, a strong positive IOD still has the potential to induce subsequent basin-wide warming. These findings improve our understanding of climate modes and inter-basin interactions.
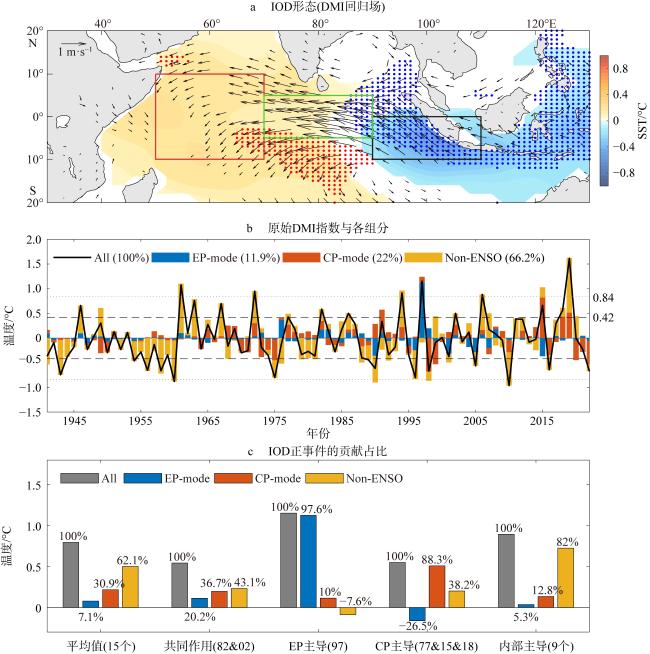
图1 印度洋偶极子(IOD)的基本形态与具体量化a. IOD盛期(北半球秋季, 9—11月)的海温(填色)、10m风场(箭头)、温跃层(打点, 红色和蓝色点分别表示温跃层变深或者变浅4m)的空间分布; 所有结果基于9—11月平均的偶极子指数(dipole mode index, DMI)回归到同时期各自变量的异常场; 只有通过95%置信度检验的结果被画出; 红色框和黑色框分别为IOD西极和东极的范围, 绿色框为中赤道印度洋纬向风指数的平均范围; 该图基于自然资源部标准地图服务网站下载的审图号为GS(2016)1561号的标准地图制作; b. 1941—2022年IOD盛期的DMI指数的量化, 黑色实线、蓝色柱体、红色柱体和黄色柱体分别表示原始(All)、东太平洋厄尔尼诺-南方涛动(El Niño-Southern Oscillations, ENSO)贡献的(EP-mode)、中太平洋ENSO贡献(CP-mode)的和独立于ENSO的部分(Non-ENSO)贡献的DMI, 图例中的百分数表示各组分方差解释率; 虚线和点线分别表示DMI的一倍和两倍标准差, 即0.42℃和0.84℃; c. IOD事件的平均与典型分类的贡献比例, 基于b中超过1个标准差进行筛选; 柱体上的百分数为该组分的贡献比例 Fig. 1 Basic configuration and quantitative measures of the Indian Ocean Dipole (IOD). (a) Spatial distribution of sea surface temperature (shading), 10-meter wind field (vectors), and thermocline depth (stippling; red and blue dots indicate thermocline deepening or shoaling by more than 4 meters, respectively) during the peak phase of IOD (Northern Hemisphere autumn, September-November); these results are based on regression onto Dipole Mode Index (DMI) in September-November (SON); only significant results exceeding the 95% confidence level are shown; red and black boxes indicate the western pole and eastern pole of IOD; green box shows the location of equatorial zonal wind index (Ueq); (b) quantification of the dipole mode index (DMI) during the peak phase of IOD from 1941 to 2022; black line, blue bar, red bar, and yellow bar represent the contribution of original (All), EP ENSO (EP-mode), CP ENSO (CP-mode) and independent part (Non-ENSO) to the DMI; variance explanations are noted in the legend box; dashed/dotted line exhibits the one/twice standard deviation (STD, 0.42/0.84°C); (c) average and typical categorical contribution ratios of IOD events, selected based on exceeding one standard deviation in (b) |
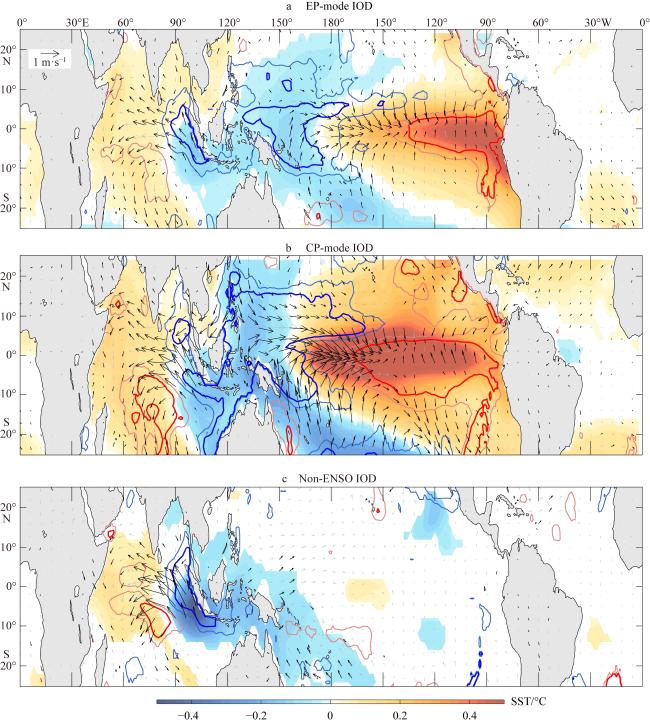
图2 各组分中IOD的盛期形态a. EP-mode组分中基于IOD盛期DMI回归到海温(填色)、10m风场(箭头)和温跃层(等值线)的异常场; b和c: 类似于a, 分别为CP-mode组分和内部变率组分中的DMI回归场; 通过95%置信度检验的异常海温和温跃层才会被画出, 显著的风场用加黑箭头表示, 浅和深红色(蓝色)的等值线分别表示温跃层变深(变浅)2m和4m。该图基于自然资源部标准地图服务网站下载的审图号为GS(2016)1561号的标准地图制作 Fig. 2 Mature phase patterns of the IOD in different components. (a) Anomalous fields of sea surface temperature (shading), 10-meter wind field (vectors), and thermocline (contours) regressed onto the DMI during the mature phase of the IOD in the EP-mode component; (b, c) similar to (a) but for the regression fields of the DMI in the CP-mode component and the internal variability component, respectively; only significant results exceeding the 95% confidence level are shaded, bold, and contoured light/dark red (blue) color indicates the thermocline deepening (shallowing) by 2/4 meters |
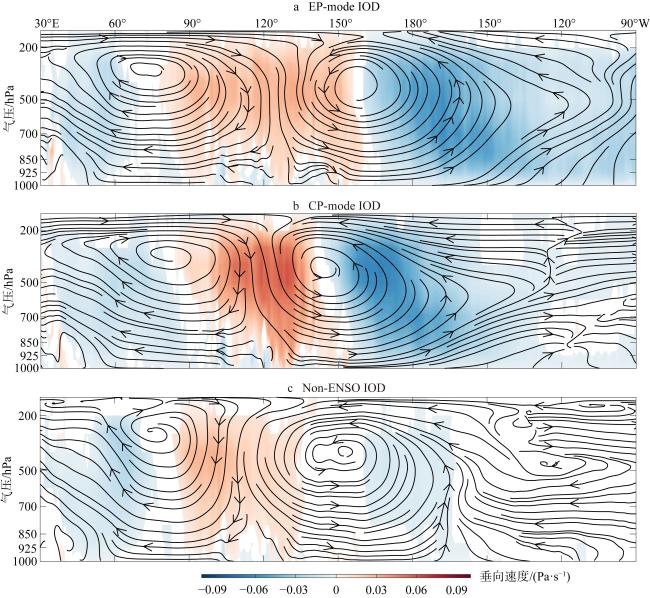
图3 各组分中IOD对应的沃克环流形态a. EP-mode组分中基于IOD盛期DMI回归印太海洋赤道大气环流场的异常垂直速度和纬向速度; b和c类似于a, 分别为CP-mode组分和内部变率组分中的DMI回归场; 通过95%置信度检验的垂向速度异常以填色表示; 图中垂向速度为乘以100倍结果, 用于匹配纬向风场量级, 因此流线箭头在本图中只表示异常环流结果, 不代表实际数值 Fig. 3 Walker circulation patterns corresponding to IOD in different components. (a) Regression of equatorial Indo-Pacific atmospheric circulation fields onto the DMI during the peak phase of the EP-mode component, showing anomalous vertical velocity and zonal velocity; (b, c) similar to (a) but for the CP-mode component and the internal variability component, respectively |
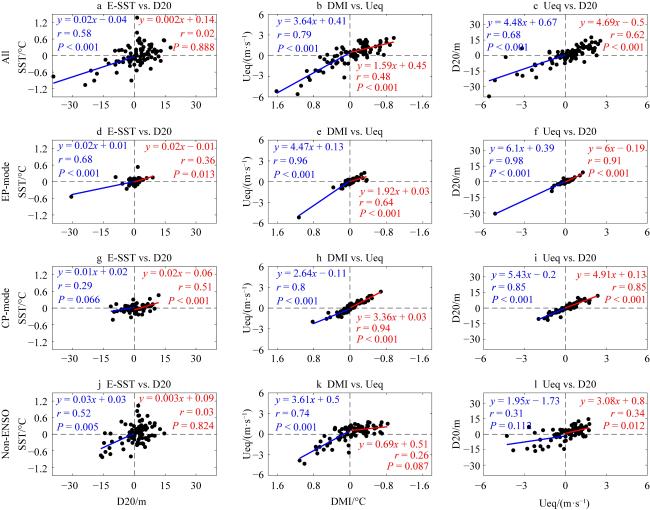
图4 热带印度洋的温跃层-SST-风正反馈耦合效率在各组分的表现a. 原始变化中IOD东极海表温度(SST)与温跃层(D20)的散点图, 表示了温跃层-海温反馈; 图中蓝色线与红色线分别表示温跃层降低与升高对应SST下降与上升的对应关系, 回归方程与检验结果分别以同颜色写在两侧; b. 偶极子指数(DMI)与赤道印度洋纬向风(Ueq)的散点图, 表示了温度梯度-纬向风反馈; c. Ueq与D20的散点图, 表示了纬向风-温跃层反馈; 分开正负两侧分别回归表示IOD具有不对称性, 蓝色表示IOD正相位情况, 红色表示IOD负相位情况; 注, 中列DMI的横坐标为反序, 用以与其他两列对齐IOD正相位(蓝色); d—f, g—i, j—l: 类似于a—c, 但三组分别表示在EP-mode组分、CP-mode组分和Non-ENSO组分中的反馈效率情况 Fig. 4 Performance of the thermocline-SST-wind positive feedback coupling efficiency in the tropical Indian Ocean across different components. (a) Scatter plot of SST at the eastern pole of the Indian Ocean Dipole (IOD) and thermocline depth (D20) from the original variations, illustrating the thermocline-SST feedback; blue/red line denotes the relationship between thermocline-shoaling and SST-cooling/thermocline-deepening and SST-warming; (b) scatter plot of the dipole mode index (DMI) and equatorial Indian Ocean zonal wind (Ueq), illustrating the temperature gradient-zonal wind feedback; (c) scatter plot of Ueq and D20, illustrating the zonal wind-thermocline feedback; considering the asymmetry of IOD, regressions are made for positive (blue) and negative (red) phases; (d-f), (g-i), (j-l) similar to (a-c), but for the EP-mode component, CP-mode component, and Non-ENSO component, respectively, showing the feedback efficiency in each component |
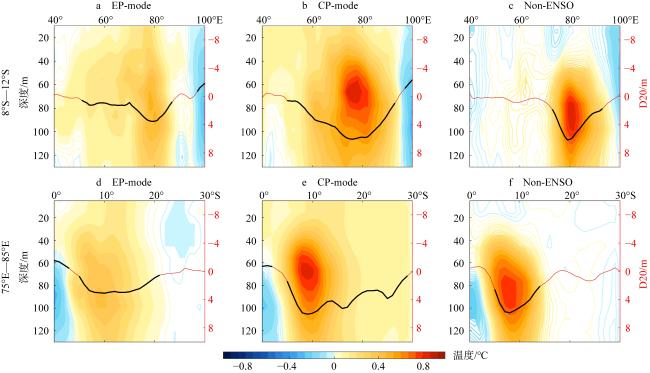
图5 IOD盛期南印度洋次表层温度变化a. EP-mode组分中基于IOD盛期DMI回归到南热带印度洋(纬向8°S—12°S断面)的次表层温度(等值线与填色)和温跃层深度(红线与黑线)的异常场; b和c类似于a, 分别为CP-mode组分和内部变率组分中的DMI回归场; d—f: 类似于a—c, 但是为各组分对经向断面(75°E—85°E)的影响; 通过95%置信度检验的次表层温度被填色, 以及温跃层深度变化加黑 Fig. 5 Subsurface temperature variations in the South Indian Ocean during the peak phase of the Indian Ocean Dipole (IOD). (a) Anomalies in subsurface temperature (contours and shading) and thermocline depth (red and black lines) in the EP-mode component, based on the regression of the dipole mode index (DMI) during the peak IOD phase onto the southern tropical Indian Ocean (zonal section 8°S-12°S); (b, c) similar to (a), but for the CP-mode component and the internal variability component, respectively; (d-f) similar to (a-c), but showing the influence of each component on the meridional section (75°E-85°E) |
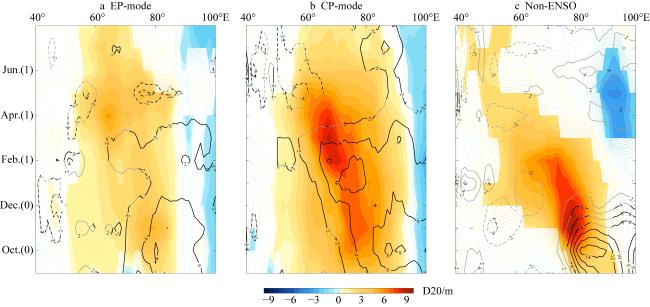
图6 IOD引起南印度洋罗斯贝波传播a. EP-mode组分中基于IOD盛期DMI对南热带印度洋(10°S断面)温跃层深度(彩色等值线与填色)和风应力旋度(黑色等值线与打点)异常场进行滞后回归; b和c类似于a, 分别为CP-mode组分和内部变率组分中的DMI回归场; 通过95%置信度检验的温跃层深度异常被填色, 以及风应力旋度等值线被加粗 Fig. 6 Rossby wave propagation in the South Indian Ocean induced by IOD. (a) Lag regression of the thermocline depth anomaly (color contours and shading) and wind stress curl anomaly (black contours and stippling) in the South Tropical Indian Ocean (10°S section) on the DMI during the peak phase of the EP-mode component; (b, c) similar to (a), showing the DMI regression fields for the CP-mode component and the internal variability component, respectively; significant results exceeding the 95% confidence level are shaded and bold |
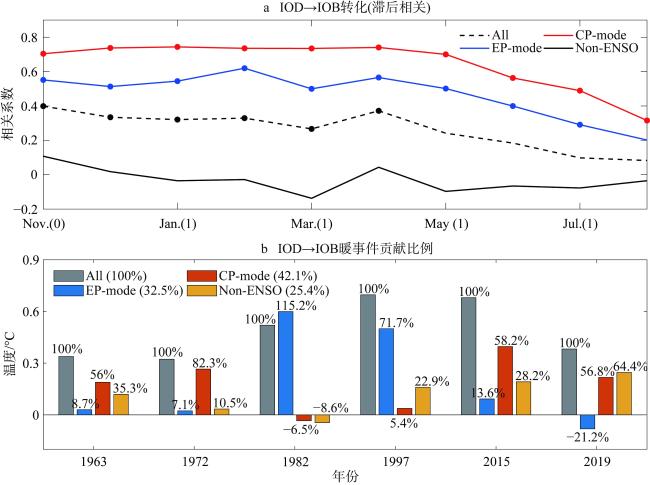
图7 IOD转化为次年印度洋海盆模态(Indian Ocean basin-wide mode, IOB)的估算a. 基于IOD盛期DMI对IOB指数进行逐月滞后回归, 括号中0和1分别表示IOD发生年和次年; b. 15次IOD正事件(如图1b)中有6次转化为IOB增暖后各组分的贡献情况; 这里IOB增暖振幅取各事件中原始IOB指数连续三个月平均的最高值; 图例中百分数为平均贡献率, 柱体上的百分数为各组分在该事件中的贡献率 Fig. 7 Estimation of the transition from IOD to the following year's Indian Ocean basin-wide mode (IOB). (a) Monthly lagged regression of the IOB index based on the dipole mode index (DMI) during the peak phase of IOD; (b) contributions of various components in the six cases where positive IOD events (as shown in Fig. 1b) transitioned into IOB warming out of 15 events |
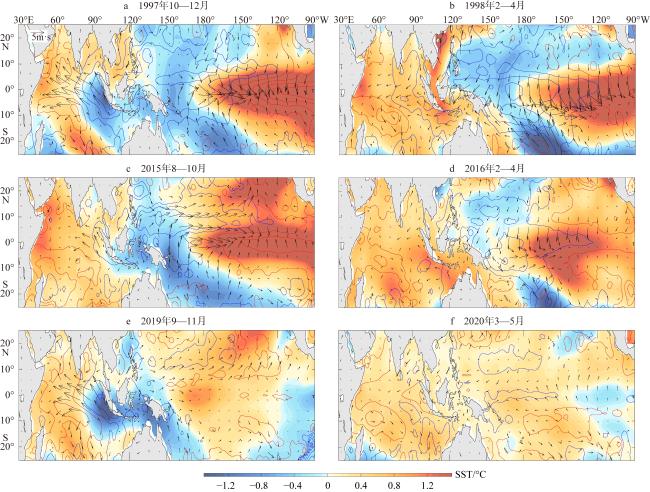
图8 三次典型IOD正事件与对应次年转化为印度洋海盆增暖a和b: 1997年IOD正事件与后续1998年IOB增暖事件, 图中各异常场对应填色为海表温度, 等值线为温跃层, 箭头为10m风场, 展示时间均选择各自盛期(指数连续三个月平均最大值); c和d以及e和f: 类似于a和b, 分别为2015—2016年与2019—2020年的情况; 三次事件分别表示了由EP-mode、CP-mode和内部变率主导贡献的IOD与IOB; 该图基于自然资源部标准地图服务网站下载的审图号为GS(2016)1561号的标准地图制作 Fig. 8 Three typical positive IOD events and their transitions to Indian Ocean basin-wide warming in the following year. (a, b) The 1997 positive IOD event and the subsequent 1998 IOB warming event; (c, d), (e, f) similar to (a, b), showing the cases for 2015-2016 and 2019-2020, respectively. These three events represent IOD and IOB events dominated by EP-mode, CP-mode, and internal variability, respectively |
| [1] |
李崇银, 穆明权, 2001. 赤道印度洋海温偶极子型振荡及其气候影响[J]. 大气科学, 25(4): 433-443.
|
| [2] |
晏红明, 肖子牛, 2000. 印度洋海温异常对亚洲季风区天气气候影响的数值模拟研究[J]. 热带气象学报, 16(1): 18-27.
|
| [3] |
|
| [4] |
|
| [5] |
|
| [6] |
|
| [7] |
|
| [8] |
|
| [9] |
|
| [10] |
|
| [11] |
|
| [12] |
|
| [13] |
|
| [14] |
|
| [15] |
|
| [16] |
|
| [17] |
|
| [18] |
|
| [19] |
|
| [20] |
|
| [21] |
|
| [22] |
|
| [23] |
|
| [24] |
|
| [25] |
|
| [26] |
|
| [27] |
|
| [28] |
|
| [29] |
|
| [30] |
|
| [31] |
|
| [32] |
|
| [33] |
|
| [34] |
|
| [35] |
|
| [36] |
|
| [37] |
|
| [38] |
|
| [39] |
|
| [40] |
|
| [41] |
|
| [42] |
|
| [43] |
|
| [44] |
|
| [45] |
|
| [46] |
|
| [47] |
|
| [48] |
|
| [49] |
|
| [50] |
|
| [51] |
|
| [52] |
|
| [53] |
|
| [54] |
|
| [55] |
|
| [56] |
|
| [57] |
|
| [58] |
|
| [59] |
|
| [60] |
|
| [61] |
|
| [62] |
|
| [63] |
|
| [64] |
|
| [65] |
|
| [66] |
|
/
| 〈 |
|
〉 |
