印度洋赤道深层流的季节内变化特征及其驱动机制*
*本研究所使用的数据来自国家自然科学基金共享航次计划项目, 相关航次编号(及项目批准号)为: NORC2015-10(41549910)、NORC2016-10(41649910)、1ORC2017-10(41749910)、NORC2018-10(41849910)、NORC2019-10(41949910)、NORC2020-10(42049910)、NORC2022-10+NORC2022-303(42149910), 航次由“实验1号”“实验3号”和“实验6号”组织实施, 在此一并致谢
|
钟卿文(1997—), 广东省韶关市人, 博士研究生, 研究方向为海洋环流与波动动力学。email: zhongqingwen@scsio.ac.cn |
Editor: 孙翠慈
收稿日期: 2025-02-18
修回日期: 2025-03-25
网络出版日期: 2025-06-06
基金资助
国家自然科学基金共享航次计划项目(42149910)
国家自然科学基金(42476199)
国家自然科学基金(42476022)
国家自然科学基金共享航次计划项目(41549910)
国家自然科学基金共享航次计划项目(41649910)
国家自然科学基金共享航次计划项目(41749910)
国家自然科学基金共享航次计划项目(41849910)
国家自然科学基金共享航次计划项目(41949910)
国家自然科学基金共享航次计划项目(42049910)
Intraseasonal variability and dynamical mechanisms of equatorial deep currents in the Indian Ocean*
Editor: SUN Cuici
Received date: 2025-02-18
Revised date: 2025-03-25
Online published: 2025-06-06
Supported by
Shiptime Sharing Project of National Natural Science Foundation of China (NSFC)(42149910)
National Natural Science Foundation of China(42476199)
National Natural Science Foundation of China(42476022)
Shiptime Sharing Project of National Natural Science Foundation of China (NSFC)(41549910)
Shiptime Sharing Project of National Natural Science Foundation of China (NSFC)(41649910)
Shiptime Sharing Project of National Natural Science Foundation of China (NSFC)(41749910)
Shiptime Sharing Project of National Natural Science Foundation of China (NSFC)(41849910)
Shiptime Sharing Project of National Natural Science Foundation of China (NSFC)(41949910)
Shiptime Sharing Project of National Natural Science Foundation of China (NSFC)(42049910)
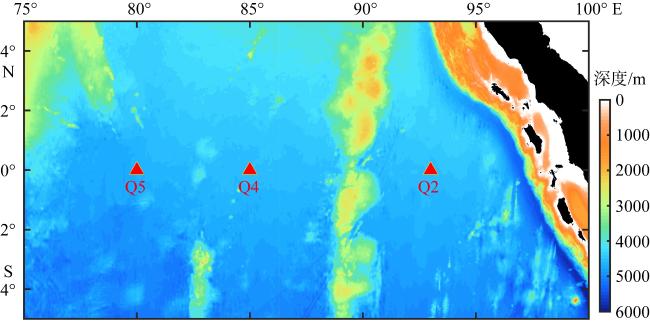
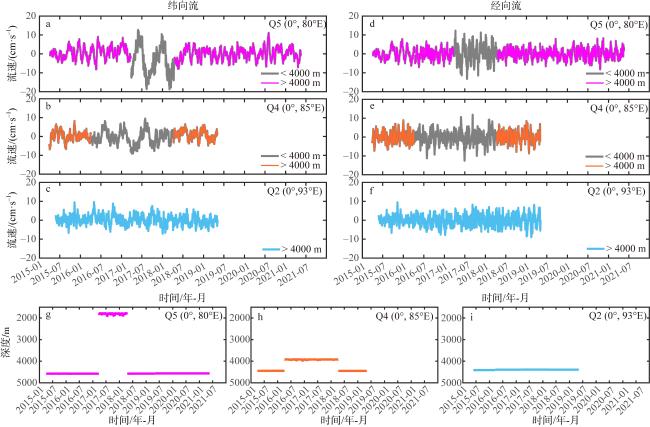
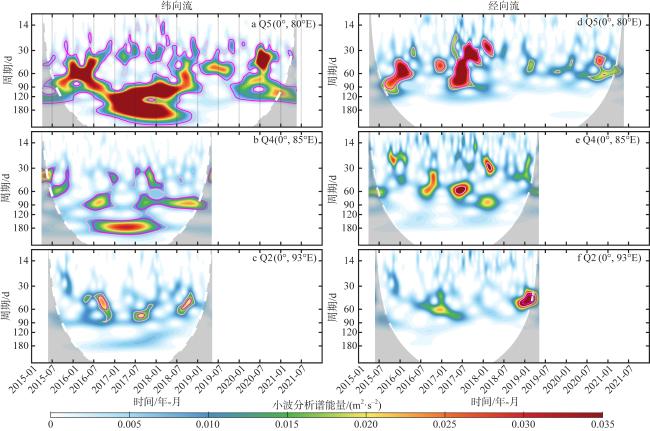
本文利用2015年3月—2021年5月热带印度洋观测网(tropical Indian Ocean observation net, TIOON)在赤道80°E、85°E和93°E布设的观测潜标所获取的环流时间序列, 结合BRAN2020 (Bluelink ReANalysis)环流流速数据以及JRA-55(Japanese 55-year Reanalysis)气象数据, 研究了印度洋赤道深层环流(1200m以下)的季节内变化特征及其驱动机制。观测结果显示, 深层环流流速平均值接近0, 纬向流速标准偏差范围为2.5~3.1cm·s−1, 经向流速标准偏差范围为2.6~3.1cm·s−1。纬向流和经向流的季节内周期信号强度分别占各自总流动强度的88%~91%和74%~84%, 揭示了深层环流中的显著季节内周期变率特征。小波分析表明, 深层纬向流季节内信号主要周期为10~100d, 其中80°E处的周期较长(50~90d), 而93°E处的主要为50d及更高频信号, 表现为蓝移现象, 即环流变化的主导频率随位置靠东而变高的现象。经向流季节内信号以60d周期最显著。赤道风应力异常是深层环流季节内变率的重要驱动因素。中海盆(80°E和85°E)深层环流季节内变率主要受纬向风应力异常驱动, 通过反射波动过程调制; 基于低阶斜压模态, 能量通过Kelvin波在东边界反射后形成的Rossby波向深层传递。东海盆(93°E)深层环流季节内变率主要受纬向和经向风应力异常驱动, 通过直接波动过程调制; 基于多阶斜压模态, 能量通过在环流西侧由风直接驱动产生的Yanai波向深层传递。根据线性波动理论, 本研究刻画了上述赤道波的能量传播射线, 结果显示地形对赤道波调制深海环流的动力过程有重要影响: 中海盆的平坦地形有利于向下向西传播能量的反射波动过程, 而90°E海脊可能会阻碍向下向东传播能量的直接波动过程。在平坦地形区域, 正压不稳定过程在经向上无显著差异且强度弱, 区域平均结果显示能量主要由平均流向环流季节内变率释放; 90°E海脊附近, 环流季节内变率与平均流之间存在更强的非线性动力作用, 表现为环流季节内变率向平均流转移能量。本研究加深了对深层环流动力学的理解, 为改进深海环流模拟提供了观测依据。
钟卿文 , 陈更新 , 陈举 , 何云开 . 印度洋赤道深层流的季节内变化特征及其驱动机制*[J]. 热带海洋学报, 2026 , 45(1) : 140 -153 . DOI: 10.11978/2025024
This paper examines the intraseasonal variability of equatorial deep currents (below 1200 m) in the Indian Ocean, utilizing time series data spanning from 2015 to 2021. These data were obtained from TIOON (tropical Indian Ocean observation net) moorings positioned at 80°E, 85°E, and 93°E on the equator, supplemented by continuous current velocity data from BRAN2022, wind velocity data from JRA-55, and temperature-salinity data from WOA23. Observations reveal that the standard deviation (STD) of zonal current velocities at these locations ranges from 2.5 to 3.1 cm·s−1, while the STD of meridional current velocities ranges from 2.6 to 3.1 cm·s−1. Notably, intraseasonal variability accounts for 88%-91% and 74%-84% of the total current variability for the zonal and meridional currents, respectively, underscoring its significance. Wavelet analysis indicates that the primary period of intraseasonal deep zonal currents is 10-100 days, with a longer period (50-90 days) observed at 80°E and a shorter period (< 50 days) at 93°E. This suggests a blue-shift phenomenon, where the variability in deep currents shifts to higher frequencies toward the east. Additionally, intraseasonal meridional currents exhibit a significant peak at the 60-day period. Equatorial wind stress anomalies are a crucial forcing factor driving intraseasonal variability in deep currents through both direct and reflected wave processes. In the central basin (80°E and 85°E), intraseasonal variability is primarily driven by zonal wind stress anomalies and modulated by a reflected wave process. Energy is transferred to the deep layers via Rossby waves formed by Kelvin waves reflected at the eastern boundary, primarily involving low-order baroclinic modes. Conversely, in the eastern basin (93°E), intraseasonal variability is driven by both zonal and meridional wind stress anomalies and modulated by a direct wave process. Energy is transferred to the deep layers via Yanai waves generated directly west of the current, involving multi-order baroclinic modes. Based on linear wave theory, this study illustrates the energy propagation rays of equatorial beams, emphasizing the critical role of topography in deep circulation dynamics. The flat topography of the central basin facilitates downward and westward energy propagation through reflected wave processes, while the ridge near 90°E may impede downward and eastward energy propagation through direct wave processes. Barotropic conversion (T4) analysis reveals strong nonlinear dynamics near the 90°E ridge, with significant energy transfer from intraseasonal variability to the mean flow. In contrast, over flat topography, the energy transfer is reversed—from the mean flow to intraseasonal variability—though notably weak. This study enhances our understanding of deep current dynamics and provides observational evidence to improve deep ocean circulation simulations.
图2 2015年3月—2021年5月期间TIOON潜标(Q5、Q4、Q2)的纬向流速(a、b、c)和经向流速(d、e、f)的时间序列及其所在观测深度(g、h、i)Fig. 2 Time series of zonal velocity (a, b, c) and meridional velocity (d, e, f) observed by TIOON moorings (Q5, Q4, Q2) in the eastern tropical Indian Ocean, along with their corresponding observation depths (g, h, i) |
表1 TIOON潜标观测点信息及洋流特征统计, 包括地理位置与深度(单位: m)、观测时间范围以及洋流速度, 其中速度包含纬向流速(u; 单位: cm·s−1)以及经向流速(v; 单位: cm·s−1), 数据为平均值±标准差Tab. 1 Summary of TIOON mooring observations and statistical characteristics of zonal (u; units: cm·s−1) and meridional (v; units: cm·s−1) current velocities at each mooring site, including geographical location and depth (units: m), observation time range, and current velocity, with data presented as mean values ± standard deviation of velocities |
| 潜标 | 位置 | 观测深度/m | 地形深度/m | 时间 | 纬向流速u / (cm·s−1) | 经向流速v / (cm·s−1) |
|---|---|---|---|---|---|---|
| Q5 | 0°, 80°E | 4590 | 4677 | 2015年4月5日—2021年5月21日 | 0.2±3.1 | 0.0±2.6 |
| Q4 | 0°, 85°E | 4463 | 4546 | 2015年3月30日—2019年5月4日 | 0.6±2.7 | 0.0±3.1 |
| Q2 | 0°, 93°E | 4394 | 4516 | 2015年5月26日—2019年5月8日 | 0.3±2.5 | 0.0±2.8 |
图3 TIOON潜标Q5、Q4、Q2观测的深层纬向流(a、b、c)和经向流(d、e、f)的小波时频分析振幅图填色表示小波能谱强度(单位: m2·s−2), 用于揭示赤道印度洋深层环流的周期特征及其空间差异。观测数据时间范围为2015年3月至2021年5月, 纵轴为周期(单位: d)的对数坐标, 颜色刻度为线性比例。图中85%(粉色)和90%(品红色)置信水平的等值线用于标示统计上显著的小波信号区域 Fig. 3 Wavelet amplitude spectra of deep zonal currents (a, b, c) and meridional currents (d, e, f) observed by TIOON moorings Q5, Q4, and Q2 in the equatorial Indian Ocean. The analysis reveals the periodic characteristics and spatial variability of deep equatorial circulation. The x-axis represents observation time (from March 2015 to May 2021), and the y-axis indicates the period (in days, shown on a logarithmic scale). Wavelet power is color-shaded on a linear scale. Statistically significant regions are outlined by contours at the 85% (pink) and 90% (magenta) confidence levels |
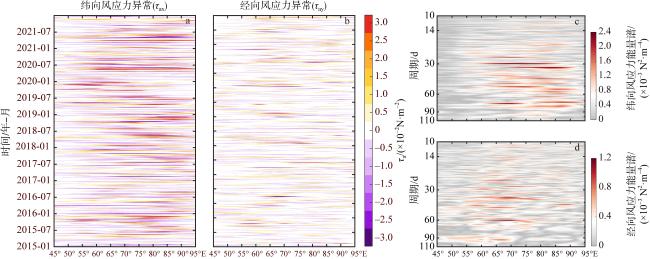
图4 印度洋赤道区域(2°S—2°N)风应力的时间演变和空间分布特征a、b分别为纬向风应力异常τax与经向风应力异常τay时间经度分布图; c、d分别为τax与τay的快速傅里叶变换得到的周期-经度分布图, 颜色表示能谱强度。风应力数据来自JRA-55数据集, 基于2015年1月至2021年12月的逐日风速数据 Fig. 4 Temporal and spatial characteristics of wind stress in the equatorial Indian Ocean (2°S - 2°N). Panels (a, b) show the time-longitude distributions of zonal (τax) and meridional (τay) wind stress anomalies, respectively. Panels (c, d) present the period-longitude distributions of τax and τay derived from fast Fourier transform (FFT), respectively, with colors indicating spectral power. Wind stress data are derived from the JRA-55 reanalysis, based on daily wind fields from January 2015 to December 2021 |
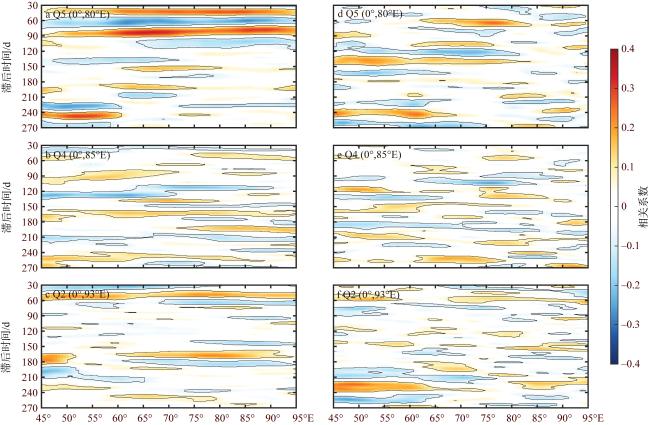
图5 印度洋赤道深层纬向流(基于潜标Q2、Q4、Q5观测)与季节内风应力(源于JRA-55数据集)的滞后相关分析a、b、c展示纬向流与纬向季节内风应力的相关性; d、e、f展示纬向流与经向季节内风应力的相关性; 反映风应力调控赤道印度洋深层纬向环流的时空滞后特征; 图中99%置信水平(即P< 0.01)的等值线(黑色实线)用于标示统计显著的相关性区域 Fig. 5 Lagged correlation between intraseasonal deep zonal currents in the equatorial Indian Ocean (based on mooring observations at Q2, Q4, and Q5) and intraseasonal wind stress (derived from the JRA-55 reanalysis), illustrating the spatiotemporal lag characteristics of wind stress in modulating deep equatorial zonal circulation. Panels (a, b, c) show the correlation between zonal currents with intraseasonal zonal wind stress anomalies; panels (d, e, f) show the correlation between zonal currents with meridional wind stress anomalies. Statistically significant regions are outlined by black contours at the 99% confidence level (P < 0.01) |
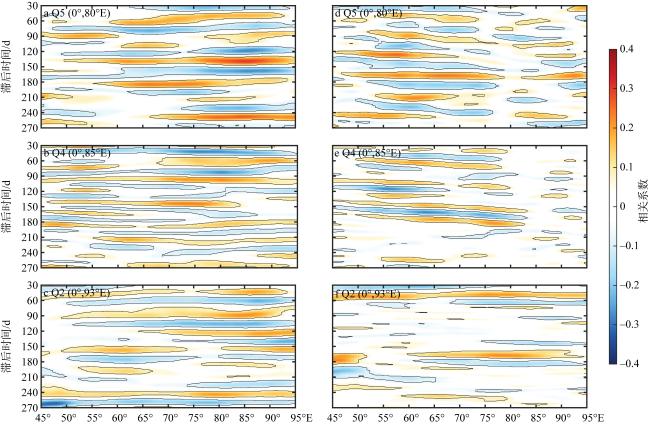
图6 印度洋赤道深层经向流(基于潜标Q2、Q4、Q5观测)与季节内风应力(源于JRA-55数据集)的滞后相关分析a、b、c展示经向流与纬向季节内风应力的相关性; d、e、f展示经向流与经向季节内风应力的相关性; 反映风应力调控赤道印度洋深层经向环流的时空滞后特征; 图中99%置信水平(即P< 0.01)的等值线 (黑色实线)用于标示统计显著的相关性区域 Fig. 6 Lagged correlation between intraseasonal deep meridional flow in the equatorial Indian Ocean (based on mooring observations at Q2, Q4, and Q5) and intraseasonal wind stress (derived from the JRA-55 reanalysis). Statistically significant regions are outlined by black contours at the 99% confidence level (P < 0.01) |
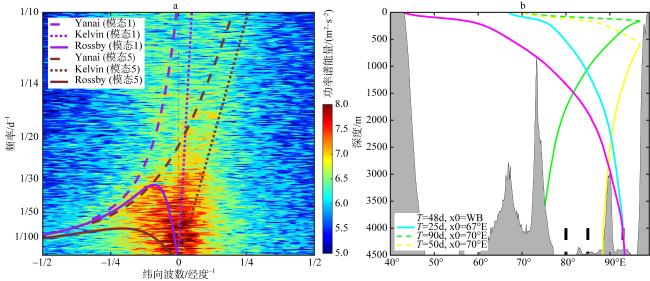
图7 赤道东印度洋季节内纬向流的纬向波数(经度−1)-频率(d−1)功率谱能量(m2·s−2) (a)以及赤道波在印度洋海盆中的理论传播轨迹(b)a. 基于第一和第五斜压模态的赤道波动理论频散关系, 其中包括的Yanai波(虚线)、Kelvin波(点线)以及Rossby波(实线); b. 基于第二斜压模态赤道波理论传播轨迹, 其中x0表示赤道波传播起点经度, WB(western boundary, 西边界), T为典型周期, 灰色阴影区域为海底地形, 黑色条表示观测潜标位置, 从左到右分别为Q2、Q4、Q5 Fig. 7 Zonal wavenumber [1·(°)−1]-frequency (d−1) power spectral density (m2·s−2) of intraseasonal zonal flow in the eastern equatorial Indian Ocean (a) and theoretical propagation trajectories of equatorial waves in the Indian Ocean basin (b). In (a), the theoretical dispersion relationships of equatorial waves are plotted based on the first and fifth baroclinic modes, including Yanai waves (dashed lines), Kelvin waves (dotted lines), and Rossby waves (solid lines). In (b), the theoretical propagation trajectories of equatorial waves are calculated using the second baroclinic mode; the gray shaded areas indicate seafloor topography, and the black bars mark the locations of observation moorings, from left to right: Q2, Q4, Q5; x0: the starting longitude of equatorial wave propagation; WB: western boundary; T: period |
| [1] |
陈更新, 2022. 链接热带东印度洋环流的海洋波动桥梁[J]. 地球科学进展, 37(1): 80-86.
|
| [2] |
|
| [3] |
|
| [4] |
|
| [5] |
|
| [6] |
|
| [7] |
|
| [8] |
|
| [9] |
|
| [10] |
|
| [11] |
|
| [12] |
|
| [13] |
|
| [14] |
|
| [15] |
|
| [16] |
|
| [17] |
|
| [18] |
|
| [19] |
|
| [20] |
|
| [21] |
|
| [22] |
|
| [23] |
|
| [24] |
|
| [25] |
|
| [26] |
|
| [27] |
|
| [28] |
|
| [29] |
|
| [30] |
|
| [31] |
|
| [32] |
|
| [33] |
|
| [34] |
|
| [35] |
|
| [36] |
|
| [37] |
|
| [38] |
|
| [39] |
|
| [40] |
|
| [41] |
|
| [42] |
|
| [43] |
|
| [44] |
|
| [45] |
|
| [46] |
|
| [47] |
|
| [48] |
|
| [49] |
|
| [50] |
|
| [51] |
|
| [52] |
|
| [53] |
|
| [54] |
|
/
| 〈 |
|
〉 |