
基于OC-CCI数据的南海高叶绿素a浓度水域面积的时空变化研究*
|
李傲(1995—), 男, 安徽省六安市人, 硕士研究生, 从事热带海洋动力过程的环境效应研究。email: |
收稿日期: 2021-04-12
修回日期: 2021-07-24
网络出版日期: 2021-07-30
基金资助
中科院先导专项B项目子课题(XDB42010201)
自然资源部第二海洋研究所中央级公益性科研院所基本科研业务费专项资金项目(HYGG2002)
Spatiotemporal variation of water area with high chlorophyll a concentration in the South China Sea based on OC-CCI data*
Received date: 2021-04-12
Revised date: 2021-07-24
Online published: 2021-07-30
Supported by
Subproject B of the Pilot Special Project of the Chinese Academy of Sciences(XDB42010201)
Basic Research Funds of the Second Institute of Oceanology, Ministry of Natural Resources of China(HYGG2002)
浮游植物是海洋生态系统食物链的基础组成, 并通过光合作用影响着海表二氧化碳通量变化。文章基于高叶绿素a浓度水域面积指标构建南海浮游植物生物量的估算体系。利用遥感数据, 采用经验正交函数分解插值方法, 重构长时间序列的南海叶绿素a浓度场, 并研究了南海高叶绿素a浓度水域面积特征的时空分布。结果发现: 高叶绿素a浓度水域面积变化有着显著季节特征, 在冬季面积达到最大值, 在夏季达到最小值, 但是该水域对应的叶绿素a浓度却在冬季达到最小值, 在夏季达到最大值, 这一特征可能是由于风驱动的海表动力过程使得海表叶绿素重新分布; 空间分布上, 高叶绿素a浓度水域常年存在于海岸附近, 特别是在中国沿海、越南沿岸、泰国湾以及婆罗洲岛附近。在巽他陆架与湄公河口东部中央海盆, 高叶绿素a浓度区域面积呈年际变化。受厄尔尼诺调控的南海季风, 导致不同年份湄公河口东南沿海存在不同程度的北部冷水侵入, 北部冷水入侵可能是引起局地浮游植物生物量增减的原因。
关键词: 南海; 浮游植物; 高叶绿素a浓度面积; 时空分布特征; 经验正交函数分解插值方法
李傲 , 冯洋 , 王云涛 , 薛惠洁 . 基于OC-CCI数据的南海高叶绿素a浓度水域面积的时空变化研究*[J]. 热带海洋学报, 2022 , 41(2) : 77 -89 . DOI: 10.11978/2021048
Phytoplankton are the basis of the marine ecosystem food chain, and affect the variation of CO2 flux through photosynthesis. In this study, an estimation system of phytoplankton biomass in the South China Sea was established based on an area indicator. We used the empirical orthogonal function decomposition interpolation method (DINEOF) to reconstruct the chlorophyll a concentration field in the South China Sea from long time series of remote sensing data. We studied the space-time distribution of the high biomass water area of the South China Sea and found that the changes of water area with high chlorophyll a concentration had significant seasonal characteristics. The area of waters with high chlorophyll concentration reached the maximum in winter, and the minimum in summer. Conversely, the chlorophyll concentration reached the minimum in winter, and maximum in summer. This feature may be due to the wind-driven dynamic processes that redistribute the chlorophyll concentration near the surface. Moreover, waters with high chlorophyll concentration were found near the coast year round, especially in coastal waters of China, along the coast of Vietnam, the Gulf of Thailand, and near Borneo Island. In the Sunda Shelf and the central basin east of the Mekong estuary, the area of high biomass water showed interannual variation. The East Asian monsoon modulated by the El Niño and Southern Oscillation led to different degrees of cold water invasion from the north to the southeast of the Mekong Estuary in different years, which may be the reason for the increase and decrease of local phytoplankton biomass.
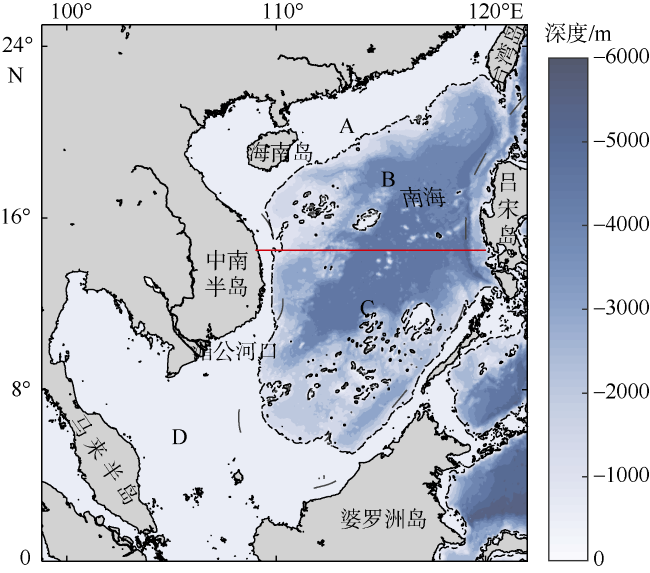
图1 南海地形分布该图基于国家测绘地理信息局标准地图服务网站审图号为GS(2020)4392的标准地图制作。图中黑色虚线为500m等深线, 红色实线为划分南海南北的14°30′纬线。从北向南将南海划分为4个区域, 其中A区域为北部陆架区、B区域为北部海盆区、C区域为南部海盆区、D区域为南部陆架区 Fig. 1 Topographic map of South China Sea. The black dotted line shows the 500 m isobath. The solid red line (14°30′N) separates the South China Sea into north and south parts |
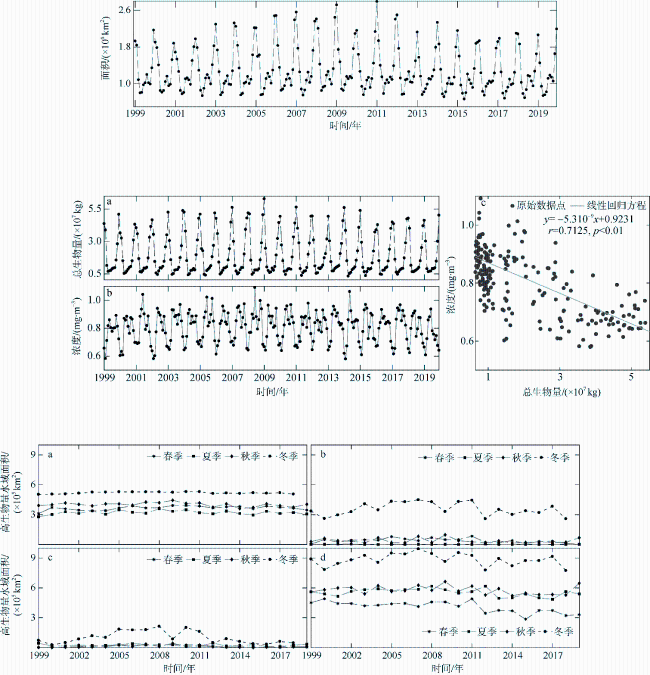
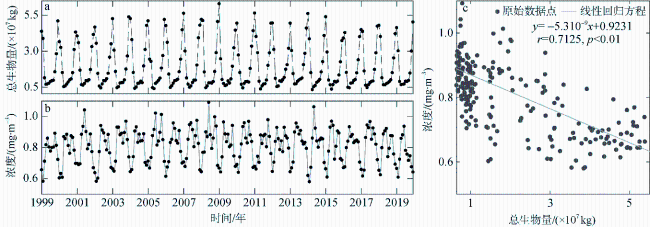
图9 南海高叶绿素a浓度水域的生物量和海表叶绿素a浓度a. 高叶绿素a浓度水域混合层生物量估算值; b. 高叶绿素a浓度水域海表叶绿素浓度; c. 高叶绿素a浓度水域混合层生物量与海表叶绿素浓度回归分析 Fig. 9 Biomass of high chlorophyll a concentration waters and chlorophyll a concentration of high chlorophyll a concentration waters in the South China Sea. (a) estimated biomass of mixed layer in high chlorophyll a concentration waters; (b) the concentration of chlorophyll a on the surface of high chlorophyll a concentration waters; (c) regression analysis between the biomass of the mixed layer and the chlorophyll a concentration at the surface with high chlorophyll a concentration |
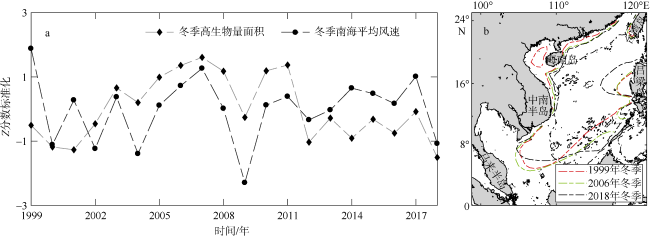
图12 南海冬季高生物量水域面积与风场的标准化时间序列(a)和不同年份海 |
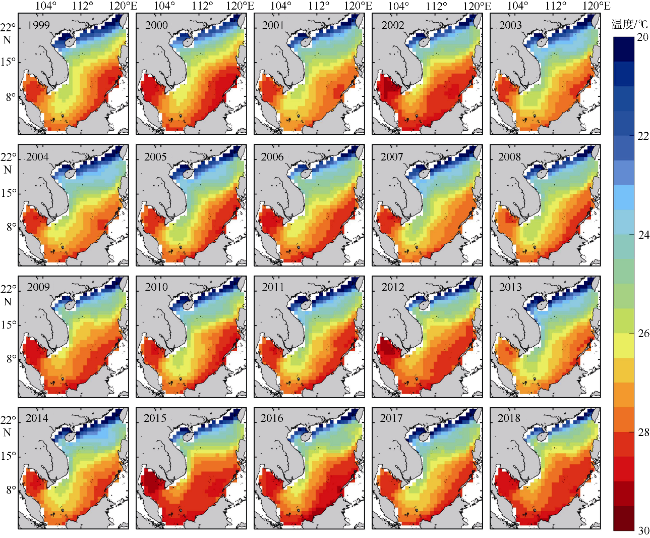
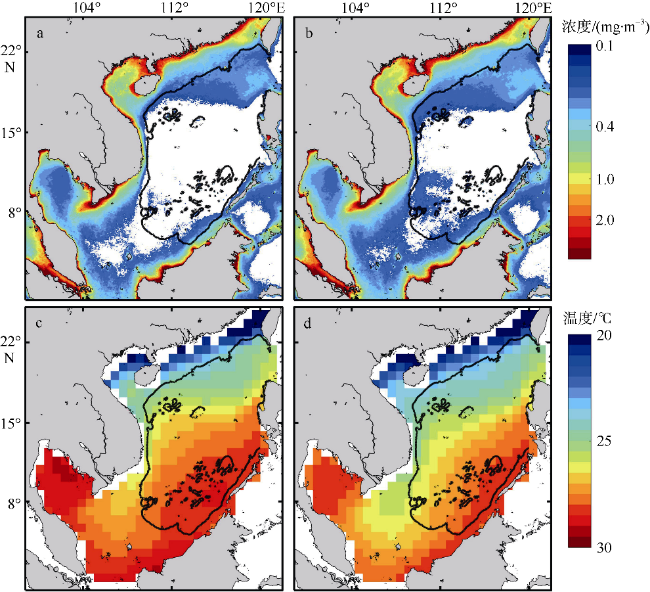
图13 南海冬季海表温度空间分布该图基于国家测绘地理信息局标准地图服务网站审图号为GS(2020)4392的标准地图制作 Fig. 13 Spatial distribution of winter SST in the South China Sea |
*在研究过程中得到中国科学院南海海洋研究所舒婵、房巍巍、梁爱琳、胡晓悦和厦门大学电科学院李波的诸多建议和帮助, 在此表示十分感谢!感谢NASA/Ocean Color网站提供的海洋颜色气候变化倡议(OC-CCI) 5.0版本的海表月平均叶绿素a产品、欧洲气象中心提供的风场与温度数据以及日本海洋-地球科技研究所提供的混合层深度数据。
| [1] |
陈兴群, 陈其焕, 庄亮钟, 1989. 南海中部叶绿素a分布和光合作用及其与环境因子的关系[J]. 海洋学报, 11(3): 349-355.
|
| [2] |
倪晓波, 黄大吉, 2006. 海洋次表层叶绿素最大值的分布和形成机制研究[J]. 海洋科学, 30(5): 58-64, 70.
|
| [3] |
赵辉, 齐义泉, 王东晓, 等, 2005. 南海叶绿素浓度季节变化及空间分布特征研究[J]. 海洋学报, 27(4): 45-52.
|
| [4] |
|
| [5] |
|
| [6] |
|
| [7] |
|
| [8] |
|
| [9] |
|
| [10] |
|
| [11] |
|
| [12] |
|
| [13] |
|
| [14] |
|
| [15] |
|
| [16] |
|
| [17] |
|
| [18] |
|
| [19] |
|
| [20] |
|
| [21] |
|
| [22] |
|
| [23] |
|
| [24] |
|
| [25] |
|
| [26] |
|
| [27] |
|
| [28] |
|
| [29] |
|
| [30] |
|
| [31] |
|
/
| 〈 |
|
〉 |

