
南海海温在两类El Niño衰退期的季节响应差异
作者简介:陈梦燕(1990—), 女, 湖南省岳阳市人, 硕士在读, 主要研究方向为海气相互作用。E-mail:mychen@scsio.ac.cn
收稿日期: 2016-03-02
要求修回日期: 2016-04-17
网络出版日期: 2017-01-19
基金资助
中国科学院国家外国专家局创新团队国际合作伙伴计划
中国科学院战略性先导科技专项(XDA11010403)
国家自然科学基金项目(41376025、41422601、41576012)
Different SST seasonally variability in the South China Sea during the decaying year of the two types of El Niño
Received date: 2016-03-02
Request revised date: 2016-04-17
Online published: 2017-01-19
Supported by
Chinese Academy of Sciences/State Administration of Foreign Experts Affairs (CAS/SAFEA) International Partnership Program for Creative Research Teams, Strategic Priority Research Program of the Chinese Academy of Sciences (XDA11010403)
National Natural Science Foundation of China (41376025, 41422601, 41576012)
Copyright
研究结果发现南海海温对热带太平洋东部型和中部型厄尔尼诺(El Niño) 的季节性响应有明显的时空差异。就时间演变而言和前人研究的结论基本一致: 在两类El Niño事件发展年的冬季和衰退年的夏季, 南海海温都会出现暖海温异常现象。就空间特征而言: 东部型El Niño事件发生后, 南海的第一次增暖中心出现在115°E以西海域, 此后暖海温异常中心会向南海的东部偏移; 第二次增暖发生时, 其最大增暖中心位于110°E以东的海域; 而在中部型El Niño事件时, 南海的两次增暖中心都处在115°E以西海域。南海的风场异常分布不同导致了南海在两类El Niño事件衰退年夏季的暖异常出现空间差异。进一步机理分析表明, 南海在东部型El Niño事件衰退年夏季的增暖主要是受印度洋海盆模态(India ocean basin mode, IOBM)的影响; 而南海在中部型El Niño事件衰退年夏季的增暖主要是由于热带中太平洋暖海温的影响。
关键词: 南海增暖; 东部型El Niño; 中部型El Niño
陈梦燕 , 王鑫 , 刘钦燕 , 谭伟 . 南海海温在两类El Niño衰退期的季节响应差异[J]. 热带海洋学报, 2017 , 36(1) : 1 -8 . DOI: 10.11978/2016024
This study suggests that the sea surface temperature (SST) in the South China Sea (SCS) has different temporal and spatial characteristics in response to the eastern Pacific (EP) El Niño and central Pacific (CP) El Niño. Temporal features are consistent with previous research: the warm SST anomalies located in the SCS during winter of the developing year and summer of the decaying year of El Niño. As for spatial features, the first significant warming peak is confined to the west of 115°E for EP El Niño events, then the warm SST anomaly center propagate to the eastern SCS, and the second warming peak is located to the east of 110°E. But the double warming peaks are limited to the west of 115°E for CP El Niño events. Different wind anomaly fields during the summer of the decaying year of the two types of El Niño led to different locations of the warm SST anomalies in the SCS. Further physical mechanism analysis show that the second significant warming of the SCS SST during the EP El Niño is associated with the India Ocean basin mode, while the second warming during the CP El Niño is under the influence of the CP El Niño.
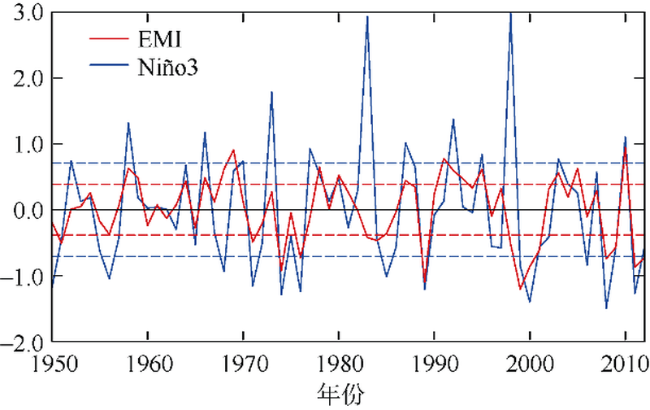
Fig. 1 Time series of the Niño3 (blue solid line) and EMI (red solid line) indices (units: ℃). The blue and red dashed lines indicate the ±0.75 standard deviation of the Niño3 and EMI, which are ±0.71 and ±0.38, respectively图1 Niño3 (蓝色实线)和EMI指数(红色实线)的时间序列(单位: ℃) |
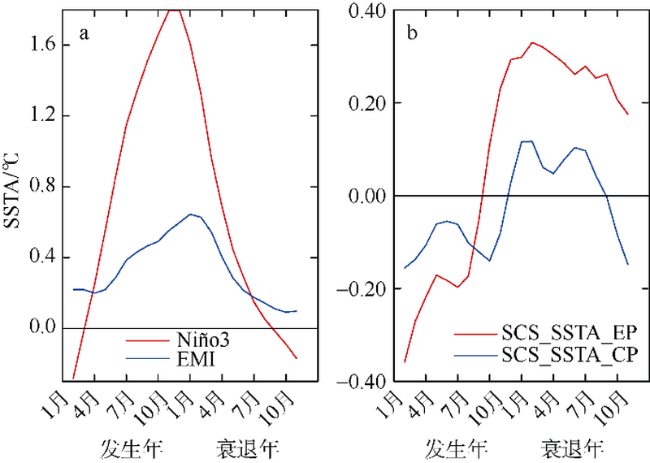
Fig. 2 The three-point running mean of composited Niño3 (red) for eastern Pacific (EP) El Niño events and EMI (blue) for central Pacific (CP) El Niño events (a). The three-point running mean of composited SST anomalies averaged in the SCS for EP (red) and CP (blue) El Niño events (b).图2 Niño3(红色)和EMI(蓝色)指数在东部型和中部型 El Niño事件的发生和衰退年合成的3点滑动平均(a)以及南海区域平均的SSTA在东部型(红色)和中部型(蓝色)El Niño事件时的合成的3点滑动平均(b) |
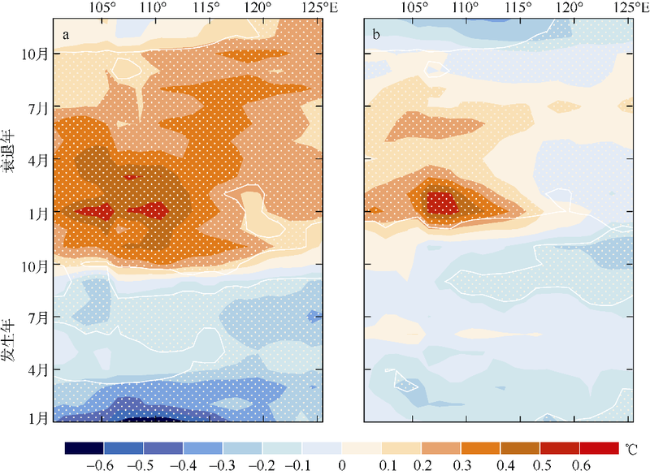
Fig. 3 Composite fields of SCS SST anomalies averaged over latitudes of EP El Niño (a) and CP El Niño events (b). The contour interval is 0.1℃. Stippling indicates the composite exceeding the 90% significance level图3 南海区域在东部型(a)和中部型(b) El Niño时的SSTA合成的经向平均 |
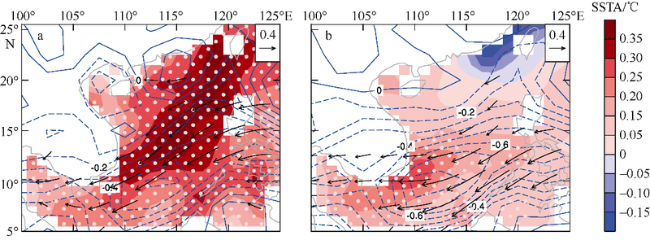
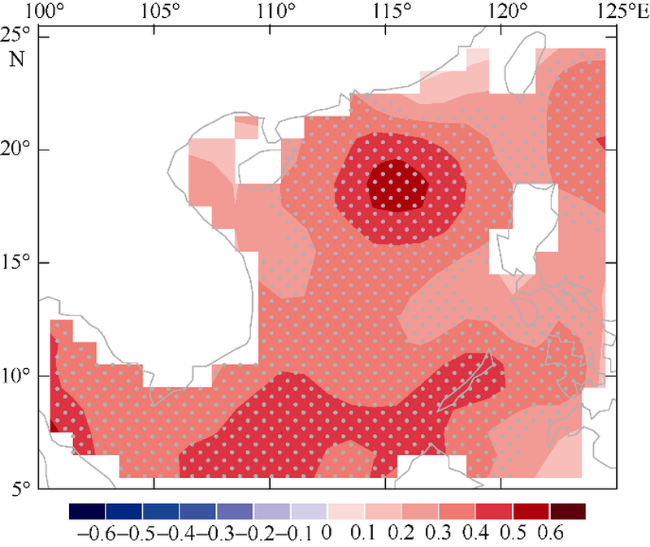
Fig. 4 Composited SCS SST anomalies (shading; ℃), surface wind anomalies (vector; m·s-1) and surface wind speed anomalies (contour; m·s-1) during decaying July- August-September [JAS (+1)] of EP El Niño (left column) and during May-June-July [MJJ (+1)] of CP El Niño (right column). Stippling indicates the composited SSTA exceeding the 90% significance level. Black arrows indicate the surface what greater than 0.2 ms-1. The contour interval is 0.1 ms-1. The solid contour lines indicate positive values, and dashed contour lines indicate negative values图4 南海月平均SSTA, 月平均风场异常合成场(矢量, 单位: m·s-1)和月平均风场异常的标量风速大小(等值线, 单位: m·s-1) |
Fig. 5 Composited India and Pacific Ocean’ SST anomalies (shading; ℃) and surface wind anomalies (vector; m·s-1) during July-August-September [JAS (+1)] of EP El Niño (a) and during May-June-July [MJJ (+1)] of CP El Niño (b). Stippling indicates the composited SSTA exceeding the 90% significance level. Black (gray) arrows indicate the surface what greater (less) than 0.2 m·s-1图5 印度洋和太平洋月平均SSTA和月平均风场异常(矢量, 单位: m·s-1)在东部型El Niño事件衰退年夏末(7、8、9月)(a)和中部型El Niño事件衰退年夏初(5、6、7月)的合成(b) |
Fig. 6 Correlation between July-August-September (JAS) averaged SCS SSTA over what and the IOBM (JAS) index. Stippling indicates the correlation exceeding the 90% significance level图6 南海7、8、9月平均的SSTA和IOBM指数的相关系数空间分布 |
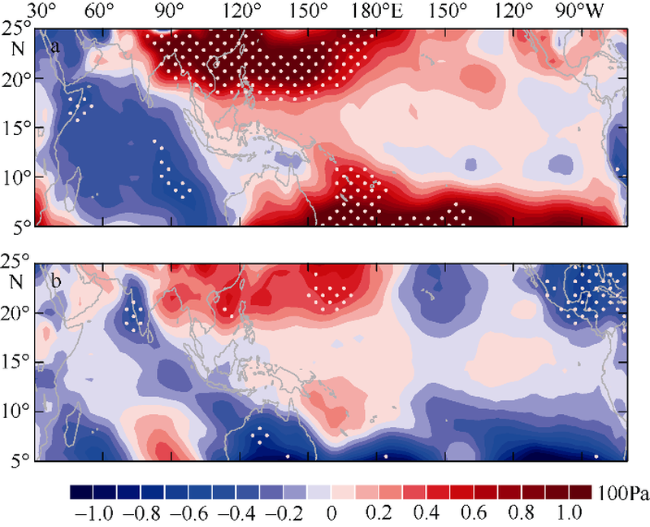
Fig. 7 Composited India and Pacific Ocean’ SLP anomalies (shading; 100 Pa) during July-August-September (JAS (+1)) of EP El Niño (a) and during May-June-July [MJJ (+1)] of CP El Niño (b). Stippling indicates the composited SLP anomalies exceeding the 90% significance level图7 印度洋和太平洋月平均SLP异常在东部型El Niño事件衰退年夏末(7、8、9月)(a)和中部型El Niño事件衰退年夏初(5、6、7月)的合成(b) |
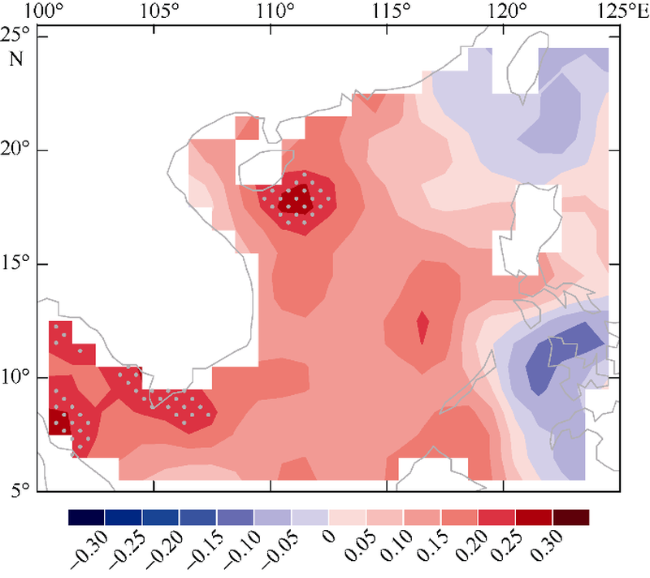
Fig. 8 Correlation between May-June-July (MJJ) averaged SCS SSTA over what and the EMI (MJJ) index. Stippling indicates the correlation exceeding the 90% significance level图8 南海5、6、7月平均的SSTA和EMI(5、6、7月)指数的相关系数空间分布 |
The authors have declared that no competing interests exist.
| [1] |
|
| [2] |
|
| [3] |
|
| [4] |
|
| [5] |
|
| [6] |
|
| [7] |
|
| [8] |
|
| [9] |
|
| [10] |
|
| [11] |
|
| [12] |
|
| [13] |
|
| [14] |
|
| [15] |
|
| [16] |
|
| [17] |
|
| [18] |
|
| [19] |
|
| [20] |
|
| [21] |
|
| [22] |
|
| [23] |
|
| [24] |
|
| [25] |
|
/
| 〈 |
|
〉 |

