
红树林对规则波作用下岸滩剖面变化影响实验研究
作者简介:蒋昌波(1970—), 男, 陕西省石泉县人, 博士, 教授, 主要从事海岸动力过程及其模拟技术研究。E-mail:jcb36@163.com
收稿日期: 2016-01-28
要求修回日期: 2016-06-30
网络出版日期: 2017-01-19
基金资助
国家自然科学基金重点项目(51239001)
国家自然科学基金项目(51409022)
湖南省教育厅科研资助项目(13B130, YB2015B034)
水利部水科学与水工程重点实验室开放研究基金(YK914013)
港口航道泥沙工程交通行业重点实验室开放基金项目
湖南省研究生科研创新项目(CX2015B360)
交通运输部应用基础研究项目(2015319825080)
Experimental study on changes of cross-shore beach profile by regular waves under the influence of mangroves
Received date: 2016-01-28
Request revised date: 2016-06-30
Online published: 2017-01-19
Supported by
Key Projects of National Natural Science Foundation of China (51239001)
National Natural Science Foundation of China (51409022)
Scientific Research Fund of Hunan Provincial Education Department (13B130, YB2015B034)
Program for Key Laboratory of Water Science and Engineering of Ministry of Water Resources (YK914013)
Program for Ministry of Transport Key Laboratory of Port, Waterway and Sedimentation Engineering
Graduate Student Research Innovation Project of Hunan Province (CX2015B360)
Application Basic Research Project of Ministry of Transport (2015319825080)
Copyright
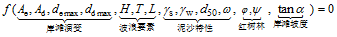
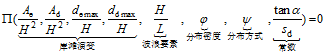
红树林广泛分布于我国南方沿海地区, 可有效减小波浪对岸滩的破坏, 研究其在规则波作用下对岸滩变化的影响具有重要意义。基于波浪水槽实验, 采用PVC圆管模拟红树林, 选取无黏性沙堆砌而成的1/10~1/20组合坡概化岸滩。实验结果表明, 在规则波作用下, 红树林的存在对岸滩剖面变化产生了较大影响; 并分析了规则波波陡、植物分布密度和排列方式对岸滩剖面变化的影响。基于实验数据, 建立了在实验条件下的岸滩冲刷坑尺度、淤积沙坝尺度、最大冲刷深度、最大淤积高度与规则波波陡、红树林的分布密度和排列方式之间的关系式, 结果呈幂指数函数关系。揭示了岸滩剖面变化与规则波水动力特性、红树林、泥沙颗粒和岸滩坡度之间的联系。引入植物综合系数, 预测给定规则波波陡和波长情况下的岸滩冲淤演变特征值, 为海岸生物防护工程的建设提供科学依据。
蒋昌波 , 管喆 , 陈杰 , 肖宇 , 高清洋 , 崔懿秋 , 曹城 . 红树林对规则波作用下岸滩剖面变化影响实验研究[J]. 热带海洋学报, 2017 , 36(1) : 95 -105 . DOI: 10.11978/2016013
Mangroves are widely distributed in the coastal areas of South China, which can effectively reduce the damage by waves to the beach; therefore, it is significant to study the effect of the changes on the beach profile under the influence of regular waves. Based on the wave flume experiment, the PVC tubes are generally chosen to simulate mangroves, and cohesionless sand is selected to generate the beach whose combination slope is 1/10~1/20. The results of the experiment show that when there are mangroves, it has a large influence on the beach slope change under the action of regular waves; and the steepness of regular waves, as well as the distribution density and the arrangement of mangroves, are analyzed. Based on the experimental data, the relationships among the beach erosion scale, deposition scale, the maximum scour depth, the maximum deposition height, and the steepness of regular waves, the distribution density, the arrangement of the mangroves are established, whose relationship is an exponential function. The function reveals the relationship between the variation of beach profile and the hydrodynamic characteristics of regular waves, mangroves, the sediment particles, and the beach slope. With the introduction of the comprehensive coefficient of the plants, the characteristic value of beach erosion and deposition under a given regular wave is predicted, which provides a scientific basis for the construction of coastal protection engineering.
 (3)
(3) (4)
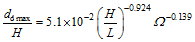
(4)Fig. 1 Experimental setup图1 实验布置图 |
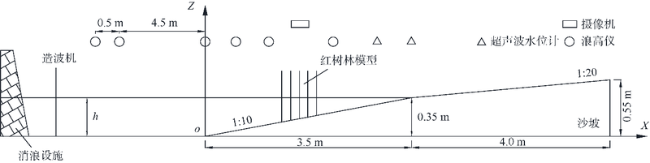
Fig. 2 Design of different models of mangroves图2 植物模型的设计方案 |
Tab. 1 Description of models表1 模型方案说明 |
| 模型 | 植物排列方式 | a、b取值(l=2.5cm) | 植物平均间距/cm | 植物分布密度φ | 植物排列系数 |
|---|---|---|---|---|---|
| M1 | 矩形排列方式 | (a=b=l) | 2.50 | 0.1243 | 60.80 |
| M2 | 矩形排列方式 | (a=2l, b=l) | 3.54 | 0.0621 | 15.16 |
| M3 | 菱形排列方式 | (a=l, b=l) | 2.97 | 0.0475 | 16.44 |
| M4 | 矩形排列方式 | (a=b=2l) | 5.00 | 0.0311 | 3.80 |
Tab. 2 Experiment cases表2 实验工况 |
| 组次 | 模型 | 波高/m | 波陡H/L | 密度φ | 排列系数ψ |
|---|---|---|---|---|---|
| 1 | 无 | 0.06 | 0.0421 | — | — |
| 2 | 无 | 0.09 | 0.0632 | — | — |
| 3 | 无 | 0.12 | 0.0843 | — | — |
| 4 | M1 | 0.06 | 0.0421 | 0.1243 | 60.80 |
| 5 | M1 | 0.09 | 0.0632 | 0.1243 | 60.80 |
| 6 | M1 | 0.12 | 0.0843 | 0.1243 | 60.80 |
| 7 | M2 | 0.06 | 0.0421 | 0.0621 | 15.16 |
| 8 | M2 | 0.09 | 0.0632 | 0.0621 | 15.16 |
| 9 | M2 | 0.12 | 0.0843 | 0.0621 | 15.16 |
| 10 | M3 | 0.06 | 0.0421 | 0.0475 | 16.44 |
| 11 | M3 | 0.09 | 0.0632 | 0.0475 | 16.44 |
| 12 | M3 | 0.12 | 0.0843 | 0.0475 | 16.44 |
| 13 | M4 | 0.06 | 0.0421 | 0.0311 | 3.80 |
| 14 | M4 | 0.09 | 0.0632 | 0.0311 | 3.80 |
| 15 | M4 | 0.12 | 0.0843 | 0.0311 | 3.80 |
Fig. 3 Experimental results on beach profile under the effect of regular waves图3 规则波作用下岸滩剖面变化的实验结果 |
Fig. 4 Experimental results on the variation of regular waves’ height along the beach图4 波高沿程变化实验结果 |
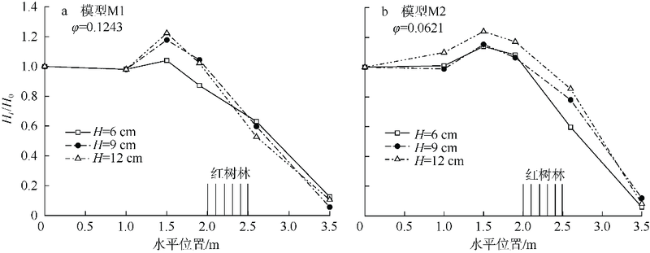
Fig. 5 Comparison of the experimental results under the effects of different heights of regular waves图5 H/L对岸滩剖面变化的影响 |
Fig. 6 Comparison of the experimental results between different densities of mangroves图6 分布密度和排列方式对岸滩剖面变化的影响 |
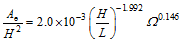
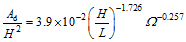
 (5)
(5) (6)
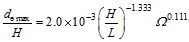
(6) 随着波陡H/L、红树林分布密度φ的增大而减小, 随着排列系数
  随着波陡H/L、排列系数
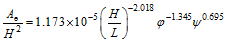
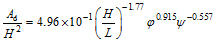
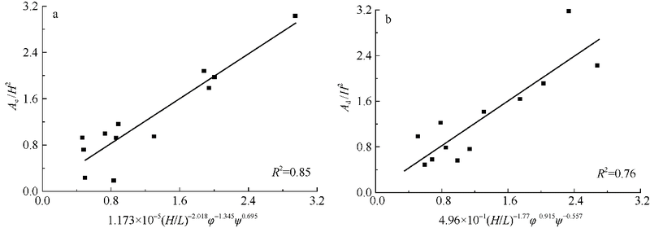
 Fig. 7 The relationship between dimensionless beach erosion / deposition of sand bar and vegetation parameters, dimensionless wave height, dimensionless specific weight parameter, beach slope图7 岸滩冲刷坑/淤积沙坝的尺度与植物、波高、泥沙和岸滩坡度之间的关系 |
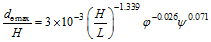 (7)
(7)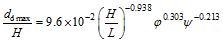 (8)
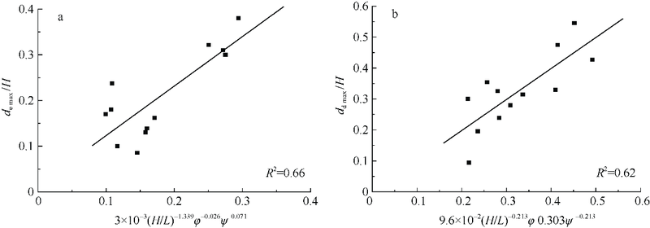
(8)Fig. 8 The relationship between dimensionless maximum depth of beach erosion / deposition and vegetation parameters, dimensionless wave height, dimensionless specific weight parameter, beach slope图8 岸滩最大冲刷/淤积高度与植物、波高、泥沙和岸滩坡度之间的关系 |
Tab. 3 Error analysis of fitting results表3 模拟结果误差分析 |
| 组次 | 岸滩冲刷坑尺度Ae/H2 | 岸滩淤积沙坝尺度Ad/H2 | 最大冲刷深度de max/H | 最大淤积高度dd max/H | ||||||||||||
|---|---|---|---|---|---|---|---|---|---|---|---|---|---|---|---|---|
| 实测值 | 拟合值 | 绝对误差 | 实测值 | 拟合值 | 绝对误差 | 实测值 | 拟合值 | 绝对误差 | 实测值 | 拟合值 | 绝对误差 | |||||
| 4 | 1.976 | 2.005 | 0.030 | 1.913 | 2.030 | 0.117 | 0.380 | 0.294 | 0.086 | 0.475 | 0.415 | 0.060 | ||||
| 5 | 1.163 | 0.885 | 0.278 | 0.564 | 0.990 | 0.426 | 0.162 | 0.171 | 0.009 | 0.239 | 0.284 | 0.045 | ||||
| 6 | 0.237 | 0.495 | 0.258 | 0.488 | 0.595 | 0.107 | 0.100 | 0.116 | 0.016 | 0.094 | 0.217 | 0.122 | ||||
| 7 | 1.788 | 1.942 | 0.154 | 3.181 | 2.331 | 0.850 | 0.310 | 0.271 | 0.039 | 0.545 | 0.452 | 0.093 | ||||
| 8 | 0.924 | 0.857 | 0.067 | 0.761 | 1.137 | 0.377 | 0.130 | 0.158 | 0.028 | 0.280 | 0.309 | 0.029 | ||||
| 9 | 0.722 | 0.480 | 0.242 | 0.580 | 0.684 | 0.103 | 0.180 | 0.107 | 0.073 | 0.196 | 0.236 | 0.040 | ||||
| 10 | 3.033 | 2.947 | 0.086 | 1.641 | 1.744 | 0.103 | 0.300 | 0.275 | 0.025 | 0.330 | 0.410 | 0.080 | ||||
| 11 | 0.947 | 1.300 | 0.353 | 0.787 | 0.851 | 0.064 | 0.139 | 0.160 | 0.021 | 0.326 | 0.280 | 0.046 | ||||
| 12 | 0.995 | 0.728 | 0.267 | 0.986 | 0.511 | 0.474 | 0.238 | 0.109 | 0.129 | 0.300 | 0.214 | 0.086 | ||||
| 13 | 2.079 | 1.882 | 0.197 | 2.225 | 2.676 | 0.451 | 0.322 | 0.251 | 0.071 | 0.427 | 0.492 | 0.065 | ||||
| 14 | 0.190 | 0.830 | 0.641 | 1.417 | 1.306 | 0.111 | 0.086 | 0.146 | 0.060 | 0.314 | 0.336 | 0.022 | ||||
| 15 | 0.930 | 0.465 | 0.465 | 1.224 | 0.785 | 0.439 | 0.170 | 0.099 | 0.071 | 0.354 | 0.257 | 0.097 | ||||
| 误差 统计 | Ae/H2 | Ad/H2 | de max/H | dd max/H | ||||||||||||
| 误差平方和 | 均方根误差 | 误差平方和 | 均方根误差 | 误差平方和 | 均方根误差 | 误差平方和 | 均方根误差 | |||||||||
| 1.101 | 0.303 | 1.730 | 0.380 | 0.047 | 0.063 | 0.062 | 0.072 | |||||||||
 (10)
(10) (11)
(11) (12)
(12) (13)
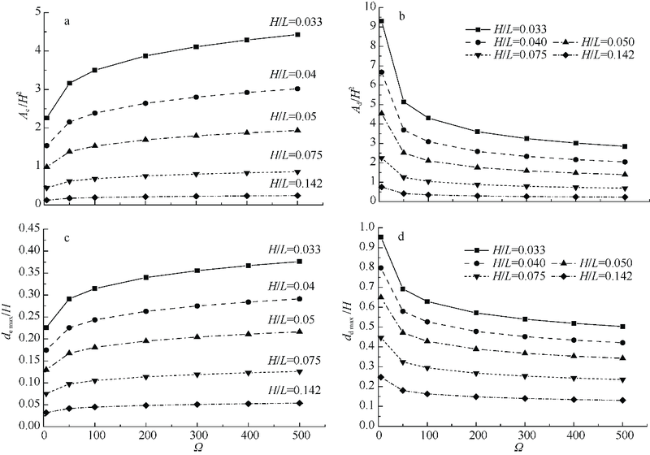
(13)Fig. 9 Prediction results of beach profile’s variation with the plant comprehensive coefficient under a given wave steepness H/L图9 给定波陡H/L下岸滩演变特征值随植物综合系数的预测结果 |
The authors have declared that no competing interests exist.
| [1] |
|
| [2] |
|
| [3] |
|
| [4] |
|
| [5] |
|
| [6] |
|
| [7] |
|
| [8] |
|
| [9] |
|
| [10] |
|
| [11] |
|
| [12] |
|
| [13] |
|
| [14] |
|
| [15] |
|
| [16] |
|
| [17] |
|
| [18] |
|
| [19] |
|
| [20] |
|
| [21] |
|
| [22] |
|
| [23] |
|
| [24] |
|
| [25] |
|
| [26] |
|
| [27] |
|
| [28] |
|
| [29] |
|
| [30] |
|
| [31] |
|
| [32] |
UMROH,
|
/
| 〈 |
|
〉 |


