
单轴抗压强度揭示南海珊瑚骨骼结构的差异*
作者简介:金昱昕(1994—), 女, 华南理工大学海洋工程专业本科生。本文是作者在中国科学院南海海洋研究所边缘海地质重点实验室的科研实习期间完成的工作。E-mail: 243858246@qq.com
收稿日期: 2016-07-27
要求修回日期: 2016-09-26
网络出版日期: 2017-04-06
基金资助
国家重点基础研究发展计划(2013CB956104)
国家自然科学基金项目(41476038、41330642、41372316、41676049)
中国科学院青年创新促进会项目(2015284)
Difference of coral skeletal structure revealed by compressive strength measurements
Received date: 2016-07-27
Request revised date: 2016-09-26
Online published: 2017-04-06
Supported by
National Basic Research Program of China (2013CB956104)
National Natural Science Foundation of China (41476038, 41330642, 41372316 and 41676049)
CAS Youth Innovation Promotion Association (2015284)
Copyright
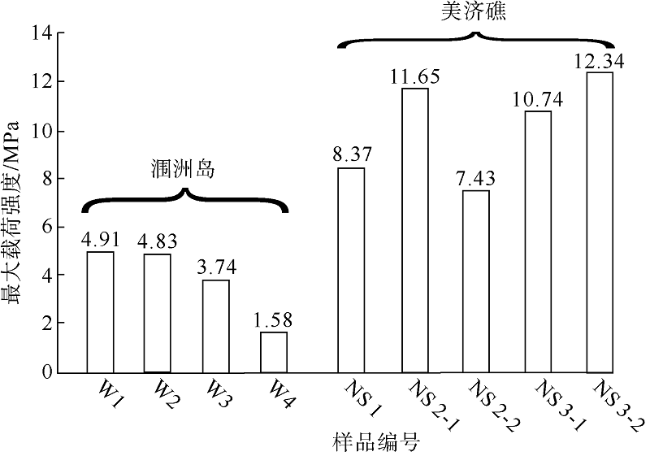
通过单轴抗压强度测试法, 测量南海北部涠洲岛和南部南沙群岛美济礁块状珊瑚骨骼的抗压强度, 将工程力学和珊瑚礁地质生态学相结合, 用定量的数据揭示南海南、北部珊瑚骨骼结构的差异性。结果表明, 美济礁珊瑚的单轴抗压强度近3倍于涠洲岛样品, 显示涠洲岛珊瑚的承载能力相对较弱。南沙群岛海域珊瑚样品的力学性质呈弹性曲线规则变化, 而涠洲岛珊瑚的抗压强度时间曲线呈现不规则变化, 有不断压密、调整、再压密的过程。通过对破坏后样品的观察, 涠洲岛样品的破坏并没有发生在沿生长轴线的方向, 而是在孔洞和骨骼密度小的部位。生物侵蚀加重、孔洞增多导致涠洲岛珊瑚骨骼结构的改变, 进一步导致了珊瑚不仅抗压强度差、承载力下降, 而且力学性质紊乱。该研究工作用定量的数据论证了海水污染对珊瑚骨骼结构改变的影响, 建议开展岛礁工程、生态修复等工作之前的首要任务是保护水质、控制排放、有效治理海水污染。
金昱昕 , 陈天然 , 孟庆山 , 胡敏航 . 单轴抗压强度揭示南海珊瑚骨骼结构的差异*[J]. 热带海洋学报, 2017 , 36(2) : 33 -39 . DOI: 10.11978/2016071
In this study, we measured compressive strength in coral samples from Weizhou Island, northern South China Sea, and the Meiji Reef, the Nansha Islands, southern South China Sea, using uniaxial compressive strength experiments. Differences in coral skeletal structure were revealed using these data, coral reef geological and ecological methods, and the engineering mechanics. The results showed that the uniaxial compressive strength of Meiji corals is approximately three times higher than that of Weizhou corals, indicating that Weizhou corals’ carrying capacity is relatively low. The mechanical properties of Nansha corals showed a character of elastic curve, with a short stage of yield and good ductility. On the contrary, the compressive strength of Weizhou corals has an irregular changing elastic curve character, with multiple compression processes. Based on the observations on the broken samples after compressive experiments, Weizhou samples were not broken on the growth direction of the axis, but in the area of small holes and low density. Increased bioerosion caused changes in the structure of Weizhou coral skeletons, and subsequently poor compressive strength, low bearing capacity, and chaotic mechanical properties. This work demonstrates the effect of water pollution on coral skeletal structure. We suggest that priority should be given to seawater quality protection and control before reef project and coral ecological restoration.
Key words: compressive strength; coral; skeletal structure; bioerosion; South China Sea
Fig. 1 Map of study sites (a) and coral sampling locations. Sites 1, 2, 3, and 4 are located around Weizhou Island, northern South China Sea (b); Site 5 is located on the Meiji Reef of the Nansha Islands (c)图1 研究区域的地理位置(a)以及南海北部涠洲岛(b) 和南沙群岛美济礁(c)上的珊瑚样品的采样点(▲) |
Fig. 2 Cylindrical coral samples used in the experiment. a: W1, b: W2, c: W3, d: W4, e: NS 1, f: NS2-1, g: NS2-2, h: NS3-1, and i: NS3-2. Labels use “Location abbreviations (W: Weizhou Island; NS: Nansha) + sampling sites - sampling number (no for without duplicates).” Coin is used as the scale for 25-mm-diameter图2 实验所用的珊瑚柱状样品 |
Tab. 1 Uniaxial compressive experiment data表1 单轴抗压实验数据 |
| 编号 | 珊瑚种属 | 采样地点 | 抗压强度/MPa | 平均值/MPa | 弹性模量/GPa | 泊松比 |
|---|---|---|---|---|---|---|
| W1 | 蜂巢珊瑚 | 1 | 4.91 | 3.76 | 2.259 | 0.191 |
| W2 | 滨珊瑚 | 2 | 4.83 | 1.368 | 0.100 | |
| W3 | 滨珊瑚 | 3 | 3.74 | 3.218 | 0.415 | |
| W4 | 滨珊瑚 | 4 | 1.58 | 2.070 | 0.064 | |
| NS1 | 滨珊瑚 | 5 | 8.37 | 10.11 | 6.591 | 0.330 |
| NS2-1 | 滨珊瑚 | 5 | 11.65 | 4.883 | 0.101 | |
| NS2-2 | 滨珊瑚 | 5 | 7.43 | 2.973 | 0.023 | |
| NS3-1 | 滨珊瑚 | 5 | 10.74 | 7.490 | 0.048 | |
| NS3-2 | 滨珊瑚 | 5 | 12.34 | 6.909 | 0.063 |
Fig. 3 Histogram of the compressive strength图3 抗压强度柱状图 |
Fig. 4 Profiles of compressive strength time series in Nansha (a) and Weizhou (b) coral samples. Photos on the right are broken corals after compressive experiments. The red dotted lines indicate stages of compression in the process. The time series curves of all Nansha corals are consistent, so we use a solid line to indicate the average value and use shading to show their variation range. In contrast, the curves for the Weizhou coral samples are inconsistent, so we display all of them in the figure.图4 南沙(a)和涠洲岛(b)珊瑚样品的抗压强度时间曲线图 |
The authors have declared that no competing interests exist.
| 1 |
|
| 2 |
|
| 3 |
|
| 4 |
|
| 5 |
|
| 6 |
|
| 7 |
|
| 8 |
|
| 9 |
|
| 10 |
|
| 11 |
|
| 12 |
|
| 13 |
|
| 14 |
|
| 15 |
|
| 16 |
|
| 17 |
|
| 18 |
|
| 19 |
|
| 20 |
|
| 21 |
|
| 22 |
|
| 23 |
|
| 24 |
|
| 25 |
|
| 26 |
|
| 27 |
|
| 28 |
|
| 29 |
|
| 30 |
|
| 31 |
|
/
| 〈 |
|
〉 |


