
基于梯度信息的微波辐射亮温资料质量控制方法
作者简介:马刚(1972—), 男, 北京人, 博士, 副研究员, 主要从事卫星资料质量控制与同化研究。E-mail: magang@cma.gov.cn
收稿日期: 2016-05-10
要求修回日期: 2016-12-13
网络出版日期: 2017-04-06
基金资助
公益性行业(气象)科研专项(GYHY201506002、GYHY201506022)
国家自然科学基金项目(41375106)
A quality control method based on gradient information of microwave radiation data AMSU-A
Received date: 2016-05-10
Request revised date: 2016-12-13
Online published: 2017-04-06
Supported by
Public Science and Technology Research Funds Projects of Meteorology (GYHY201506002, GYHY201506022)
National Natural Science Foundation of China (41375106)
Copyright
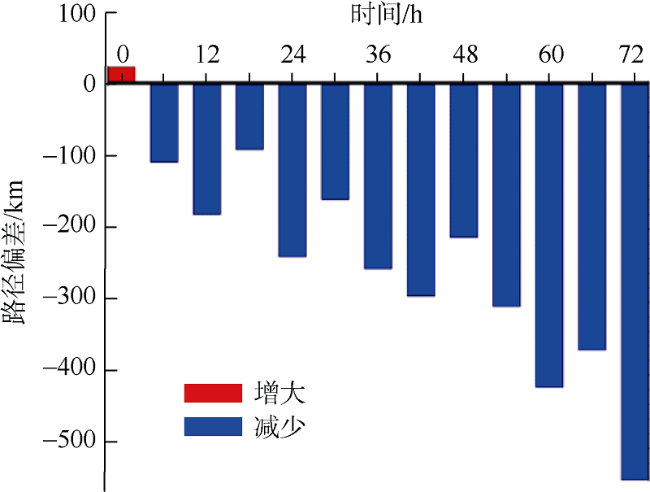
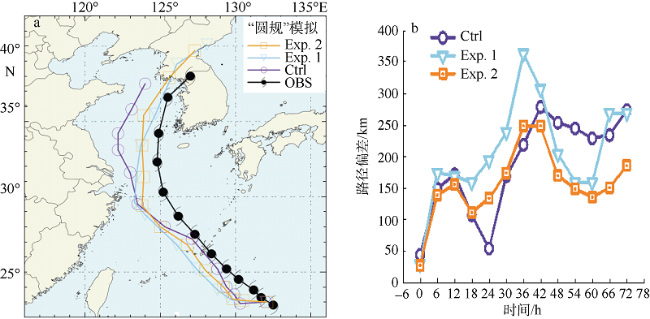
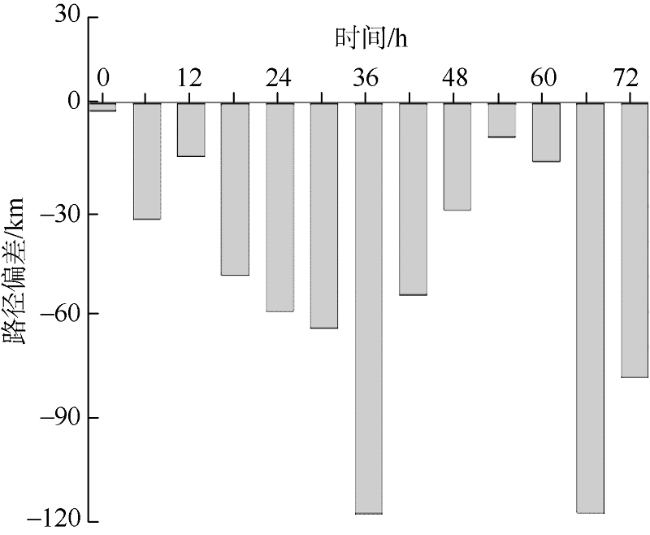
卫星微波垂直探测器的辐射观测资料在数值预报中的同化应用使得数值预报水平有了巨大的飞跃。微波资料的质量控制是保证观测资料成功同化的关键所在。文章提出一种基于AMSU-A(Advanced Microwave Sounding Unit-A)辐射亮温资料梯度信息的新质量控制方法, 将亮温梯度距平值明显较大的资料作为被降水污染或因为其他原因出现的“坏”的资料。利用中尺度非静力WRF(Weather Research and Forecasting)模式和区域三维变分同化, 针对“海鸥”(2008)和“圆规”(2010) 2个个例, 对比旧质量控制中的降水检测和阈值检测方法, 评估该方法用于AMSU-A资料同化时对台风数值模拟的情况。研究表明, 旧质量控制方法将会使一些“坏”的微波观测资料同化进入模式, 降低模式分析场的质量, 进而导致同化结果有较大误差。相对于旧方法获得的分析场, 利用基于亮温梯度信息的质量控制方法可使更多“坏”的观测剔除, 同化后模式初始时刻的位势高度场和风场更接近于真实情况。与传统AMSU-A辐射资料的同化相比, 新质量控制方案使2个台风路径数值模拟的偏差有明显的减小: “海鸥”个例中, 模拟台风路径误差的最大改善比为12, 路径误差改善约540km; “圆规”个例的最大改善比为13, 模拟路径误差减小118km。
马刚 , 王云峰 , 张晓辉 , 顾成明 , 钟波 , 郭兴亮 . 基于梯度信息的微波辐射亮温资料质量控制方法[J]. 热带海洋学报, 2017 , 36(2) : 86 -95 . DOI: 10.11978/2016049
Quality control (QC) is a key for microwave sounding radiance data assimilation in numerical weather prediction (NWP) models. In this study, a new approach of QC for Advanced Microwave Sounding Unit-A (AMSU-A) radiance was developed by introducing brightness temperature gradient of view point. In this approach, the data were considered to be contaminated by precipitation if their gradients were anomalously large, and would be discarded. Two typhoon cases, Kalmaegi in 2008 and Kompasu in 2010, were simulated by WRF (Weather Research and Forecasting) model to see the impacts of the new QC method on AMSU-A radiance. In the new QC cases, as the contaminated data removed from the three-dimensional variational assimilation (3DVar), the tracks of both typhoons were much closer to the observations due to the increments of initial geopotential height and wind fields. In addition, the typhoons’ intensities were much closer to the observations with more reasonable temperature field for the warm structure of typhoon core development. In the original cases, with much more contaminated AMSU-A radiance in WRF, both typhoons’ tracks and intensities were much worse simulated. An improvement ratio to simulated track error was 12, that is an improvement to 540 km compared to the track without AMSU-A radiance assimilated, in the Kalmaegi case. And the ratio was 13 with 118 km improvement to simulated track in the Kompasu case.
 的定义(王云峰 等, 2013):
 (1)
(1) (2)
(2) 为梯度信息的距平,
  为梯度的平均值, 定义为
  。假设梯度信息的距平值大于阈值ε的时候, 对应的卫星观测是“坏”值, 即当
  时, TBi和 TBi+1都将被删除。
Tab. 1 Threshold value of quality control based on AMSU-A gradient information along the scan line表1 AMSU-A资料基于沿扫描线方向梯度信息质量控制的阈值统计 |
| 卫星平台 | 通道 | 阈值 |
|---|---|---|
| NOAA-15 | 5 | 0.304 |
| 6 | 0.193 | |
| 7 | 0.207 | |
| 8 | 0.191 | |
| 9 | 0.164 | |
| NOAA-16 | 5 | 0.432 |
| 6 | 0.231 | |
| 7 | 0.169 | |
| 8 | 0.236 | |
| 9 | 0.188 | |
| NOAA-18 | 5 | 0.389 |
| 6 | 0.264 | |
| 7 | 0.283 | |
| 8 | 0.270 | |
| 9 | 0.187 |
 )产生较大的影响。
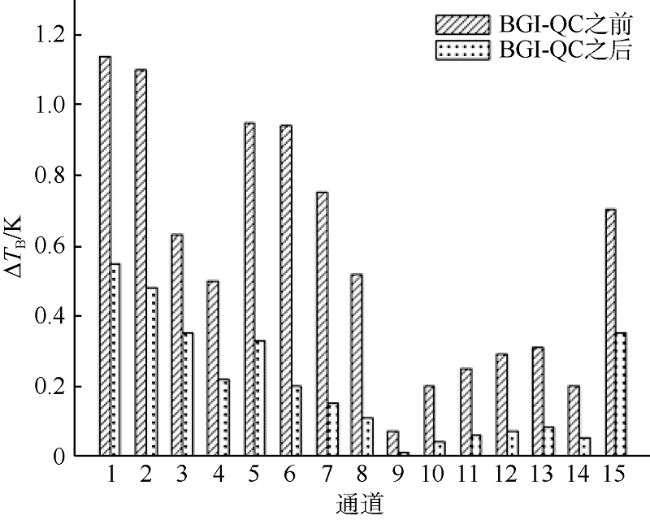
 的分布情况。从图中可以看出, 采用BGI_QC后的
  要远远小于采用BGI_QC前的
  , 说明进入同化的AMSU-A资料均一性较好, 也说明对于受降水等因素影响而出现亮温水平梯度偏差值较大的“坏”的观测, 采用BGI_QC方法能够有效去除。
Fig. 1 The mean gradient of all AMSU-A channels of NOAA-16 with BGI_QC and without BGI_QC图1 采用BGI_QC前后NOAA-16 AMSU-A通道的水平梯度信息的平均值 |
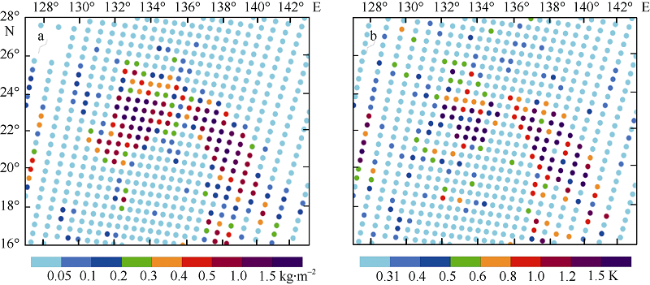
Fig. 2 CLW (a) and horizontal gradient anomalies with respect to brightness temperature of NOAA-18 AMSU-A along its scanning direction (b)图2 CLW分布(a)与NOAA-18 AMSU-A 通道5沿扫描方向的水平梯度距平分布(b) |
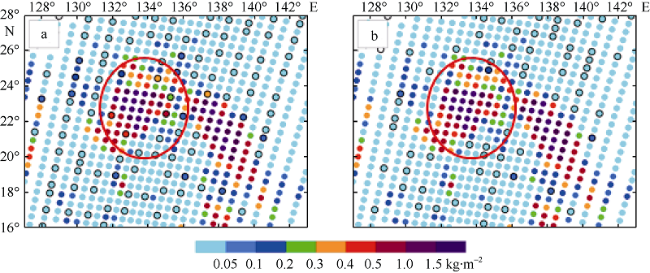
Fig. 3 CLW and brightness temperature with respect to channel 5 of NOAA-18 AMSU-A. Small circles indicate satellite data used in assimilation. Big red circle denotes the area used for comparison. a) Without BGI_QC; and b) with BGI_QC)图3 CLW分布情况和NOAA-18 AMSU-A5通道卫星亮温资料的分布 |
Tab. 2 Numerical experimental designs表2 试验方案设计 |
| 试验方案 | 形成模式初始场所用的资料 | 质量控制方法 |
|---|---|---|
| Ctrl | NCEP GFS | 没有QC |
| Exp.1 | NCEP GFS +AMSU-A | WRFDA_QC |
| Exp.2 | NCEP GFS + AMSU-A | BGI_QC_X + WRFDA_QC |
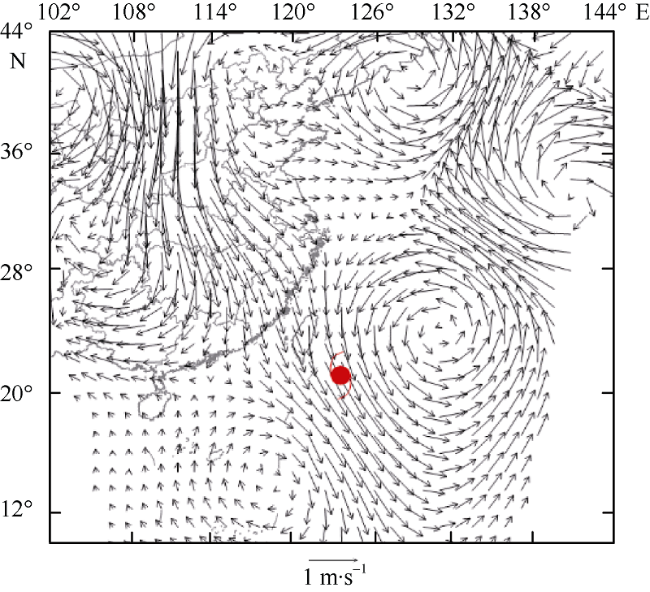
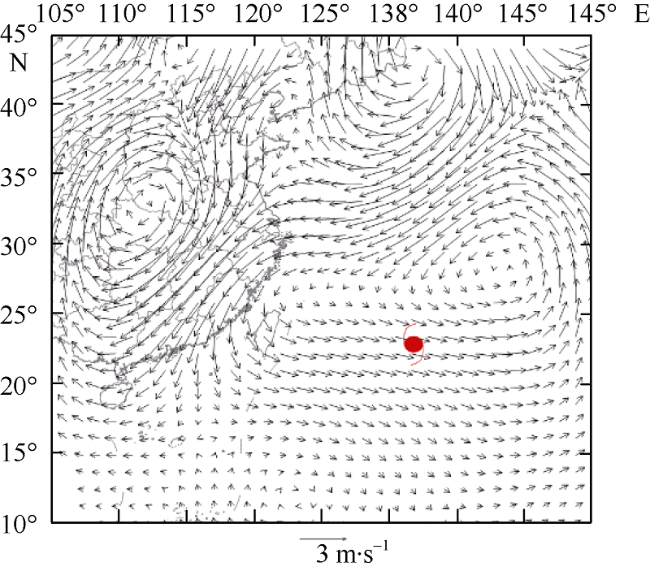
Fig. 4 Increment to wind field at 500 hPa between Exp.2 and Exp.1图4 Exp.2与Exp.1中的500hPa 风场增量分布 |
Fig. 5 Meridional section to increments between Exp.2 and Exp.1 along 21°18°N. a) Geopotential height (units: m); and b) temperature (units: K)图5 Exp.2与Exp.1的物理量增量沿21°18°N的经向垂直剖面 |
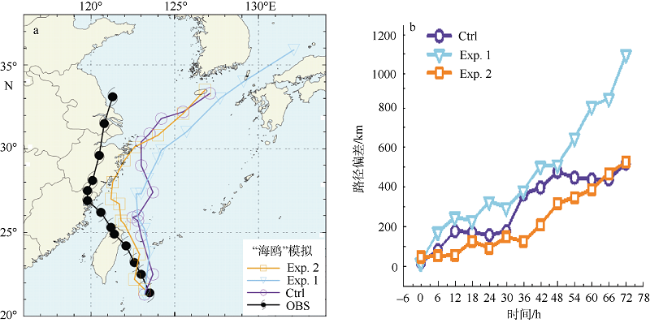
Fig. 6 Comparison of simulated tracks and observations for Typhoon Kalmaegi. a) Simulated typhoon tracks by all three experiments; and b) departures of the simulated tracks from observations图6 各试验方案模拟的台风预报路径情况与实况的对比 |
Fig. 7 Improvement to predicted typhoon track by Exp.2 with respect to Exp.1 for Typhoon Kalmaegi图7 Exp.2与Exp.1对台风路径预报的“改善比” |
Fig. 8 Increment to wind field at 500 hPa to Exp.2 and Exp.1图8 初始时刻Exp.2与Exp.1中的500hPa 风场增量分布 |
Fig. 9 Meridional sections to increments between Exp.2 and Exp.1 along 22°48°N. a) Geopotential height (units: m); and b) temperature (units: K)图9 Exp.2与Exp.1中的物理量增量沿22°48°N的经向垂直剖面 |
Fig. 10 Comparison of simulated tracks and observations for Typhoon Kompasu. a) Simulated typhoon tracks by all three experiments; and b) departures to the simulated tracks with respect to observations图10 各组试验模拟的台风路径与实况间的对比图(a)及其偏差情况(b) |
Fig. 11 Improvement of predicted typhoon tracks by Exp.2 to Exp.1 for Typhoon Kompasu图11 Exp.2与Exp.1预报路径误差的“改善比” |
The authors have declared that no competing interests exist.
| 1 |
|
| 2 |
|
| 3 |
|
| 4 |
|
| 5 |
|
| 6 |
|
| 7 |
|
| 8 |
|
| 9 |
|
| 10 |
|
| 11 |
|
| 12 |
|
| 13 |
|
| 14 |
|
| 15 |
|
| 16 |
|
| 17 |
|
| 18 |
|
| 19 |
|
| 20 |
|
| 21 |
|
| 22 |
|
/
| 〈 |
|
〉 |


