
海浪混合作用对热带海洋海表面温度模拟的影响*
作者简介:刘子龙(1991—), 男, 湖南省常德市人, 硕士研究生, 研究方向为海洋动力学与数值模拟。E-mail:941117242@qq.com
收稿日期: 2016-12-10
要求修回日期: 2017-03-22
网络出版日期: 2017-07-26
基金资助
国家自然科学基金(41676014)
Response of tropical SST to non-breaking surface wave-induced vertical mixing in a climate model
Received date: 2016-12-10
Request revised date: 2017-03-22
Online published: 2017-07-26
Supported by
National Natural Science Foundation of China (41676014)
Copyright
赤道太平洋冷舌模拟偏低且过于西伸是一个共性问题。基于特征波参数化理论, 利用美国国家环境预报中心(National Centers for Environmental Prediction, NCEP)再分析风场驱动海浪模式WAVEWATCH Ⅲ模拟所得的有效波高、波周期、波长等海浪要素, 计算出海浪混合作用引起的垂直涡动动量系数和热混合系数, 将其引入到SBPOM(Stony Brook Parallel Ocean Model)环流模式的动量控制方程中, 由此探究海浪混合作用对热带海洋海表面温度模拟的影响。初步数值模拟研究结果表明, 海浪混合作用的考虑, 有效地改进了环流模式模拟热带海洋海表面温度偏低和赤道冷舌偏冷且过于西伸的现象, 使得环流模式对热带海洋的模拟效果更好。
关键词: 海浪混合; WAVEWATCH Ⅲ; SBPOM; 赤道冷舌; 海表面温度
刘子龙 , 史剑 , 蒋国荣 , 肖林 . 海浪混合作用对热带海洋海表面温度模拟的影响*[J]. 热带海洋学报, 2017 , 36(4) : 77 -86 . DOI: 10.11978/2016129
One of common problems of climate models is that the simulated sea surface temperature (SST) deviates noticeably from the observation in the tropics, such as the equatorial cold tongue in the eastern Pacific. Based on the theory of the parameterization of feature waves, the National Centers for Environmental Prediction (NCEP) reanalysis wind data were used to drive the WAVEWATCH Ⅲ to simulate the process of ocean waves in the tropics, and significant wave height, wave period and wavelength can be obtained. These wave parameters were used to calculate the vertical vortex momentum coefficient and thermal mixing coefficient, which were introduced to the controlling equation of SBPOM (Stony Brook Parallel Ocean Model), and to explore the effects of non-breaking surface wave-induced vertical mixing on the SST simulation in the tropics. The simulation results showed that by considering the non-breaking surface wave-induced vertical mixing, the simulated SST in the tropics and the equatorial Pacific cold tongue were improved effectively, and the accuracy of simulated SST in the tropics has been enhanced.
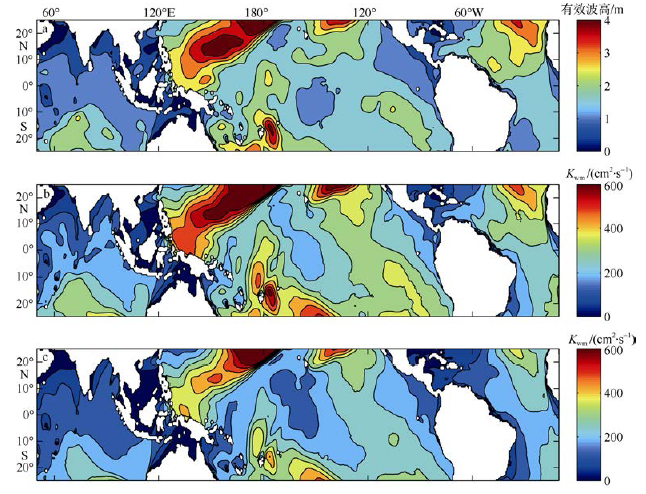
Fig. 1 Spatial distributions of yearly mean simulated significant wave height and Kwm图1 年平均模拟有效波高和Kwm的空间分布 a. 有效波高空间分布; b. 海表Kwm空间分布; c. 5m水深处Kwm空间分布 |
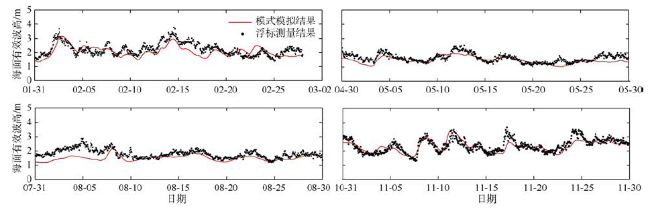
Fig. 2 Comparison of simulation significant wave height with the data from buoy 41041图2 41041号浮标处有效波高模拟值和测量值对比图 |
Fig. 3 Comparison of simulation significant wave height with data from Buoy 51003图3 51003号浮标处有效波高模拟值和测量值对比图 |
Tab. 1 Error analysis of simulated significant wave height表1 模拟有效波高误差分析 |
| 浮标站号 | 均方根相对误差/% | 相关系数 | ||||||
|---|---|---|---|---|---|---|---|---|
| 2月 | 5月 | 8月 | 11月 | 2月 | 5月 | 8月 | 11月 | |
| 41041 | 18.69 | 18.02 | 23.45 | 20.51 | 0.88 | 0.92 | 0.86 | 0.89 |
| 41043 | 17.97 | 18.03 | 14.04 | 17.48 | 0.90 | 0.91 | 0.87 | 0.85 |
| 51003 | 24.56 | 23.73 | 18.17 | 20.20 | 0.84 | 0.78 | 0.81 | 0.80 |
| 51101 | 21.76 | 19.89 | NaN | 20.02 | 0.88 | 0.87 | NaN | 0.82 |
| 52202 | 20.29 | 23.84 | 21.18 | 21.40 | 0.89 | 0.86 | 0.90 | 0.84 |
| 52211 | 23.79 | 20.52 | 22.67 | NaN | 0.83 | 0.83 | 0.85 | NaN |
| 样本数N | 672 | 744 | 744 | 720 | 672 | 744 | 744 | 720 |
| 平均 | 21.18 | 20.67 | 19.90 | 19.92 | 0.87 | 0.86 | 0.86 | 0.84 |
注: NaN表示浮标因某些异常原因而未能进行测量或测量数据较少的月份 |
Fig. 4 Comparison of simulation significant wave height with ECMMWF reanalysis data in the tropical ocean图4 模式模拟热带海洋有效波高和ECMMWF再分析资料散点图 |
Tab. 2 Comparison of simulation significant wave height with ECMMWF reanalysis data in the tropical ocean表2 模式模拟热带海洋有效波高和ECMWF再分析资料对比表 |
| 时间 |  |  | 偏度/m | 均方根相对误差/% | 相关 系数 |
|---|---|---|---|---|---|
| 02-28 18时 | 1.809 | 1.871 | 0.062 | 16.38 | 0.923 |
| 05-30 18时 | 1.817 | 2.017 | 0.200 | 15.52 | 0.943 |
| 08-30 18时 | 1.773 | 1.823 | 0.050 | 13.32 | 0.927 |
| 11-30 18时 | 1.820 | 1.926 | 0.126 | 17.53 | 0.903 |
| 平均 | 1.805 | 1.909 | 0.104 | 15.69 | 0.924 |
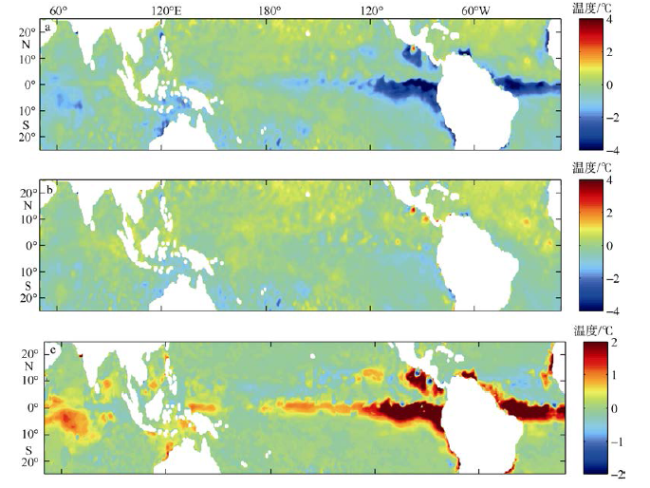
Fig. 5 Spatial distribution of yearly mean SST in the tropical ocean图5 年平均SST在热带海洋的空间分布 a. ECMWF再分析资料SST; b. 试验1模拟SST; c. 试验2模拟SST |
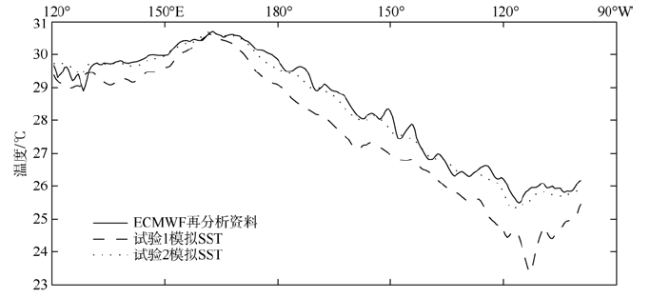
Fig. 6 Changes of yearly mean SST with longitude in the tropical ocean图6 赤道年平均SST随经度的分布图 |
Fig. 7 Spatial distributions of yearly mean SST deviations and α in the tropical ocean图7 年平均SST差值和改善量a在热带海洋的空间分布 a. 试验1模拟SST相对于ECMWF再分析SST的变化量; b. 试验2模拟SST相对于ECMWF再分析SST的变化量; c. 改善量α分布 |
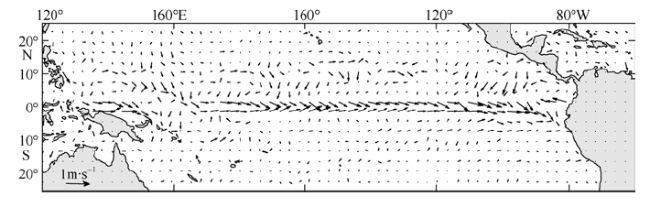
Fig. 8 Yearly mean currents differences of Exp 2 with respect to Exp 1图8 试验2相对试验1的年平均海面流场差分布图 |
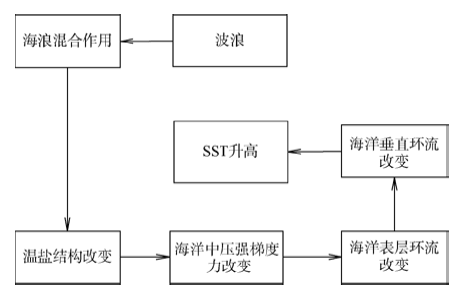
Fig. 9 Schematic for the responses of SST anomaly to the wave-induced mixing图9 海浪混合作用对SST模拟影响示意图 |
The authors have declared that no competing interests exist.
| [1] |
|
| [2] |
|
| [3] |
|
| [4] |
|
| [5] |
|
| [6] |
|
| [7] |
|
| [8] |
|
| [9] |
|
| [10] |
|
| [11] |
|
| [12] |
|
| [13] |
|
| [14] |
|
| [15] |
|
| [16] |
|
| [17] |
|
| [18] |
|
| [19] |
|
| [20] |
|
| [21] |
|
| [22] |
|
/
| 〈 |
|
〉 |


