
考虑飞沫影响的拖曳系数方案对台风条件下上层海洋海温数值模拟的影响
作者简介:刘霄燕(1991—), 女, 新疆维吾尔自治区乌鲁木齐市人, 在读物理海洋学方向研究生。E-mail: liu_xiaoyan_sophie@126.com
收稿日期: 2016-10-20
要求修回日期: 2017-04-13
网络出版日期: 2017-09-22
基金资助
国家重点基础研究计划(“973”)项目(2013CB430305)
The influence of a new drag coefficient scheme considering sea spay on numerical simulation of upper-ocean temperature response to tropical cyclone
Received date: 2016-10-20
Request revised date: 2017-04-13
Online published: 2017-09-22
Supported by
National Program on Key Basic Research Project (973) Program (2013CB430305)
Copyright
为了提高对上层海洋的模式模拟准确性, 为台风海气耦合模式提供更加合理的动量交换耦合方案, 文章应用一个分粒径段的海洋飞沫函数给出一个新的海面拖曳系数CD计算方案, 它体现了台风高海况条件下海洋飞沫层使海面拖曳系数数值减小特点。论文以2014年第15号台风“海鸥”经过南海强化观测区域时段作为个例, 应用POM(Princeton Ocean Model)三维海洋环流模式进行数值模拟试验, 结果发现低风速情况下, 考虑海洋飞沫因素后的CD与传统计算方案数值相近, 在高风速情况下, 考虑海洋飞沫因素后的CD方案与模式传统计算方案不同, 表现出随风速增长趋缓, 直至随风速略有下降现象。与传统拖曳系数方案相比, 采用新的拖曳系数方案后, 模拟的台风条件下上层海洋的温度降温幅度、混合层深度加深幅度、温跃层强度减弱程度都略有减弱, 这些模拟特征与观测事实更加接近。
刘霄燕 , 李永平 , 段自强 . 考虑飞沫影响的拖曳系数方案对台风条件下上层海洋海温数值模拟的影响[J]. 热带海洋学报, 2017 , 36(5) : 24 -32 . DOI: 10.11978/2016103
To improve model forecast of upper ocean and offer a more proper momentum exchange scheme for an air-sea coupling model, a new drag coefficient scheme of CD considering sea spay layer on the surface is established and is used in the three-dimensional oceanic circulation model of the Princeton Ocean Model (POM). A case of tropical cyclone Kalmaegi in 2014 is selected, which passed through the center of a buoys array set up by our field experiment in the northern South China Sea. Observation data were collected for both atmosphere and ocean in the process, and are used to verify the model simulation. It is found that the drag coefficient CD under low wind condition is consistent with the traditional CD scheme. However, they are different from each other under high wind condition with CD increasing slowly, even decreasing slightly, if sea spay process is considered by the new CD scheme. Furthermore, numerical experiments are conducted using the POM. The results show that the responses of upper ocean on temperature are more reasonable with a weaker cooling rate of ocean temperature and thermocline strength, and smaller deepening of mixed layer depth in the upper ocean if the new drag coefficient scheme is used.
 , 其中: CD是拖曳系数,
  是空气密度, W为风矢量。风应力拖曳系数CD决定了大气与海水动量传输率, 因此对风应力
  的研究就转化为对拖曳系数CD的研究。早期在数值实验中一般把拖曳系数设置为常数, 后来一般认为拖曳系数是仅仅关于10m平均风速
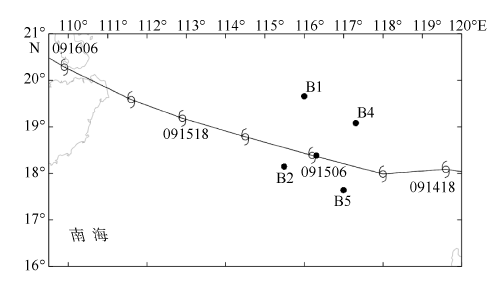
  的线性增长关系(Garratt, 1977), POM(Princeton Ocean Model)等海洋环流模式都采用该方案。但随着大量的观测试验的实施, 发现中低风速情况下拖曳系数随风速的增大而增大, 在高风速条件下由于海水面与空气接触面变得光滑, 拖曳系数随风速的进一步增大出现饱和或减小。CD一般在风速为23~33m·s-1之间时达到饱和点(Black et al, 2007; Troitskaya et al, 2011; 赵中阔 等, 2011; Vickers et al, 2013; Zachry et al, 2013)。赵中阔 等(2011)的研究结果则指出在10m风速为20~24m·s-1之间时CD已经呈现下降趋势。因此, 这方面的研究结果因方法和海域等因素而有差异。
Fig. 1 Buoy array in the South China Sea and track of Typhoon Kalmaegi. represents the center of typhoon, and●represents the locations of the buoys图1 南海浮标观测阵列及2014年“海鸥”台风路径 |
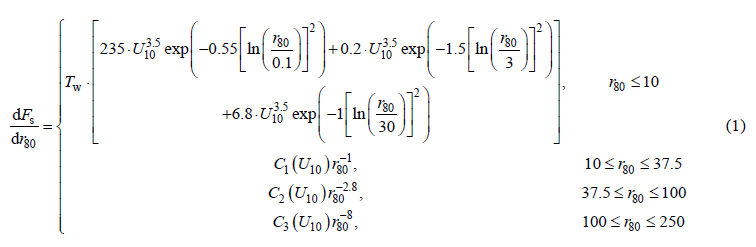

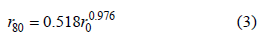
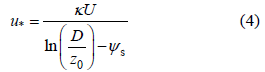
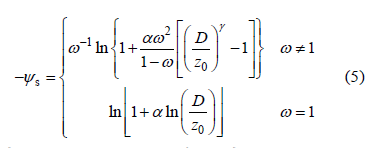
 为飞沫的降落速度;
  , β 为与风速廓线有关的一个常数,g为重力加速度, σ=(ρw-ρ),ρw为海水密度,ρ为空气密度, SO为海洋飞沫体积浓度, 可由
  积分得到。
积分得到。 与拖曳系数CD的关系(Bao et al, 2011)
 (6)
(6) (7)
(7)
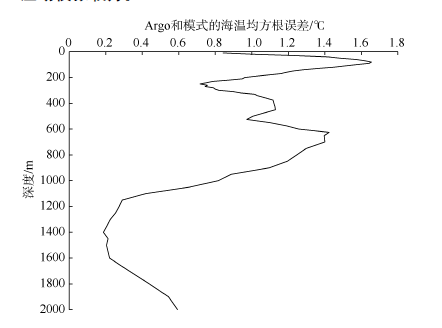
Fig. 2 Averaged ocean temperature standard deviation between simulation in EXP2 and Argo observations图2 EXP2模式模拟海温与西北太平洋Argo观测海温的标准差 |
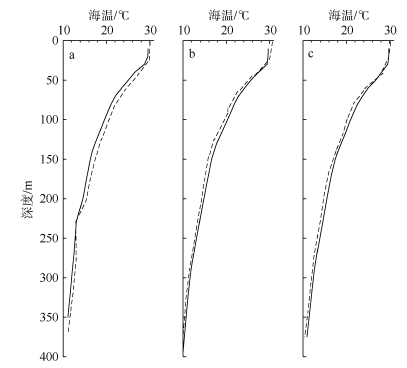
Fig. 3 Ocean temperature profiles with depth before Typhoon Kalmaegi passing the locations of B2 (a), B4 (b) and B5 (c). Short dashed line: buoy observations; and solid line: simulated ocean temperature by EXP1图3 9月10日18时(台风影响前)浮标B2(a)、浮标B4(b)和浮标B5(c)海温随深度的变化廓线 |
Fig. 4 Sea surface wind field used by the model at 06:00 on Sep. 15 in 2014. represents the center of typhoon, and●represents locations of buoys图4 2014年9月15日06时的模式强迫海面风场 |
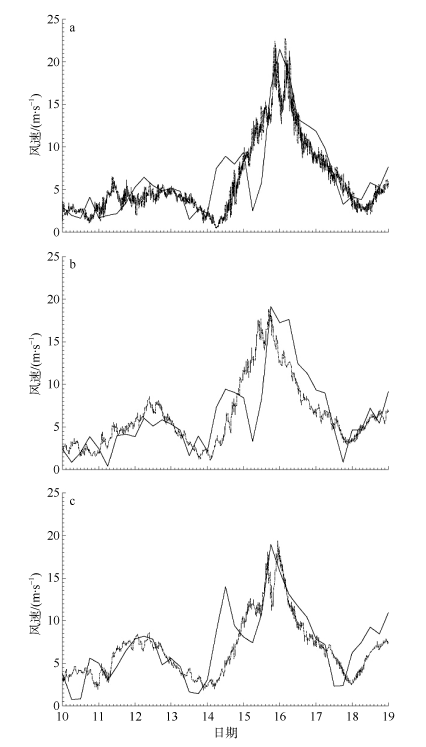
Fig. 5 The observed wind speed (dotted line) and model wind speed (solid line) at B2, B4 and B5 buoy sites, from Sep. 10 to Sep. 19图5 B2(a)、B4(b)和B5(c)浮标所在位置上的2min平均风速的观测(虚线)和模式强迫风速(实线)时间序列 |
 的变化, 可见在中低风速情况下,
  的增长很慢, 但在高风速情况下
  数值呈指数级增长, 因此, CD在高风速条件下的缓慢减小体现了海洋飞沫层对于海面粗糙度减小的作用。在本文中, 由于浮标海域受台风大风影响时段较短, 所获得的大风资料样本有限, 关于CD在大风区的变化结论有待今后进一步验证。
Fig. 6 Variation of drag coefficient CD with wind speed and sea spray concentration |
Fig. 7 Difference of sea surface temperature before and after Typhoon Kalmaegi: a) satellite observations; b) EXP1; and c) EXP2图7 “海鸥”台风经过浮标观测列阵前后的SST变化 |
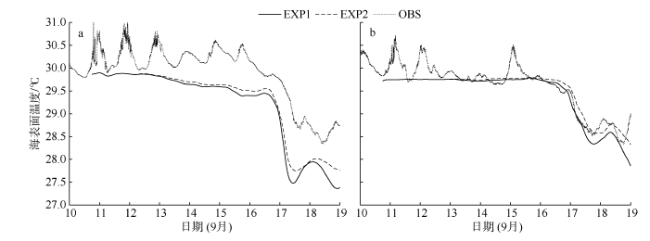
Fig. 8 Time series of SST for EXP1, EXP2 and observations, respectively, at B2 (a) and B5 (b)图8 海表面温度SST随时间变化 |
Tab. 1 SST decreases in EXP1, EXP2 and observed by buoys (Units: ℃)表1 EXP1、EXP2和观测的SST降温幅度(单位: ℃) |
| 浮标 | EXP1 | EXP2 | OBS(观测) |
|---|---|---|---|
| B1 | 2.17 | 1.88 | 1.87 |
| B2 | 2.02 | 1.90 | 1.44 |
| B3 | 1.61 | 1.31 | 1.24 |
| B4 | 1.96 | 1.67 | 1.80 |
| B5 | 1.05 | 0.97 | 0.62 |
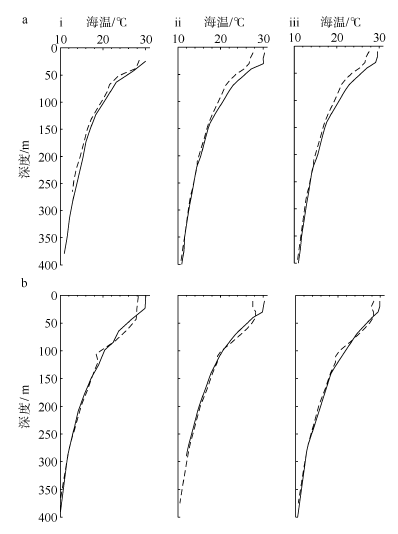
Fig. 9 Ocean temperature profiles with depth before and after Typhoon Kalmaegi: i) OBS; ii) EXP1; and iii) EXP2. a) Buoy 2; and b) Buoy 4. Solid line: before typhoon passage; and dashed line: after typhoon passage图9 台风影响前后观测(i)、EXP1(ii)和EXP2(iii)海温随深度的变化廓线 |
The authors have declared that no competing interests exist.
| [1] |
|
| [2] |
|
| [3] |
|
| [4] |
|
| [5] |
|
| [6] |
中国气象局, 2016. 热带气旋年鉴2014[M]. 北京: 气象出版社: 123-125.
|
| [7] |
|
| [8] |
|
| [9] |
|
| [10] |
|
| [11] |
|
| [12] |
|
| [13] |
|
| [14] |
|
| [15] |
|
| [16] |
|
| [17] |
|
| [18] |
|
| [19] |
|
| [20] |
|
| [21] |
|
/
| 〈 |
|
〉 |


 in EXP1 and EXP2 at the locations of B2 (a) and B5 (b)
 的变化
的变化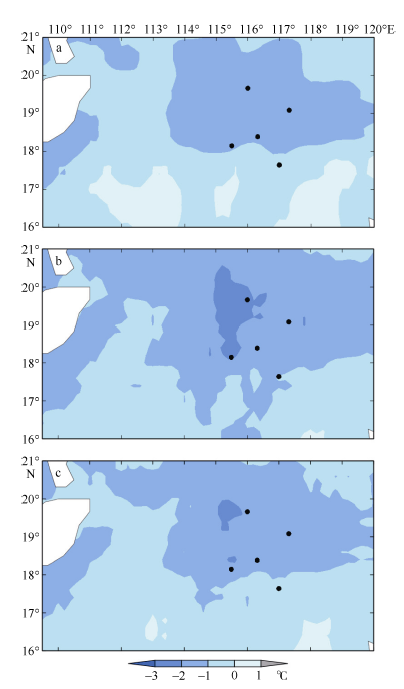