
基于GF-4遥感数据的叶绿素浓度反演算法研究*
作者简介:杨超宇(1985—), 女, 新疆石河子市人, 博士, 海洋遥感。E-mail: ycy@scsio.ac.cn
收稿日期: 2017-01-09
要求修回日期: 2017-02-04
网络出版日期: 2017-09-22
基金资助
国家自然科学基金项目(41506196、41430968)
广西科技计划项目(桂科AB16380339)
热带海洋环境国家重点实验室(中国科学院南海海洋研究所)开放课题(LTO1511)
中央级公益性科研院所基本科研业务费专项项目(PM-zx703-201601-014)
国家重点研发计划(2016YFC1401407)
A study on retrieving chlorophyll concentration by using GF-4 data
Received date: 2017-01-09
Request revised date: 2017-02-04
Online published: 2017-09-22
Supported by
National Natural Science Foundation of China (41506196, 41430968)
Science and Technology Planning Project of Guangxi (AB16380339)
State Key Laboratory of Tropical Oceanography Under Independent Project (LTO1511)
South China Institute of Environmental Sciences, the Ministry of Environmental Protection of the People's Republic of China , Ministry of Environmental Protection (PM-zx703-201601-014)
National Key Research and Development Program of China(2016YFC1401407)
Copyright
高分四号(GF-4)遥感卫星数据于2016年6月被正式公布并投入使用,它是目前世界上空间分辨率最高、幅宽最大的地球同步轨道遥感卫星。其空间、时间上的高分辨率特点使得该卫星在海洋灾害监测方面具有较大的发展潜力。文章基于2009年10月22日的珠江口赤潮水体, 建立了一个适应于GF-4波段设置的叶绿素浓度反演算法(决定系数r2=0.90; 均方根误差RMSE=0.1)。通过辐射传递方程的数值计算软件Hydrolight模拟数据进行比对, 发现该算法具有较好的适用性(r2=0.92; RMSE=0.23)。进一步应用该算法和GF-4卫星遥感数据分析了2016年5月发生在广西的赤潮事件,反演结果与现场调查结果吻合较好。这是国内第一次在广西临近海域使用GF-4遥感数据反演包含赤潮水体的叶绿素浓度分布数据产品, 可为海洋文明建设和海洋灾害调查等提供有效的技术支持。
杨超宇 , 唐丹玲 , 叶海彬 . 基于GF-4遥感数据的叶绿素浓度反演算法研究*[J]. 热带海洋学报, 2017 , 36(5) : 33 -39 . DOI: 10.11978/2017008
Gaofeng-4 products have become available since June 2016. GF-4 is the first geosynchronous orbit remote sensing satellite in China. The virtue of the satellite is its high spatial and temporal resolution. So, the satellite is useful for monitoring marine disasters. In this study, we established a model to retrieve the chlorophyll concentration from GF-4 satellite data based on the in situ measured data on 22th October 2009 (the coefficient of determination r2=0.90; root mean square error RMSE=0.1). The algorithm has been shown to have a relatively better applicability by comparing the result with Hydrolight (r2=0.92; RMSE=0.23). The model was further applied to analyze the harmful algal bloom in Guangxi in May 2016 by using GF-4 satellite data. The result showed a good agreement with the in situ survey data. This is the first time to retrieve chlorophyll concentration from the remote sensing reflectance, including the harmful algal bloom waters in Guangxi by using GF-4 products. The research can provide an effective technique for constructing marine civilization and marine disaster investigation.
Key words: harmful algal bloom; reflection peak value; Pearl River; Guangxi
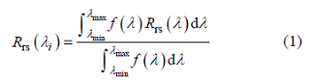
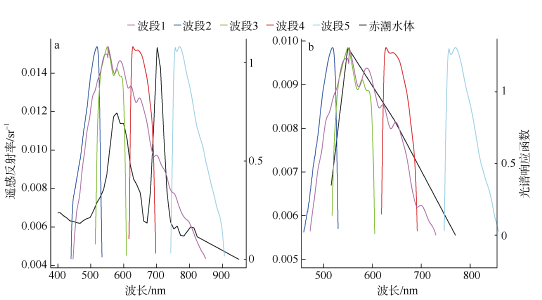
Fig. 1 The reflectance curves collected in the Pearl River Estuary on 22th October 2009 and simulated. (a) Hyperspectral reflectance curves; and (b) simulated GF-4 reflectance图1 珠江口2009年10月22日赤潮水体反射率光谱曲线 |
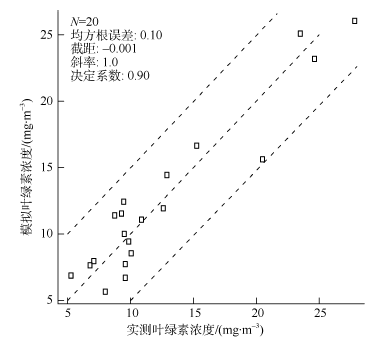
Fig. 2 Comparison between in situ measured chlorophyll collected in the Pearl River Estuary and modeled ones. The dashed lines represent 1︰1.5, 1︰1 and 1.5︰1 line between in situ measured chlorophyll and modeled ones, respectively.图2 珠江口2009年现场实测叶绿素浓度与模型模拟结果的比对 |

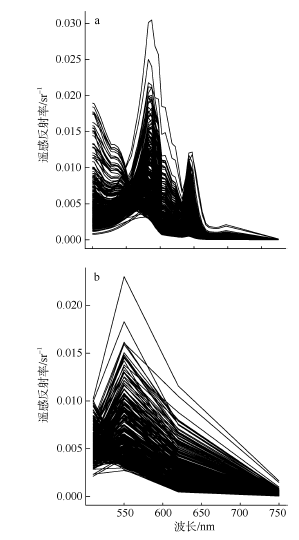
Fig. 3 Hydrolight simulated remote sensing curves and model simulated. (a) Hyperspectral remote sensing reflectance; and (b) simulated GF-4 reflectance图3 Hydrolight 模拟的遥感反射率曲线 |
Tab.1 Parameters for GF-4表1 GF-4参数设置 |
| 传感器波段 | |||||
|---|---|---|---|---|---|
| 波段1 | 波段2 | 波段3 | 波段4 | 波段5 | |
| 积分模式(2-6-4-6-6)增益 | 0.5215 | 0.9400 | 0.9885 | 0.7847 | 0.5641 |
| 积分模式(4-16-12-16-16)增益 | 0.3100 | 0.3484 | 0.3448 | 0.3095 | 0.2257 |
| 积分模式(6-20-16-20-20)增益 | 0.1681 | 0.3263 | 0.2472 | 0.2806 | 0.1997 |
| 积分模式(6-40-30-40-40)增益 | 0.1681 | 0.1252 | 0.1226 | 0.1102 | 0.0796 |
| 积分模式(8-30-20-30-30)增益 | 0.1235 | 0.1784 | 0.1878 | 0.1515 | 0.1080 |
| 大气顶层太阳辐照度/(W•m-2•sr-1•μm-1) | 1595.08 | 1907.88 | 1815.42 | 1580.18 | 1098.79 |
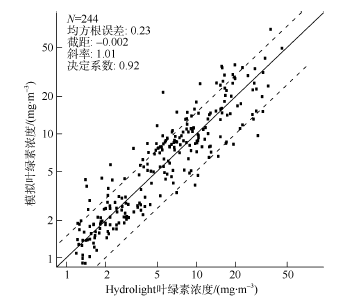
Fig. 4 Comparison between chlorophyll for Hydrolight and the ones retrieved by the model. The solid line represents 1︰1 line between chlorophyll for Hydrolight and modeled ones. The dashed lines represent 1︰1.5 and 1.5︰1 line between chlorophyll for Hydrolight and modeled ones, respectively. The dotted points represent chlorophyll for Hydrolight and modeled ones图4 Hydrolight模拟叶绿素浓度与模型模拟结果的比对 |

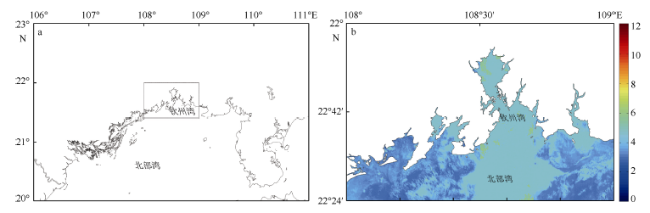
Fig. 5 GF-4 satellite image near Guangxi on 19th May 2016. (a) The location of GF-4 satellite image passed over Guangxi on 19th May 2016. (b) Chlorophyll concentration in scale retrieved by GF-4 data on 19th May 2016 (unit: mg·m-3).图5 2016年5月19日广西附近海域GF-4遥感影像 |
The authors have declared that no competing interests exist.
| [1] |
|
| [2] |
|
| [3] |
|
| [4] |
|
| [5] |
|
| [6] |
|
| [7] |
|
| [8] |
|
| [9] |
|
| [10] |
|
| [11] |
|
| [12] |
|
| [13] |
|
| [14] |
|
/
| 〈 |
|
〉 |
