
西南印度洋脊14#cod#x000b0;E#cod#x02014;25#cod#x000b0;E区域洋壳增生的构造与岩浆特征
作者简介:查财财(1991#cod#x02014;), 男, 安徽省安庆市人, 硕士研究生, 主要从事大洋中脊构造与地球物理特征研究。E-mail: zhacaicai2012@163.com
收稿日期: 2016-11-19
要求修回日期: 2017-02-02
网络出版日期: 2018-01-18
基金资助
中国科学院项目(QYZDY-SSW-DQC005、Y4SL021001、YZ201325、YZ201534)
国家自然科学基金项目(91628301、U1606401、41676044)
Magmatic and tectonic extension at the Southwest Indian Ridge between 14#cod#x000b0;E and 25#cod#x000b0;E
Received date: 2016-11-19
Request revised date: 2017-02-02
Online published: 2018-01-18
Supported by
Chinese Academy of Sciences Project (QYZDY-SSW-DQC005, Y4SL021001, YZ201325, YZ201534)
National Natural Science Foundation of China (91628301, U1606401, 41676044)
Copyright
文章利用高精度船载多波束测深及重力数据研究了超慢速西南印度洋脊14#cod#x000b0;E#cod#x02014;25#cod#x000b0;E区域洋壳增生的构造与岩浆特征。首先采用滤波的方法将原始地形数据分为短波长地形(波长小于20km)和长波长地形(波长大于20km)。然后利用长波长地形剖面获得洋中脊裂谷的深度, 利用短波长地形剖面和坡度来识别正断层, 并计算出岩浆作用在整个扩张过程中所占的比例, 即M值。同时从自由空气重力异常中去除海底地形、参考莫霍面以及板块冷却等重力效应, 获取能够表征相对洋壳厚度的剩余地幔布格重力异常(Residual Mantle Bouguer Anomaly, RMBA)。最后在垂直于洋脊的剖面上以10km宽的窗口计算出一系列窗口内的M值、平均RMBA值以及断层的垂直断距, 并探讨它们之间的相关性。研究发现在超慢速扩张的西南印度洋脊14#cod#x000b0;E#cod#x02014;25#cod#x000b0;E区域, 岩浆率M值随时间和空间变化明显, 裂谷深度呈现较强的两翼不对称性, 裂谷深度在一定程度上反映了脊轴附近的平均M值。区域性的平均构造拉伸率(即1-M)处于20%~50%之间, 南翼整体处于较强的拉伸状态。统计结果表明, 在岩浆作用较强的时期, M值偏大, 通常产生较厚的洋壳以及断距较小的断层。
查财财 , 林间 . 西南印度洋脊14#cod#x000b0;E#cod#x02014;25#cod#x000b0;E区域洋壳增生的构造与岩浆特征[J]. 热带海洋学报, 2017 , 36(6) : 1 -11 . DOI: 10.11978/2016119
In this study we used the high-resolution shipboard multibeam bathymetry and gravity data to investigate the tectonic and magmatic characteristics of the Southwest Indian Ridge (SWIR) between 14#cod#x000b0;and 25#cod#x000b0;E. First, we filtered the original bathymetry to obtain a short-wavelength bathymetry map (wavelength less than 20 km), which was used together with the topographic slope map to identify surface normal faults. We also obtained a long-wavelength bathymetry map (wavelength more than 20 km) that was used to calculate across-ridge axis topographic relief. We also calculated the fraction of plate separation accommodated by magmatic accretion, i.e., the M factor. We then calculated the Residual Mantle Bouguer Anomaly (RMBA) by removing from the free-air gravity anomaly the gravitational effects of water/crust and crust/mantle interfaces as well as lithospheric plate cooling, assuming a reference crustal thickness of 6 km. Finally, we calculated the M factor, the mean values of RMBA, and fault throws within 10-km- wide running windows along profiles across the ridge axis and investigated the correlations among these parameters. We found that the magma supply varied significantly in time and space at the SWIR between 14#cod#x000b0;and 25#cod#x000b0;E and the axial relief showed strong asymmetry between conjugate ridge flanks that seemed to be controlled by the mean M factor near the ridge axis. Regionally-averaged tectonic extensional strains (i.e., 1-M) were about 20%~50% and the southern flank underwent greater average tectonic extensional strains. Areas with thicker crust (i.e., more negative RMBA) are often associated with greater M values and smaller fault throws, indicating episodes of increased local 3D magma supply at this ultraslow spreading ridge.
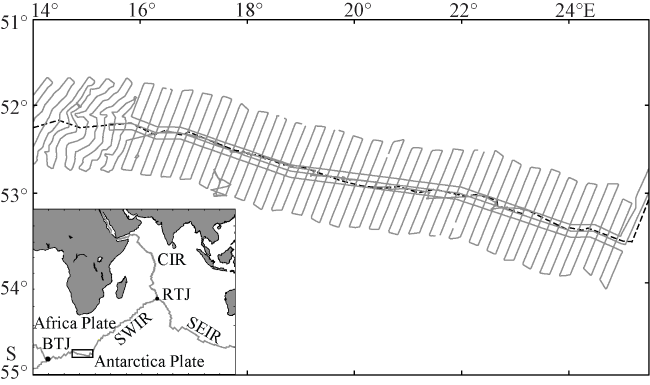
Fig. 1 Tectonic map of the study area showing multibeam and geophysical survey track lines. Black dotted line indicates the ridge axis and transform fault图1 研究区构造位置以及地球物理数据测线位置示意图 黑色点线表示洋中脊与转换断层的位置, 子图中黑色方框标明研究区所在的位置。CIR: 中印度洋脊; SEIR: 东南印度洋脊; SWIR: 西南印度洋脊; BTJ: 布韦三联点; RTJ: 罗德里格斯三联点; Africa Plate: 非洲板块; Antarctica Plate: 南极洲板块 |
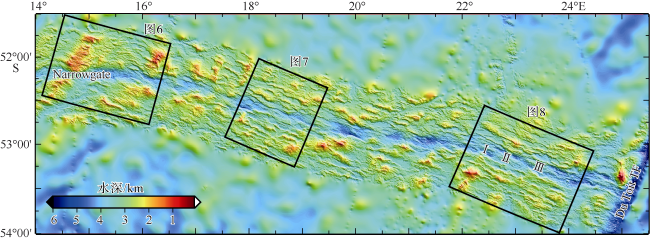
Fig. 2 Shaded topography of the study area. Black boxes outline the subregions in |
Fig. 3 Schematics showing calculations of the axial relief: (a) original topography; (b) filtered topography with wavelengths less than 20 km removed; (c) an example of calculation of the axial relief. Gray and blue lines are the profiles from the original and filtered topography, respectively. TS, TN indicate the axial relief from the southern and northern flanks图3 裂谷深度计算方法示意图 a. 原始地形图; b. 长波长地形图; c. 裂谷深度的计算实例。 |
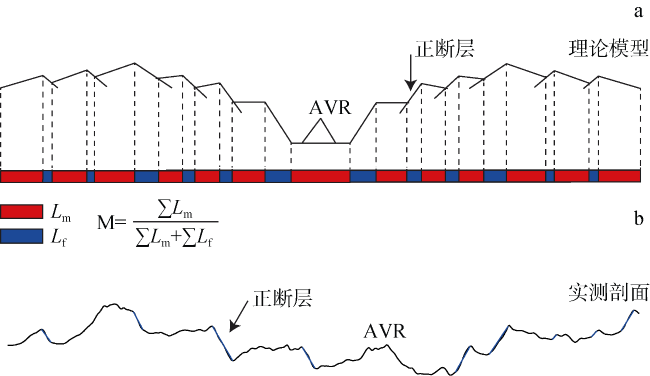
Fig. 4 Schematics showing the calculation of the M factor (a) and an example profile of the SWIR (b). AVR indicate the axial volcanic ridge. (a) Red and blue boxes indicate the interpreted magmatic accretion (Lm) and tectonic extension (Lf), respectively; (b) fault scraps are shown by blue lines图4 M值的计算方法示意图(a)以及实例(b) AVR指的是脊轴火山脊。(a)中红色表示岩浆作用的部分(Lm), 蓝色表示构造作用的部分(指正断层的水平断距, 即Lf); (b)中正断层的断层面被标记为蓝色 |
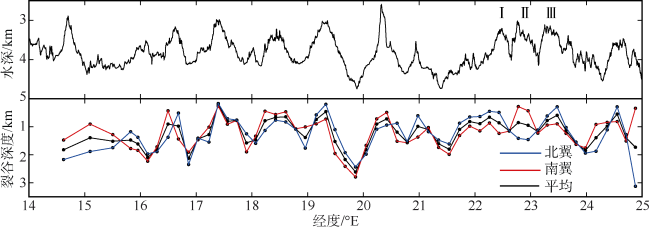
Fig. 5 Along-axis variations in the axial depth (upper panel) and axial relief (lower panel). #cod#x02160;, #cod#x02161;, #cod#x02162; indicate three axial volcanic ridges in the eastern subregion. Blue, red and black points indicate the calculated axial relief from the northern flank, southern flank and their averaged values, respectively图5 沿轴变化的水深以及裂谷深度 上图为沿轴水深变化; 下图为沿轴裂谷深度变化。#cod#x02160;、#cod#x02161;、#cod#x02162;标明了东边子区中的3个脊轴岩浆脊。蓝色表示北翼裂谷深度, 红色表示南翼裂谷深度, 黑色表示二者平均值 |
Fig. 6 Shaded topography (a), slope (b), RMBA (c) and the along-profile variations of M (upper d), mean fault throw (middle d) and mean RMBA (lower d) in the area of Narrowgate-16#cod#x000b0;E. Values shown in panel d are the averaged data of the four across-axis profiles shown in Panels |
Fig. 7 Shaded topography (a), slope (b), RMBA (c) and the along-profile variations of M (upper d), mean fault throw (center d) and mean RMBA (lower d) in the area of 17#cod#x000b0;30'E #cod#x02014; 19#cod#x000b0;E. Data resources are the same as |
Fig. 8 Shaded topography (a), slope (b), RMBA (c) and the along-profile variations of M (upper d), mean fault throw (center d) and mean RMBA (lower d) in the area of 22#cod#x000b0;E#cod#x02014; 24#cod#x000b0;E. Data resources are the same as |
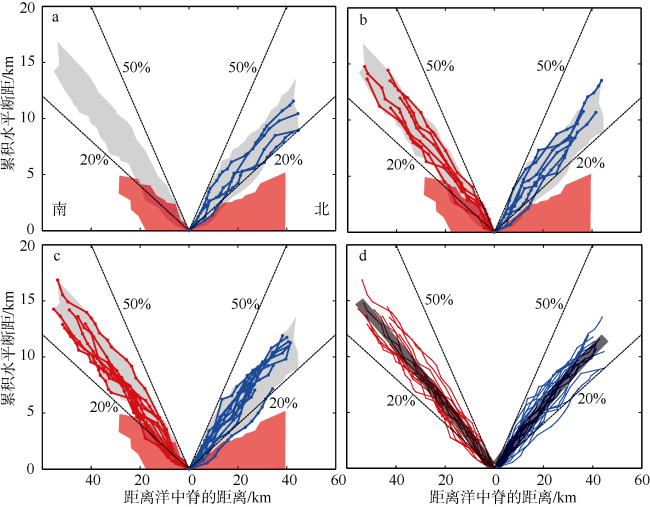
Fig. 9 Extensional strains of the study area. (a) Narrowgate #cod#x02014; 16#cod#x000b0;E; (b) 17#cod#x000b0;30'E#cod#x02014;19#cod#x000b0;E; (c) 22#cod#x000b0; E#cod#x02014;24#cod#x000b0;E; (d) synthesis of the three sub-regions shown in |
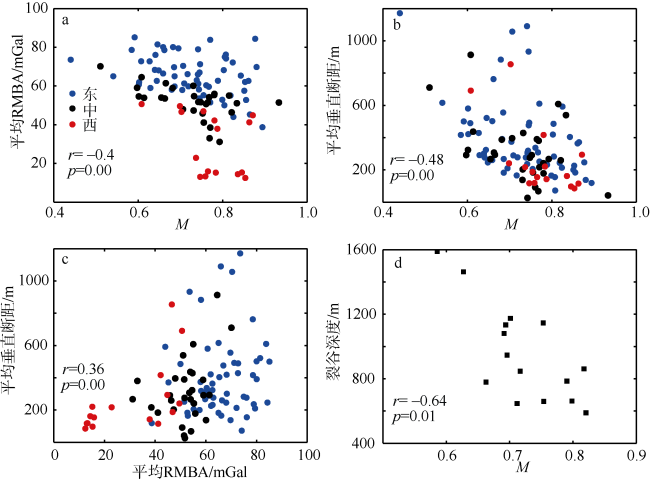
Fig. 10 Plots showing correlations of (a) M and mean RMBA, (b) M and mean fault throw, (c) mean RMBA and mean fault throw, (d) M and axial relief. Blue, black and red points are derived from the eastern, middle and western subregions, respectively. Spearman#cod#x02019;s rank correlation coefficient r, and p values are shown at the lower left corner of each panel. Positive r means positive correlation, while a value of 1 indicates the strongest positive correlation, correlation with p less than 0.05 is thought to be significant图10 参数之间的关系图。M值与平均RMBA(a); M值与平均垂直断距(b); 平均RMBA与平均垂直断距(c); M值与裂谷深度(d) 蓝色、黑色和红色的红点分别表示来自东部、中部和西部子研究区的散点。r表示斯皮尔曼等级相关系数, 正值表示正相关, 越靠近1表示相关性越强; p表示显著性检验值, 一般认为其值小于0.05才表示相关性具有显著意义 |
| [1] |
|
| [2] |
|
| [3] |
|
| [4] |
|
| [5] |
|
| [6] |
|
| [7] |
|
| [8] |
|
| [9] |
|
| [10] |
|
| [11] |
|
| [12] |
|
| [13] |
|
| [14] |
|
| [15] |
|
| [16] |
|
| [17] |
|
| [18] |
|
| [19] |
|
| [20] |
|
| [21] |
|
| [22] |
|
| [23] |
|
| [24] |
|
| [25] |
|
| [26] |
|
| [27] |
|
| [28] |
|
| [29] |
|
| [30] |
|
| [31] |
|
| [32] |
|
| [33] |
|
| [34] |
|
| [35] |
|
| [36] |
|
| [37] |
|
| [38] |
|
| [39] |
|
| [40] |
|
/
| 〈 |
|
〉 |


