
西南印度洋中脊龙旂热液区(49#cod#x000b0;39#cod#x02032;E)的地震波各向异性研究进展与展望
作者简介:张佳政(1986#cod#x02014;), 广东省梅县人, 博士, 研究方向为海洋深部地球物理。E-mail: jzzhang@scsio.ac.cn
收稿日期: 2017-01-19
要求修回日期: 2017-04-22
网络出版日期: 2018-01-18
基金资助
国家自然科学基金项目(41606064、41730532、91428204)
中国大洋协会项目子课题基金项目(Y4GQ051001)
中国科学院边缘海地质重点实验室开放基金课题(MSGL15-03)
国家海洋局海底科学重点实验室开放基金课题(KLSG1501).
Progress and prospect of anisotropic study of hydrothermal field (49#cod#x000b0;39#cod#x02032;E) on the Southwest Indian Ridge
Received date: 2017-01-19
Request revised date: 2017-04-22
Online published: 2018-01-18
Supported by
National Natural Science Foundation of China (41606064, 41730532, 91428204)
Foundation of China Ocean Mineral Resources Research and Development Association (Y4GQ051001)
Open Foundation of Key Laboratory of Marginal Sea Geology of Chinese Academy of Sciences, South China Sea Institute of Oceanology (MSGL15-03)
Open Foundation of Key Laboratory of Submarine Geosciences, State Oceanic Administration, People#cod#x02019;s Republic of China (KLSG1501).
Copyright
龙旂热液区(49#cod#x000b0;39#cod#x02032;E)是超慢速扩张西南印度洋中脊(SWIR)上发现的首个活动热液喷口, 也是我国开展海底多金属硫化物资源勘探和走向深海大洋的重点研究区域。前期三维层析成像研究成功地揭示了该区的深部结构特征, 但仅仅是提供了静态信息, 相比之下, 地震波各向异性研究是揭示其深部动力学机制的有效手段之一。本文简要介绍了龙旂热液区开展的主动源和被动源海底地震仪(OBS)探测实验, 并初步分析了前期三维层析成像的走时残差数据, 发现其与方位角之间存在显著的余弦函数关系, 表明该区速度结构存在各向异性, 但其各向异性来源尚不明确。探索各向异性来源将有望揭示该区的热液循环机制, 为认识超慢速扩张SWIR热液区形成的动力学演化过程提供科学依据。因此, 本文拟在前期研究基础上, 利用主动源和被动源OBS地震数据, 通过纵波方位各向异性和横波分裂联合分析的方法, 重点研究地壳和地幔各向异性特征, 并结合三维速度模型与区域地质背景资料, 对获得的快波方向和快、慢波到时差参数进行深入分析, 阐明地壳内裂隙分布、应力场变化和地幔流动特征, 从而揭示龙旂热液区的热液循环机制、岩石圈形变和深部动力学过程等科学问题。
张佳政 , 周建平 , 赵明辉 , 丘学林 . 西南印度洋中脊龙旂热液区(49#cod#x000b0;39#cod#x02032;E)的地震波各向异性研究进展与展望[J]. 热带海洋学报, 2017 , 36(6) : 71 -81 . DOI: 10.11978/2017010
Dragon Flag Hydrothermal Field (DFHF, 49#cod#x000b0;39#cod#x02032;E), located on the ultraslow-spreading Southwest Indian Ridge (SWIR), was the first active hydrothermal vent discovered in this area; and it is an essential location for seafloor exploration of polymetallic sulfide resources and deep ocean studying for China. A three-dimensional tomographic study successfully revealed the deep structure characteristics of the DFHF, but it only provided the static velocity information. For comparison, seismic anisotropic study is an effective method for investigating the dynamic mechanism of the DFHF. In this paper, we briefly introduce the oceanic bottom seismometer (OBS) surveys of both active and passive sources. Our preliminary analysis shows a cosine relationship between travel-time residuals and azimuths based on the velocity structure obtained from previous three-dimensional tomography, indicating that there is an anisotropy on the velocity structure at the DFHF; but, the source of the anisotropy is unclear until now. Seismic anisotropic study at the DFHF will contribute greatly to hydrothermal circulation mechanism and dynamic evolution process of hydrothermal field on the SWIR. Hence, we intend to conduct seismic anisotropic study by combining azimuthal seismic anisotropy and shear-wave splitting techniques based on the OBS data generated by the active (airguns) and passive (earthquakes) sources. Combined with three-dimensional velocity model and regional geological background data, anisotropic parameters of fast-wave direction and travel-time difference between fast and slow waves are used to depict the distribution of crustal cracks, stress variation and mantle flow. In addition, hydrothermal circulation mechanism, lithospheric deformation and deep dynamics process are further revealed.
Fig. 1 Experiment of active source oceanic bottom seismometer (OBS) and velocity modeling at the Dragon Flag Hydrothermal Field (DFHF).(a) Multi-beam bathymetry map and active-source seismic survey at the DFHF. Origin of local coordinate system is at (49#cod#x000b0;39#cod#x02032;E, 37#cod#x000b0;46#cod#x02032;S), with the X-axis oriented along 82#cod#x000b0;. Red star shows the location of active vents. Black circles with white numbers and thin black dotted lines show the locations of OBSs and shots, respectively. Red line of Y3Y4 shows the location of the profile in (b). Thick white lines with #28 (in red) and #29 (in black) indicate the neo-volcanic ridges (NVRs) for segments 28 and 29 (defined by Cannat et al, 1999). Thick dashed lines indicate the non-transform discontinuities (NTDs). Red star in the inset at the top-right corner shows the location of the seismic survey area. The inset at the bottom-right corner shows the corrugated surface of Dragon Flag oceanic core complex (OCC). (b) The final model of P-wave crustal structure along Profile Y3Y4. Red star is the horizontal projection of active vents. The inverted triangles indicate locations of OBS. Red lines on the Moho mean there are PmP rays being covered. (c) The interpreted geological model. BA: Breakaway; T: Termination; and ODF: Oceanic Detachment Fault (Zhang et al, 2013) 图1 龙旂热液区的主动源OBS探测实验及速度结构模拟 a. 龙旂热液区多波束水深及三维主动源OBS探测实验。笛卡尔坐标原点经纬度为49#cod#x000b0;39#cod#x02032;E, 37#cod#x000b0;46#cod#x02032;S, X轴方向为82#cod#x000b0;; 红色五角星代表活动热液喷口位置, 黑色圆圈和点线分别代表OBS台站和炮点, 红线Y3Y4指示 |
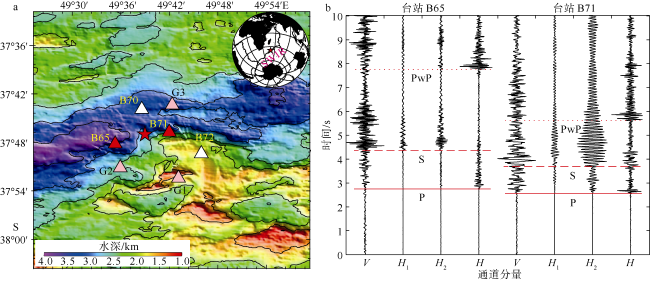
Fig. 2 Experiment of passive source OBS and records of microseismicities at the DFHF.(a) Red, pink and white triangles represent the locations of imported, domestic and lost OBS, respectively. Red star shows the location of active vents. (b) Filtered four-channel seismic records of OBS B65 and B71 for vertical channel (labeled V), two horizontal (H1 and H2) seismometer channels and hydrophone channel (H). The traces are scaled to equal maximum amplitude and band-pass filtered of 3~20 Hz. The start time of trace was 23:55:15.015 on Feb 18th, 2015. P waves, S waves and PwP phase are indicated by solid red line, dashed red line and dotted gray line, respectively 图2 龙旂热液区的被动源动源OBS探测实验和微震记录 a. 红色、粉红色和白色三角形分别代表进口OBS位置、国产OBS位置和丢失OBS位置, 红色五角星代表活动热液喷口位置。b. 台站B65和B71滤波后四通道地震记录; V、H1、H2和H分别代表垂直分量、两个水平分量和水听器分量, 数据经过归一化和3~20Hz带通滤波, 地震记录初始时间为2015年2月18日23:55:15.015, 纵波(P)、横波(S)和水面反射纵波(PwP)分别用红色实线、虚线和点线表示 |
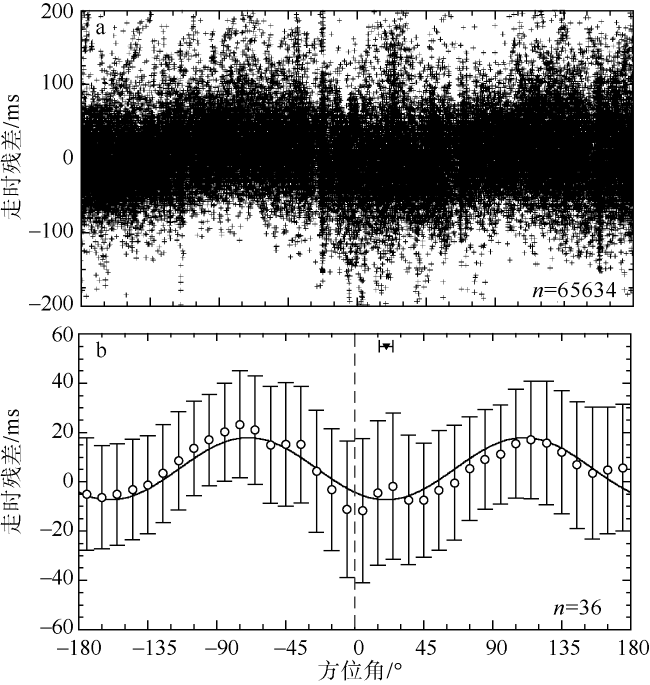
Fig. 3 Travel-time residuals plotted against their source-receiver azimuths.(a) A total of 65634 pair travel-time residuals plotted against their source-receiver azimuths. The 0#cod#x000b0; azimuth corresponds to the general trend of NVR (#28), and n is the number of travel-time residuals. (b) Travel-time residuals binned and plotted against their source-receiver azimuth. The black line shows best-fitting curve of cos2#cod#x003b8;. The circles show the mean residual in each 20#cod#x000b0; bin, and the bars indicate the ranges of a standard deviation. Fast direction is indicated by the triangle with standard error bar located below the upper horizontal axis, and n is the number of bins 图3 走时残差数据与其震源及接收仪器方位角的关系 a.65634对走时残差数据与方位角的关系。0#cod#x000b0;方位角对应于扩张脊走向, n为走时残差数量。 b. 分组后的走时残差数据与方位角的cos2#cod#x003b8;余弦函数关系。黑色曲线为最佳拟合曲线, 白色圆圈为20#cod#x000b0;方位角间隔的平均走时残差, 竖线为一个标准差#cod#x003c3;的误差条, 顶部黑色三角形对应快波方向, n为平均走时残差数量 |
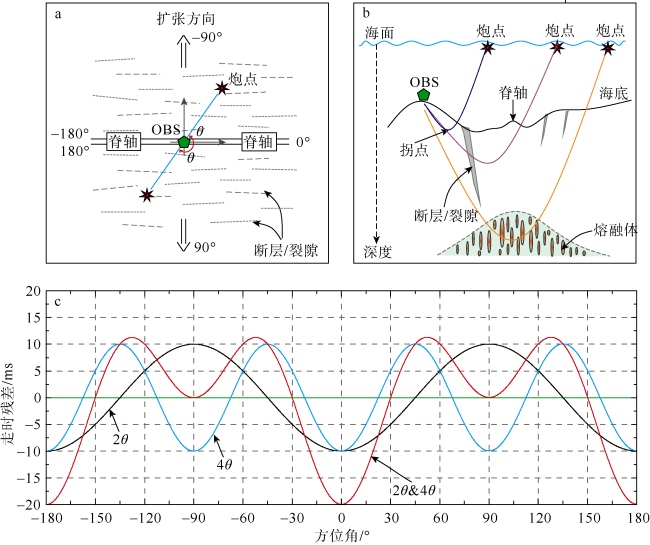
Fig. 4 Theoretical diagram of anisotropy inverted from travel-time analysis.(a) Top view for anisotropic medium. Black dashed lines represent dry cracks, and thin dashed gray lines represent saturated cracks. Black lines and arrows represent axis and spreading direction. (b) Side view for anisotropic medium. Thin dashed gray lines represent saturated cracks. According to different penetrating depths of shot rays, the anisotropic characteristics from different depths can be obtained. (c) The relationship between travel-time residuals and corresponding azimuths. Black, blue and red curves indicate the relationship of cos2#cod#x003b8;, cos4#cod#x003b8; and simultaneous cos2#cod#x003b8; and cos4#cod#x003b8;, respectively. Black line means larger percentage of dry cracks, and shows closer relationship with cos2#cod#x003b8;. Blue dashed line means larger percentage of saturated cracks, and shows closer relationship with cos4#cod#x003b8;. Red curve means equivalent effects of dry and saturated cracks 图4 各向异性的走时分析方法原理示意图 a. 各向异性介质俯视图。黑色粗虚线代表干燥裂隙, 灰色细虚线代表饱和裂隙, 黑色实线为脊轴, 黑色箭头代表扩张方向。b. 各向异性介质侧视图。根据射线穿透深度的不同, 可以分析不同深度介质的各向异性特征。c. 走时残差与方位角的关系图。黑色、蓝色和红色曲线分别表示满足cos2#cod#x003b8;、cos4#cod#x003b8;以及同时满足cos2#cod#x003b8;和cos4#cod#x003b8;关系, 黑色曲线代表干燥裂隙所占比例较大, 更多地表现为cos2#cod#x003b8;形式, 蓝色曲线代表饱和裂隙所占比例较大, 更多地表现为cos4#cod#x003b8;形式, 红色曲线代表干燥裂隙和饱和裂隙其同等作用 |
Fig. 5 Result of azimuthally seismic anisotropy technique on the western limb of the 9#cod#x000b0;N overlapping spreading center on the East Pacific Rise (EPR) (Tong et al, 2004).(a) Cosine function relationship between travel-time residuals and their azimuths; (b) estimated percentage anisotropy; (c) geometric configuration of along-axis hydrothermal circulation (arrow) consistent with crack structures inferred from anisotropic study 图5 EPR 9#cod#x000b0;N重叠扩张中心西侧扩张脊上的纵波方位各向异性研究成果(Tong et al, 2004) a. 走时残差与方位角的余弦函数关系; b. 估算的各向异性大小; c. 基于各向异性研究提出的海底热液循环的地质解释模型 |
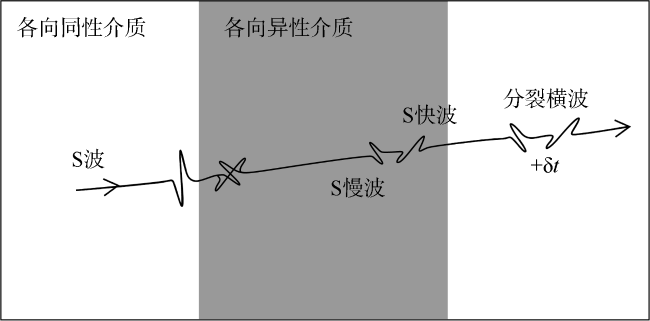
Fig. 6 Shear-wave splitting occurred when a shear wave traveled through an anisotropic medium (W#cod#x000fc;stefeld et al, 2008).When incident shear wave arrived at an anisotropic medium, it split into two shear waves of perpendicular polarization along seismic fast and slow directions, respectively. Traveling through anisotropic medium, the two waves accumulated a delay time #cod#x003b4;t. Shear-wave splitting techniques inverted for #cod#x003b4;t and the fast polarization direction 图6 横波穿过各向异性介质时发生的横波分裂现象(W#cod#x000fc;stefeld et al, 2008) 当横波遇到各向异性介质时, 会分裂成一快一慢的两个相互垂直的极化波, 而且它们穿过各向异性介质后, 会产生一个时间差#cod#x003b4;t, 横波分裂方法就是求取快极化波和#cod#x003b4;t, 进而揭示各向异性介质的属性 |
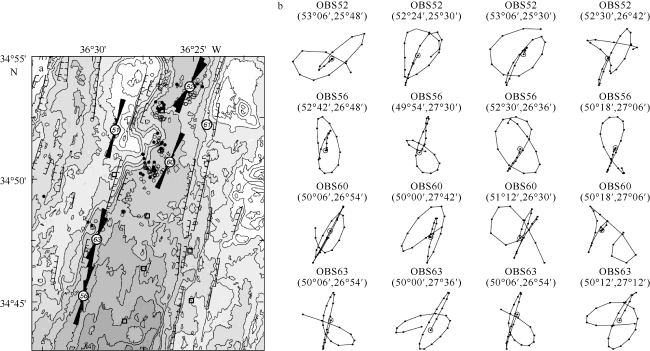
Fig. 7 Result of shear-wave splitting at the axis of Mid-Atlantic Ridge (MAR) near 35#cod#x000b0;N (Barclay et al, 2003).(a) Rose histograms of fast polarization directions for six OBSs. (b) Examples of shear-wave splitting in horizontal particle motions. The shear wave arrivals are shown for earthquakes at four different OBSs (52, 56, 60, and 63), with fast wave moving in a nearly NS direction and slow wave moving in a nearly EW direction. Numbers in parentheses are the earthquake epicenters in minutes of latitude and longitude, respectively. Each trace was 203ms long, with sample points (dots) every 7.8125ms. The open circle is the origin of particle motion 图7 MAR 35#cod#x000b0;N区域的横波分裂研究成果(Barclay et al, 2003) a. 展示了6个OBS台站的快波方向玫瑰图。b. 以水平质点运动展示的横波分裂示例图。图中展示了4个OBS台站(52、56、60和63)记录到的横波分裂现象, 可见质点近乎先南北向运动, 后东西向运动, 表明快、慢波先后到达; 括号内的标注为震中坐标, 每个质点轨迹长203ms, 采样点(黑色圆点)间隔为7.8125ms, 空心圆代表质点运动起点 |
| [1] |
CHANG LIJUN, WANG CHUNYONG, DING ZHIFENG, et al, 2008. Seismic anisotropy of upper mantle in the northeastern margin of the Tibetan Plateau[J]. Chinese Journal of Geophysics, 51(2): 431-438 (in Chinese).
|
| [2] |
CHANG LIJUN, WANG CHUNYONG, DING ZHIFENG, et al, 2015. Upper mantle anisotropy of the eastern Himalayan syntaxis and surrounding regions from shear wave splitting analysis[J]. Science China Earth Sciences, 58(10): 1872-1882 (in Chinese).
|
| [3] |
GAO YUAN, TENG JIWEN, 2005. Studies on seismic anisotropy in the crust and mantle on Chinese mainland[J]. Progress in Geophysics, 20(1): 180-185 (in Chinese).
|
| [4] |
HAN ZONGZHU, ZHANG HE, FAN DEJIANG, et al, 2012. The characteristic of geochemistry and genesis for mafic and utrlmafic rocks from the 50#cod#x000b0;E of southwest Indian Ridge[J]. Periodical of Ocean University of China, 42(9): 69-76 (in Chinese).
|
| [5] |
JIANG MEI, XU ZHIQIN, HIRN A, et al, 2001. Teleseimic anisotropy and corresponding features of the upper mantle in Tibet plateau and its neighboring areas[J]. Acta Geoscientia Sinica, 22(2): 111-116 (in Chinese).
|
| [6] |
LI SANZHONG, SUO YANHUI, YU SHAN, et al, 2015. Morphotectonics and tectonic processes of the southwest Indian Ocean[J]. Geotectonica et Metallogenia, 39(1): 15-29 (in Chinese).
|
| [7] |
LI XIAOHU, CHU FENGYOU, LEI JIJIANG, et al, 2008. Advances in slow-ultraslow-spreading southwest Indian Ridge[J]. Advances in Earth Science, 23(6): 595-603 (in Chinese).
|
| [8] |
LIANG YUYANG, LI JIABIAO, LI SHOUJUN, et al, 2014. The magmato-tectonic dynamic model for the Indomed-Gallieni segment of the central Southwest Indian Ridge[J]. Chinese Journal of Geophysics, 57(9): 2993-3005 (in Chinese).
|
| [9] |
LIAO WULIN, DING ZHIFENG, ZENG RONGSHENG, et al, 2007. Shear wave splitting in Himalaya[J]. Chinese Journal of Geophysics, 50(5): 1437-1447 (in Chinese).
|
| [10] |
LV QINGTIAN, XU ZHIQIN, 1997. The deformation characteres of Qinghai-Xizang lithosphere: implication from earthquake mechanism and seismic anisotropy[J]. Geological Review, 43(4): 337-346 (in Chinese).
|
| [11] |
SHI YUTAO, 2014. Seismic anisotropy beneath the southern part of North-South Seismic Belt and preliminary study on the numerical simulation of dielectric anisotropy features[D]. Beijing: Institute of Geophysics, China Earthquake Administration (in Chinese).
|
| [12] |
TAI LINGXUE, GAO YUAN, LIU GENG, et al, 2015. Crustal seismic anisotropy in the southeastern margin of Tibetan Plateau by ChinArray data: shear-wave splitting from temporary observations of the first phase[J]. Chinese Journal of Geophysics, 58(11): 4079-4091 (in Chinese).
|
| [13] |
TAO CHUNHUI, LI HUAIMING, JIN XIAOBING, et al, 2014. Seafloor hydrothermal activity and polymetallic sulfide exploration on the southwest Indian ridge[J]. Chinese Science Bulletin, 59(19): 2266-2276 (in Chinese).
|
| [14] |
WANG CHUNYONG, CHANG LIJUN, L#cod#x000dc; ZHIYONG, et al, 2007. Seismic anisotropy of upper mantle in eastern Tibetan Plateau and related crust-mantle coupling pattern[J]. Science in China Series D: Earth Sciences, 50(8): 1150-1160 (in Chinese).
|
| [15] |
WANG QIONG, GAO YUAN, SHI YUTAO, et al, 2013. Seismic anisotropy in the uppermost mantle beneath the northeastern margin of Qinghai-Tibet plateau: evidence from shear wave splitting of SKS, PKS and SKKS[J]. Chinese Journal of Geophysics, 56(3): 892-905 (in Chinese).
|
| [16] |
WU JING, GAO YUAN, CHEN YUNTAI, et al, 2007. Seismic anisotropy in the crust in northwestern capital area of China[J]. Chinese Journal of Geophysics, 50(1): 209-220 (in Chinese).
|
| [17] |
YU MIAO, SU XIN, TAO CHUNHUI, et al, 2013. Petrological and geochemical features of basalts at 49.6#cod#x000b0;E and 50.5#cod#x000b0;E hydrothermal fields along the southwest Indian Ridge[J]. Geoscience, 27(3): 497-508 (in Chinese).
|
| [18] |
ZHANG HONGSHUANG, TENG JIWEN, TIAN XIAOBO, et al, 2013. Lithospheric thickness and upper mantle anisotropy beneath the northeastern Tibetan Plateau[J]. Chinese Journal of Geophysics, 56(2): 459-471 (in Chinese).
|
| [19] |
ZHANG TAO, 2010. Magmatism and tectonic processes in the area of hydrothermal vent on southwest Indian Ridge[D]. Beijing: Graduate University of the Chinese Academy of Sciences (in Chinese).
|
| [20] |
ZHANG TAO, LIN JIAN, GAO JINYAO, 2011. Interactions between hotspots and the southwest Indian Ridge during the last 90 Ma: implications on the formation of oceanic plateaus and intra-plate seamounts[J]. Science China Earth Sciences, 54(8): 1177-1188 (in Chinese).
|
| [21] |
ZHANG TAO, LIN JIAN, GAO JINYAO, 2013. Magmatism and tectonic processes in Area A hydrothermal vent on the southwest Indian Ridge[J]. Science China Earth Sciences, 56(12): 2186-2197 (in Chinese).
|
| [22] |
ZHAO MINGHUI, QIU XUELIN, LI JIABIAO, et al, 2010. Research development and prospect on three-dimensional seismic structures of slow and ultraslow spreading ocean ridges[J]. Journal of Tropical Oceanography, 29(6): 1-7 (in Chinese).
|
| [23] |
ZHENG SIHUA, GAO YUAN, 1994. Azimuthal anisotropy of Chinese continental lithosphere[J]. Acta Seismologica Sinica, 16(2): 131-140 (in Chinese).
|
| [24] |
|
| [25] |
|
| [26] |
|
| [27] |
|
| [28] |
|
| [29] |
|
| [30] |
|
| [31] |
|
| [32] |
|
| [33] |
|
| [34] |
|
| [35] |
|
| [36] |
|
| [37] |
|
| [38] |
|
| [39] |
|
| [40] |
|
| [41] |
|
| [42] |
|
| [43] |
|
| [44] |
|
| [45] |
|
| [46] |
|
| [47] |
|
| [48] |
|
| [49] |
|
| [50] |
|
| [51] |
|
| [52] |
|
| [53] |
|
/
| 〈 |
|
〉 |


