
褐斜鲽(Plagiopsetta glossa)线粒体基因组特征及重排机制研究
作者简介:董江星(1989—), 男, 河南省鹤壁市人, 硕士, 从事鱼类分类及系统进化研究。E-mail: djx571@yeah.net
收稿日期: 2017-04-11
要求修回日期: 2017-05-25
网络出版日期: 2018-02-02
基金资助
国家自然科学基金项目(31471979、30870283)
Characteristic analysis of the complete mitogenome of Plagiopsetta glossa and a possible mechanism for gene rearrangement
Received date: 2017-04-11
Request revised date: 2017-05-25
Online published: 2018-02-02
Supported by
National Natural Science Foundation of China (31471979, 30870283)
Copyright
冠鲽科(Samaridae)隶属于鲽形目(Pleuronectiformes), 包含冠鲽属(Samaris)、沙鲽属(Samariscus)和斜鲽属(Plagiopsetta)。目前研究表明, 冠鲽(Samaris cristatus)和满月沙鲽(Samariscus latus)的线粒体基因组结构都有重排, 并且两者的基因数量也有差别。为检测斜鲽属鱼类中是否也有不同的特征结构, 我们选用褐斜鲽(Plagiopsetta glossa)作为代表种进行斜鲽属鱼类线粒体基因组特征分析, 同时与冠鲽属及沙鲽属鱼类的线粒体基因组特征进行对比。分析显示, 褐斜鲽的线粒体基因组全长为18723bp, 包括39个基因: 13个蛋白基因、24个tRNA基因、2个rRNA基因、2个控制区、1个轻链复制起点和比典型基因组多的13个间隔子。和经典鱼类的线粒体基因组相比, 褐斜鲽和满月沙鲽都多了tRNA-Cys和tRNA-Tyr两个tRNA, 冠鲽只多了tRNA-Cys, 且3个种类都多了一个控制区, 但褐斜鲽与满月沙鲽的基因排列顺序相同。褐斜鲽线粒体基因的重排导致不同位置的6个tRNA形成了六连体基因簇“tRNA-Cys1-Tyr1- Ser1-Lys-Arg-Ser2”, “ND5-ND6-Glu-Cytb-Thr”则位于六连体之后, 但这11个基因相对的排序没有发生变化。采用双复制随机丢失模型(double replications and random loss, DRRL)对褐斜鲽基因的重排现象进行分析, 认为该鱼类基因数量、排列顺序以及比典型基因组多13个间隔子等特征为该模型提供了新的依据。
董江星 , 时伟 , 孔晓瑜 , 陈世喜 . 褐斜鲽(Plagiopsetta glossa)线粒体基因组特征及重排机制研究[J]. 热带海洋学报, 2018 , 37(1) : 1 -11 . DOI: 10.11978/2017041
The family Samaridae in Pleuronectiformes consists of three genera, namely, Plagiopsetta, Samariscus and Samaris. Studies on mitochondrial genomes of Samaris cristatus and Samariscus latus showed that there exist differences in genomic rearrangement and gene number between this two species. To determine whether there are structural differences in the species of the genus Plagiopsetta, Plagiopsetta glossa were used as the representative species for this study, and the mitochondrial genomic characteristics of this species were compared with those of Samariscus and Samaris. The length of its mitogenome is 18,723 bp, and contains 39 genes, including 13 protein-coding genes, two rRNA genes, 24 tRNA genes, two control regions, one light strand replication origin, and 13 more interspaces. Compared with the typical mitogenome in teleosts, P. glossa and S. latus have two more genes of tRNA-Cys and tRNA-Tyr (S. cristatus only one more tRNA-Cys). Additionally, each of the three flatfish has an extra control region, but the gene orders of P. glossa and S. latus mitogenomes are the same. Six genes (tRNA-Cys1, tRNA-Tyr1, tRNA-Ser1, tRNA-Lys, tRNA-Arg, and tRNA-Ser2) from different locations are clustered together forming a gene cluster, and following by this genes cluster was ND5-ND6-Glu-Cytb-Thr, all those 11 genes have no gene order change in terms of typical mitogenome.
The model of Double Replications and Random Loss was used to analyze the possible rearrangement mechanism in P. glossa mitogenome. The characteristics of gene number, gene order and 13 more interspaces provided new evidence to support the applicability of this model. The results of this study not only enrich our scientific knowledge of mitogenomic features, but also provide more data for further study on mitochondrial evolution and phylogenetic analysis for flatfish.
Key words: Pleuronectiformes; Samaridae; mitogenome; gene rearrangement; molecular evolution
Tab. 1 The primers used for amplification in Plagiopsetta glossa mitogenomes表1 扩增褐斜鲽线粒体全基因引物使用表 |
| 正向引物 | 序列(5′—3′) | 反向引物 | 序列(5′—3′) |
|---|---|---|---|
| Z15 | ATTAAAGCATAACHCTGAAGATGTTAAGAT | F2753 | TAGATAGAAACTGACCTGGATTACTCCGGT |
| Z2625 | GTTTACGACCTCGATGTTGGATCAGGACAT | F6746 | GCGGTGGATTGTAGACCCATARACAGAGGT |
| Z-Ile | AAGGRHYACTTTGATAGAG | FND5-1180 | ATRATNGCRTCYTTDGARWARAANCC |
| ZND5-1050 | GCNATRCTNTTYYTNTGYTCNGGNTC | F-Cytb | TGNCCRATRAKVAYRWADGGRTSTTC |
| ZND6-210 | GCHARNGCNRCHGARTANGCAAA | FCOI-70 | CCHACYATNCCDGCYCARGCMCCRAA |
| Z6468 | CCACATCTDCTGCATGCAAAYCAYACACTT | FATP6-495 | AGRTGNCCNGCNGTBARRTTNGCNGT |
| ZATP-310 | ACHTTYACNCCHACHACNCARCTNTC | FND4-865 | CCYATGTGVCYNACDGADGAGTADGC |
| Z10818 | TTYGAAGCAGCCGCMTGATACTGACAYTT | F13413 | TAGCTGCTACTCGGATTTGCACCAAGAGT |
| Z13347 | AAGGATAACAGCTCATCCGTTGGTCTTAGG | F49 | GGCCCATCTTAACATCTTC |
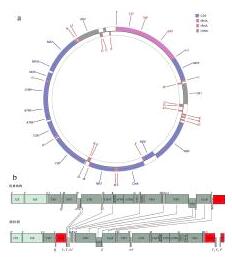
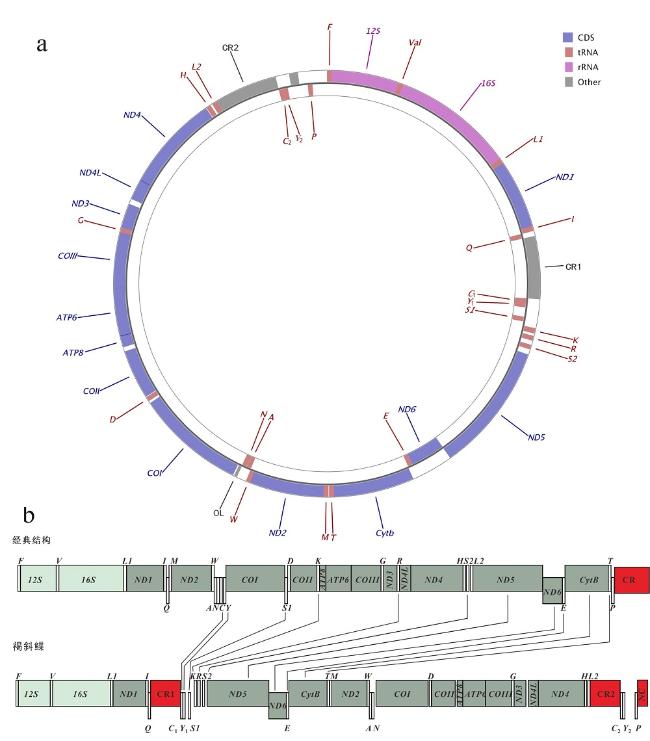
Fig. 1 Gene map of P. glossa mitogenomeand the features of gene rearrangement. (a) Gene map of P. glossa mitogenome; (b) the features of gene rearrangement. repeat region representes repeat sequence. Protein-coding genes are indicated by dark green boxes, rRNA by light green boxes, CRs (control region) and NC (non-coding region) by red boxes, and tRNA by white columns. The genes and their full names are listed in |
Tab. 2 Organization of P. glossa mitochondrial genome表2 褐斜鲽线粒体基因组结构 |
| 基因 | 位置 | 长度 | 密码子 | 间隔区 | |||||
|---|---|---|---|---|---|---|---|---|---|
| 起始 | 终止 | bp | aa | 起始 | 终止 | 反密码子 | 编码链 | ||
| Phe(F) | 1 | 68 | 68 | GAA | H | 0 | |||
| 12S | 69 | 1019 | 951 | H | 0 | ||||
| Val(V) | 1020 | 1091 | 72 | TAC | H | 0 | |||
| 16S | 1092 | 2814 | 1723 | H | 0 | ||||
| Leu1(L1) | 2815 | 2888 | 74 | TAA | H | 0 | |||
| ND1 | 2889 | 3863 | 975 | 324 | ATG | TAA | H | 0 | |
| Ile(I) | 3864 | 3935 | 72 | GAT | H | 0 | |||
| Gln(Q) | 3934 | 4005 | 72 | TTG | L | -2 | |||
| CR1 | 4006 | 4898 | 893 | H | 0 | ||||
| Cys1(C1) | 4899 | 4966 | 68 | GCA | L | 0 | |||
| Tyr1(Y1) | 4967 | 5034 | 68 | GTA | L | 0 | |||
| Ser1(S1) | 5176 | 5246 | 71 | TGA | L | 141 | |||
| Lys(K) | 5309 | 5383 | 75 | TTT | H | 62 | |||
| Arg(R) | 5418 | 5487 | 70 | TCG | H | 34 | |||
| Ser2(S2) | 5549 | 5615 | 67 | GCT | H | 61 | |||
| ND5 | 5691 | 7529 | 1839 | 612 | ATG | TAA | H | 75 | |
| ND6 | 7526 | 8047 | 522 | 173 | ATG | TAG | L | -4 | |
| Glu(E) | 8049 | 8117 | 69 | TTC | L | 1 | |||
| Cytb | 8122 | 9262 | 1141 | 380 | ATG | T | H | 4 | |
| Thr(T) | 9263 | 9333 | 71 | TGT | H | 0 | |||
| Met(M) | 9341 | 9409 | 69 | CAT | H | 7 | |||
| ND2 | 9410 | 10456 | 1047 | 348 | ATG | TAG | H | 0 | |
| Trp(W) | 10455 | 10524 | 70 | TCA | H | -2 | |||
| Ala(A) | 10526 | 10593 | 68 | TGC | L | 1 | |||
| Asn(N) | 10595 | 10667 | 73 | GTT | L | 1 | |||
| OL | 10663 | 10706 | 44 | L | -5 | ||||
| COⅠ | 10724 | 12274 | 1551 | 516 | GTG | TAA | H | 17 | |
| Asp(D) | 12306 | 12373 | 68 | GTC | H | 31 | |||
| COⅡ | 12381 | 13079 | 699 | 232 | ATG | AGA | H | 7 | |
| ATP8 | 13141 | 13308 | 168 | 55 | ATG | TAA | H | 61 | |
| ATP6 | 13299 | 13982 | 684 | 227 | ATG | TAA | H | -10 | |
| COⅢ | 13982 | 14767 | 786 | 261 | ATG | TAA | H | -1 | |
| Gly(G) | 14767 | 14836 | 70 | TCC | H | -1 | |||
| ND3 | 14837 | 15187 | 351 | 116 | ATG | TAA | H | 0 | |
| ND4L | 15261 | 15557 | 297 | 98 | ATG | TAA | H | 73 | |
| ND4 | 15551 | 16924 | 1374 | 457 | ATG | AGA | H | -7 | |
| His(H) | 16932 | 17000 | 69 | GTG | H | 7 | |||
| Leu2(L2) | 17028 | 17100 | 73 | TAG | H | 27 | |||
| CR2 | 17101 | 17997 | 897 | H | 0 | ||||
| Cys2(C2) | 17998 | 18065 | 68 | GCA | L | 0 | |||
| Tyr2(Y2) | 18066 | 18133 | 68 | GTA | L | 0 | |||
| Pro(P) | 18436 | 18506 | 71 | TGG | L | 302 | |||
| NC | 18507 | 18723 | 217 | H | 0 | ||||
注: 基因后括号中的字母代表该基因的缩写; 间隔区中的负值表示该基因与上边基因间的碱基重叠数; NC表示非编码区序列 |
Fig. 2 Aligned sequences of the control regions of P. glossa and seven other flatfish. CR1 and CR2: the two control regions in P. glossa mitogenome; Sla: Samariscus latus, NC_024263; Pol: Paralichthys olivaceus, NC_002386; Pco: Pleuronichthys cornutus NC_022445; Hhi: Hippoglossus hippoglossus, NC_009709; Hst: Hippoglossus stenolepis, NC_009710; Rhi: Reinhardtius hippoglossoides, NC_009711; Vmo: Verasper moseri, NC_008461. The shaded sequences represent the conservative blocks. TAS: terminal associated sequence; CSB: conserved sequence block图2 褐斜鲽控制区和其他7种鲽形目鱼类的控制区序列特征比较 |
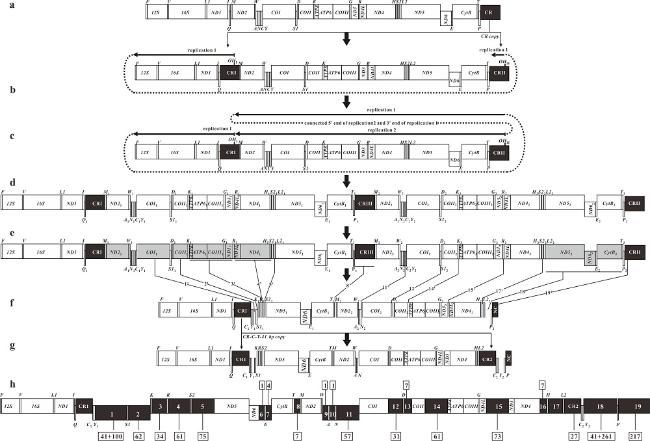
Fig. 3 The inferred mechanism of gene rearrangement from the ancestral gene order to that of P. glossa mitogenome based on the DRRL model. Protein-coding genes and rRNA are indicated by boxes, and tRNA genes are indicated by columns. Genes labeled above the diagram are encoded by the H-strand, and the others, by the L-strand. OH indicates the origin of replication for the H-strand; the direction of replication is shown by arrows. The dark boxes indicate the control regions (CRs), noncoding region (NC) and intergenic spacers. (a) The ancestral mitogenome with 37 genes and one CR. (b) The ancestral CR was duplicated to CRⅠ and CRⅡ, and then CRⅠ was translocated to the position between tRNA-Q and tRNA-M. A first mitochondrial replication event (RP1) was initiated at OHⅠ. (c) After RP1 passed through OHⅡ, secondary replication (RP2) began at OHⅡ. Both replications terminated close to the site of OHⅠ. (d) The duplication of 29 genes and one CR yielded by double replications. (e) One of each copied gene pair was lost randomly. Dark gray boxes indicate degenerated genes. The italic lines indicate the positions of intergenetic spaces from the degenerated genes. The numbers marked by prime indicate the order of the intergenetic spaces in genenome. (f) The order of genes, CRs and intergenic spaces after the loss of several genes. (g) The mitogenome of P. glossa was formed after CRⅠ-tRNA-C1-Y1 and the first 41 bp of Non-coding sequence 1 duplicated and translocated to the position between tRNA-L2 and tRNA-P. (h) The positions and lengths of intergenic spacers of P. glossa. The number in black shaded boxes indicate the intergenic spacer order in mitogenome. The numbers in the boxes above and below represent the length of the intergenic spacers. The boxes above the diagram indicate the sites of intergenic spacers same as the typical one in teleosts; the others are only in P. glossa图3 应用双复制随机丢失模型推测的褐斜鲽线粒体基因重排过程 |
The authors have declared that no competing interests exist.
| [1] |
|
| [2] |
|
| [3] |
|
| [4] |
|
| [5] |
|
| [6] |
|
| [7] |
|
| [8] |
|
| [9] |
|
| [10] |
|
| [11] |
|
| [12] |
|
| [13] |
|
| [14] |
|
| [15] |
|
| [16] |
|
| [17] |
|
| [18] |
|
| [19] |
|
| [20] |
|
| [21] |
|
| [22] |
|
| [23] |
|
| [24] |
|
| [25] |
|
| [26] |
|
| [27] |
|
| [28] |
|
| [29] |
|
| [30] |
|
| [31] |
|
| [32] |
|
| [33] |
|
| [34] |
|
| [35] |
|
| [36] |
|
| [37] |
|
| [38] |
|
/
| 〈 |
|
〉 |

