黄、东海边界悬浮物输运量的卫星遥感估算

  • 尹小青 , 1, 2 ,
  • 杨顶田 , 1 ,
  • 周立柱 1, 2
展开
  • 1. 热带海洋环境国家重点实验室(中国科学院南海海洋研究所), 广东 广州 510301
  • 2. 中国科学院大学, 北京 100049;
杨顶田。E-mail: dtyang@scsio.ac.cn

作者简介:尹小青(1990—), 男, 山东省东营市人, 硕士研究生, 从事海洋水色遥感研究。E-mail:

收稿日期: 2017-03-20

  要求修回日期: 2017-10-30

  网络出版日期: 2018-04-11

基金资助

国家自然科学基金项目(U1405234、41776180)

广东省科技计划国际合作项目(2016A050502038)

Estimation of suspended particulate matter transport via the boundary waters of the Yellow Sea and the East Sea based on satellite remote sensing

  • YIN Xiaoqing , 1, 2 ,
  • YANG Dingtian , 1 ,
  • ZHOU Lizhu 1, 2
Expand
  • 1. State Key Laboratory of Tropics Oceanography (South China Sea Institute of Oceanology, Chinese Academy of Sciences), Guangzhou 510301, China
  • 2. University of Chinese Academy of Sciences, Beijing 100049, China;
Corresponding author: YANG Dingtian E-mail:

Received date: 2017-03-20

  Request revised date: 2017-10-30

  Online published: 2018-04-11

Supported by

National Natural Science Foundation of China (U1405234, 41776180)

Sciences and Technonlgies Foundation of Guangzhou Province (2016A050502038)

Copyright

热带海洋学报编辑部

摘要

利用2002—2015年的中等分辨率成像光谱仪(Moderate Resolution Imaging Spectroradiometer, MODIS)第4波段反射率产品对黄、东海边界的悬浮物输运情况进行了分析, 同时利用黄、东海2003年现场实测的悬浮物含量数据和这期间准实时的MODIS影像数据, 建立了基于MODIS第4波段遥感反射率的悬浮物含量遥感反演模型。基于该模型, 反演黄、东海表层悬浮物浓度, 并计算悬浮物扩散面积。利用反演得到的表层悬浮物浓度和悬浮物浓度垂向预测模型, 获取垂直方向上的悬浮物浓度, 同时结合水深、扩散面积数据, 计算特定时刻水体中的悬浮物含量。利用插值方法获得整个输运过程中各时刻水体中的悬浮物的含量, 计算各个时刻悬浮物含量的总和作为悬浮物的输送量。对2002年10月至2003年4月黄海向东海的悬浮输送量进行估算, 估算结果为153Mt。

本文引用格式

尹小青 , 杨顶田 , 周立柱 . 黄、东海边界悬浮物输运量的卫星遥感估算[J]. 热带海洋学报, 2018 , 37(2) : 10 -16 . DOI: 10.11978/2017031

Abstract

In this paper, the transport of suspended matter in the surface of the Yellow Sea and the East Sea was analyzed through the fourth band reflectivity of the Moderate Resolution Imaging Spectroradiometer (MODIS) from 2002 to 2015. In the meantime, the in situ data of suspended matter content in the Yellow Sea and the East Sea in 2003 as well as the quasi-real time MODIS image data during this period were utilized to establish a remote sensing inversion model of suspended matter content based on MODIS fourth band remote sensing reflectivity. Using this model, the concentration of suspended matter in the surface layer of the Yellow Sea and the East China Sea was reversed, and the diffusion area of suspended matter was calculated. Then, according to the surface suspended matter concentration obtained from the inversion model and the suspended matter concentration of vertical prediction model, the suspended matter in the vertical direction was estimated. Meanwhile, the suspended matter content in the water at a specific time was calculated by taking into account of water depth and diffusion area. Next, the suspended matter content in the water at various moments during the transport was figured out using cubic polynomial interpolation, from which the transport amount at various moments was derived. The estimated transport amount of suspended matter from the Yellow Sea to the East Sea from October 2002 to April 2003 was 0.153 billion tons.

悬浮物是海水的重要组成部分, 其在海水中的扩散、迁移、沉积, 往往会对海洋的生态、环境、资源等产生重要的影响。黄、东海作为悬浮物含量最高的海域之一(杨作升 等, 1992; 孙效功 等, 2000), 利用现场实测悬浮物资料和遥感卫星资料, 专家和学者对于该海域的悬浮物做过大量的研究(秦蕴珊 等, 1986, 1989; 杨作升 等, 1991, 1992; Tang et al, 1998; 孙效功 等, 2000; Kishino et al, 2000; 白虹 等, 2002; 郭志刚 等, 2002; Zhang et al, 2010; 杨扬, 2010; 余佳 等, 2014; Chen et al, 2015), 涉及悬浮物的时空分布及悬浮物输运的空间格局、特征、影响因素和来源等方面。但这些研究多数是定性分析, 对悬浮物输送量的定量估算研究并不多。
悬浮物输送通量是计算悬浮物输送量的重要参数, 通常由海流流速和悬浮物浓度计算得到。海流流速和悬浮物浓度数据均可由现场实测得到, 这样得到的数据准确性高, 但各观测点数据的观测的时间连续性和空间覆盖度有限, 所以该方法对于小区域观测海域更有效。如李本川 等(1980)利用吕四剖面2天的水文观测数据, 估算了老黄河口悬浮物的南下通量。Bi 等(2011)利用2006年冬季和2007年夏季单站点24h连续观测数据, 估算了渤海海峡的悬浮物通量。
对于大面积观测海域, 悬浮物浓度通常采用卫星遥感进行反演。通过建立实测悬浮物浓度与遥感反射率或浊度之间的相关关系, 利用拟合公式反演悬浮物浓度(Miller et al, 2004; 马荣华 等, 2007; 崔廷伟 等, 2009; 王飞 等, 2014; Qiu et al, 2017; Yang et al, 2016; Wang et al, 2016; Shang et al, 2016; Robert et al, 2016)。结合海流流速, 便可估算某界面的悬浮物输送量(Pang et al, 2003, 2011; Fettweis et al, 2007)。但是, 由于实测海流流速数据相对较少, 所以海流流速获取通常采用数值模拟方法, 采用的模型有POM (Princeton Ocean Model)、HYCOM (Hybrid Coordinate Ocean Model)和ROMS (Regional Ocean Model System)等。由于模型的初设设定条件、机制等不同, 计算结果往往也不相同。如庞重光 等(2004)利用POM模式计算了32°N断面悬浮物输送量, 每年黄海向东海净输送量为50Mt; 而王勇智 等(2007)利用HYCOM模式估算每年黄海与东海之间的悬浮物净输送量为东海向黄海输送4.4Mt。Qiu 等(2017)利用实测悬浮物浓度结合HYCOM模型, 估算的黄、东海之间的悬浮泥沙输送量为19.5Mt。
本文提出一种悬浮物输送量的计算方法, 在不考虑海流流速情况下, 利用卫星遥感反演获得表层悬浮物浓度和扩散范围, 结合悬浮物垂向浓度预测模型, 并利用插值方法计算悬浮物的输送量。

1 数据与方法

1.1 实测悬浮物浓度

现场实测悬浮物浓度数据为2003年春季在南黄海和东海北部海域采集, 共计85个站点, 并根据水深及现场实际情况, 每站设置1~5层水样, 底层样品一般距海底5~10m, 共计采集水样342个, 实验过程严格按照海洋调查规范中有关海洋地质地球物理调查标准来进行, 站点分布如图1
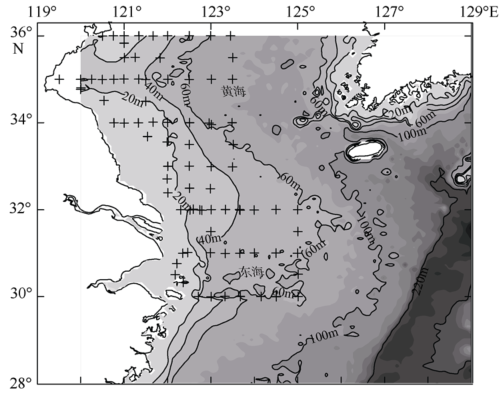
Fig. 1 Locations of the survey stations (black crosses) in 2003

图1 观测站点分布
黑色十字为采样点

1.2 MODIS数据

中等分辨率成像光谱仪(Moderate Resolution Imaging Spectroradiometer, MODIS)是搭载在美国航空航天局(National Aeronautics and Space Administration, NASA)的Terra和Aqua卫星上的主要传感器, 具有36个波段, 波段范围可覆盖可见光到热红外波段(0.4~14.4μm), 其中可见光—短波红外波段20个, 热红外波段16个, 能够提供250、500、1000m 3种不同空间分辨率的数据。Terra和Aqua两颗卫星可以在上下午分别对同一地点进行观测, 所以MODIS的时间分辨率可以达到半天, 因而MODIS遥感数据具有时间分辨率高、空间分辨率较高和能够持续观测的优点。本文所使用的是MODIS L1b数据产品, 是经过仪器标定, 但未经大气校正, 包含有地理坐标产品的数据, MODIS L1b数据存储格式为HDF-EOS, 大多数的遥感软件均可以对其进行处理。本文使用ENVI 4.8软件进行处理, 所有数据均按以下步骤进行处理。
1) 几何校正及蝴蝶结效应的去除。几何校正采用建立GLT(geographic lookup table)的方法, 利用MODIS L1b数据所自带的经纬度数据, 建立GLT, 通过GLT完成MODIS数据的几何校正。
2) 图像镶嵌。通过ENVI软件自带图像镶嵌功能模块实现。
3) 云检测和云去除。本文采用多光谱云监测方法, 利用多波段运算确定云层覆盖区域的阈值范围, 利用掩膜方法去除(李微 等, 2005)。
4) 大气校正。本文采用ENVI 4.8 的FLAASH大气校正方法, 该方法采用MODTRAN4+辐射传输模型, 可有效消除水蒸气/气溶胶散射效应。
5) 天顶角校正。卫星在探测过程中, 由于探测点的太阳位置不同, 会造成传感器接收的辐射发生偏差, 并随着太阳高度角的增大而增大。所以需要对影像数据进行天顶角校正。订正公式为:
$R=R(Z_s)/cos(Z_s)$
其中, R为校正后的反射率, R(Zs)为定标后反射率, Zs为太阳天顶角。由于MODIS L1b数据中自带Solar Zenith数据集, 本文利用该数据集完成对太阳天顶角的订正(周靖斐 等, 2010)。

1.3 表层悬浮物浓度反演模型

MODIS第1波段(640~670nm)和第4波段(545~ 565nm)波段反射率与悬浮物有良好的相关性, 常用于近岸水体悬浮物浓度的反演(Zhang et al, 2010)。利用2003年春季现场观测悬浮物浓度数据和大气校正后遥感反射率, 建立单波段表层悬浮物浓度反演模型。MODIS第4波段遥感反射率与悬浮物浓度相关性可以达到0.8708(图2)。

1.4 悬浮物垂向浓度计算

根据悬移质扩散平衡理论, 平衡态下水中某点悬浮物浓度可以表示为:
$\frac{C_v}{C_{va}}=e^{-\omega(y-a)/\varepsilon _y}$
可转化为:
$ln(\frac{C_v}{C_{va}})=-\frac{\omega}{\varepsilon _y}(y-a)$
其中, Cv、Cva分别为水深y和水深a处的悬浮物浓度, εy为垂向扩散系数, ω为流速。若是εyω均为已知, 水深a处悬浮物浓度已知, 则可计算水深y处的悬浮物浓度。
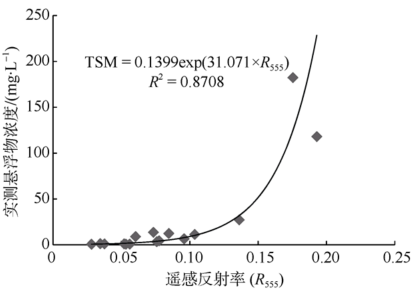
Fig. 2 Total Suspended Matter (TSM) as an exponential function of the radio of reflectance values of band 4

图2 波段遥感反射率(R555)与实测悬浮物浓度拟合结果

2 相关分析

2.1 表层悬浮物分布

黄、东海之间的悬浮物输运主要发生在冬季, 携带大量悬浮物的沿岸流由于受到北上的暖流影响, 在32°—33°N作用会分为两支, 一支沿岸南下, 另一支则转向东南。本文利用NASA提供的第四遥感反射率数据对悬浮物的扩散情况进行分析。由于受云层影响, 遥感反射率的月平均数据会出现无数据情况, 所以将2002—2015年的1—12月数据分别求均值。由图3可知, 夏半年(5—9月)悬浮物近岸海域; 冬半年(10—4月)中10月悬浮物向外输送开始出现, 到2月悬浮物范围达到最大, 4月末悬浮物范围退向近岸。

2.2 表层悬浮物浓度和面积统计

获取各个时刻由黄海进入东海的悬浮物扩散的面积和浓度分布, 可进一步估算悬浮物垂向浓度分布数据。以2003年为例, 选取2002年10月—2003年4月中云量少的遥感影像进行浓度反演(图4), 反演公式为第4波段模型, 并统计由黄海进入东海的悬浮物扩散的面积和平均悬浮物浓度(表1)。其中, 悬浮物扩散面积以123°30′E和黄、东海边界为界计算。
Tab.1 Statistics of suspended solids concentration and diffusion area

表1 悬浮物扩散面积和浓度统计表

月份 浓度/(mg·L-1) 面积/(×104km2)
10 3.51 0.17
11 6.27 2.4
12 8.21 4.0
1 7.41 5.1
2 5.95 5.3
3 4.55 2.1
4 3.57 0.4
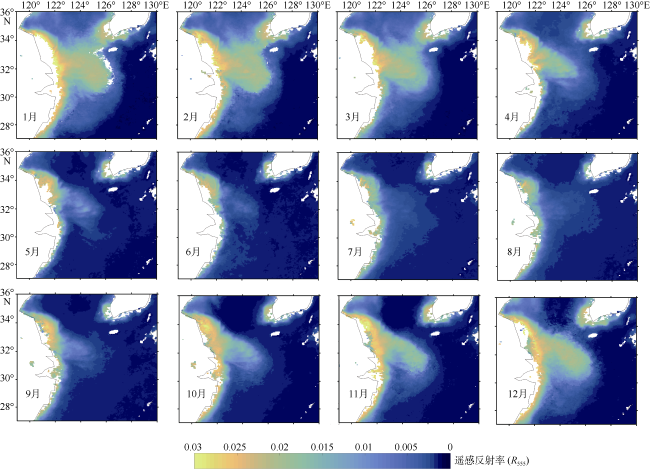
Fig. 3 Distribution of SPM from May to Sept in the Yellow Sea and East Sea

图3 黄、东海边界表层悬浮物分布图

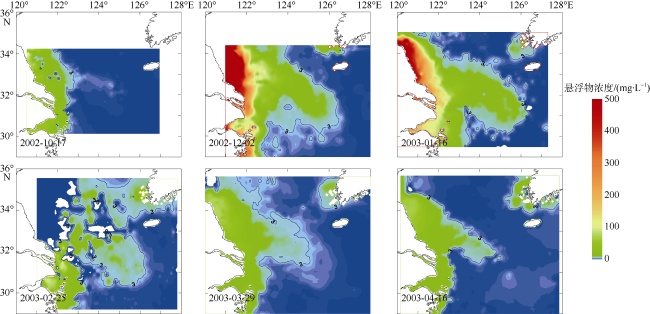
Fig. 4 Distributions of SPM from Oct to April in the Yellow Sea and the East China Sea

图4 冬半年(10—4月)表层悬浮物浓度分布

2.3 垂向悬浮物浓度

悬浮物的垂向浓度预测模型, 多是基于现场点位实测悬浮物浓度, 结合悬浮物输运理论, 建立表、底层悬浮物浓度之间的相关关系(庞重光 等, 2009; 伊小飞 等, 2015)。庞重光 等(2009)利用1959— 2006年期间24个航次的悬浮物浓度现场观测资料,采用相关分析和回归分析方法, 建立了一套适用不同季节、不同区域的悬浮物浓度的垂向预测模型。本文利用该模型公式, 结合遥感反演的表层悬浮物浓度数据, 计算某一时刻海水中的悬浮物垂向浓度分布, 选用公式如表2。2003年4月7日的垂向悬浮浓度反演结果分布图如图5所示。
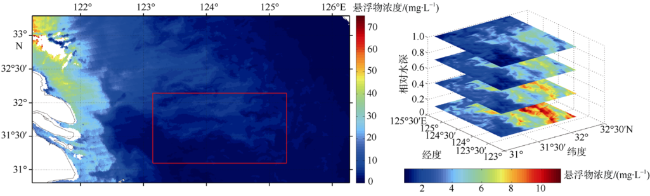
Fig. 5 Inversion results of vertical distribution of SPM concentration on Mar 29, 2003

图5 2003年3月29日悬浮物表层反演浓度(左)和垂向预测浓度分布图(右, 对应红色框线范围)

Tab. 2 Regression model for vertical distribution of SPM concentration in different seasons

表2 悬浮物垂向浓度预测公式

季节 公式
秋季 ln(C/C0)=0.704-0.799hr
冬季 ln(C/C0)=0.437-0.476hr
春季 ln(C/C0)=0.557-0.657hr

注: hr为相对水深,C0为表层悬浮物浓度, C为相对水深处hr的悬浮物浓度

3 悬浮物输送量计算及讨论

卫星影像拍摄的是某时刻的悬浮物的瞬时影像, 所以利用反演得到的表层悬浮物浓度、模型计算的悬浮物垂向浓度、扩散面积、水深等数据, 计算也是某特定时刻悬浮物含量。所以依据多个已知时刻的悬浮物含量, 利用插值方法便可以计算出从第一年的10月到第二年的4月的整个输运过程中, 不同时刻海水中的悬浮物含量。
悬浮物在黄、东海之间的输运主要发生在10月— 4月, 以2002年10月—2003年4月为例, 假定整个输运过程为212天, 利用已知时刻的表层悬浮物浓度和扩散面积, 插值出整个输运过程中表层悬浮物浓度和范围的变化情况, 本文所采用的表层悬浮物浓度为已知时刻扩散范围内的平均浓度。采用不同的插值方法, 对悬浮物的扩散面积及扩散范围内的平均浓度变化进行了模拟(图6)。采用三次多项式的插值结果, 以天为单位计算不同时间对应的悬浮物含量。计算了2002年10月—2003年4月插值得到各个时刻海水中悬浮物量的总和, 结果为153 Mt。
对于黄、东海之间的悬浮物输运量, 前人输运量计算结果在19.5~100Mt之间(胡敦欣 等, 2001; 李本川 等, 1980; 董爱国, 2011)之间。与之前结果相比, 本文的计算结果偏大。本研究未考虑海流流速因素, 只考虑不同时间海水中悬浮物含量, 可能会造成悬浮物的重复计算, 同时垂向浓度预测模型计算结果精度低也会对悬浮物的估算值产生影响。
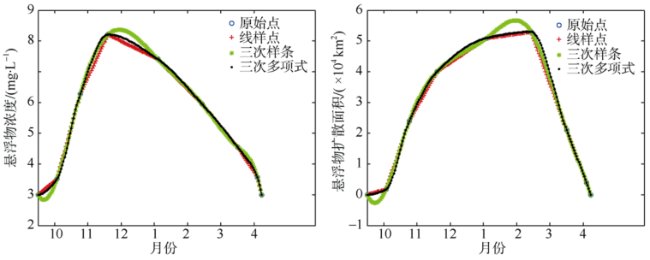
Fig. 6 Interpolation result of SPM concentration in the surface layer and diffusion area

图6 表层悬浮物浓度和扩散面积的插值结果

4 结论

利用MODIS第4波段反射率产品分析悬浮物在黄、东海边界输运规律, 发现悬浮物通常在10月至第二年4月由黄海向东海输送, 10月开始出现, 在2月范围达到最大, 4月向近岸退去。同时利用2003现场实测的悬浮物浓度数据和大气校正后的遥感反射率, 建立了表层悬浮物浓度反演模型, 反演表层悬浮物浓度。
利用由反演得到的悬浮物的扩散面积和浓度, 结合悬浮物浓度垂向预测模型, 计算出每一时刻海水中所含的悬浮物含量。相邻时刻悬浮物含量之间存在定量关系, 利用输送过程中已知几个时刻的悬浮物含量, 插值出其他时刻海水中的悬浮物含量, 计算整个输运过程中各个时刻的悬浮物含量, 求和以估算悬浮物的输送量。本文对2002年10月到2003年4月期间黄、东海之间悬浮物的输送量进行估算,结果为153Mt,与前人的估算结果相比偏大。

The authors have declared that no competing interests exist.

[1]
白虹, 华锋, 冯志纲, 等, 2002. 东海透光度分布的夏季特征及其与陆架悬浮体运移的关系[J]. 海洋科学, 26(5): 45-48.

BAI HONG, HUA FENG, FENG ZHIGANG, et al, 2002. Light transmission in summer and its relation to sediment transportation in the East China Sea[J]. Marine Sciences, 26(5): 45-48 (in Chinese with English abstract).

[2]
崔廷伟, 张杰, 马毅, 等, 2009. 渤海悬浮物分布的遥感研究[J]. 海洋学报, 31(5): 10-18.

CUI TINGWEI, ZHANG JIE, MA YI, et al, 2009. The study on the distribution of suspended particulate matter in the Bohai Sea by remote sensing[J]. Acta Oceanologica Sinica, 31(5): 10-18 (in Chinese with English abstract).

[3]
董爱国, 2011. 黄、东海海域沉积物的源汇效应及其环境意义[D]. 青岛: 中国海洋大学.

DONG AIGUO, 2011. Source, sink and its environmental record of sediments in Yellow Sea and East China Sea[D]. Qingdao: Ocean University of China (in Chinese with English abstract).

[4]
郭志刚, 杨作升, 张东奇, 等, 2002. 冬、夏季东海北部悬浮体分布及海流对悬浮体输运的阻隔作用[J]. 海洋学报, 24(5): 71-80.

GUO ZHIGANG, YANG ZUOSHENG, ZHANG DONGQI, et al, 2002. Seasonal distribution of suspended matter in the northern East China Sea and barrier effect of current circulation on its transport[J]. Acta Oceanologica Sinica, 24(5): 71-80 (in Chinese with English abstract).

[5]
胡敦欣, 韩舞鹰, 章申, 等, 2001.长江、珠江口及邻近海域陆海相互作用[M]. 北京: 海洋出版社: 1-218.

[6]
李本川, 李成治, 1980. 苏北平原海岸地貌特征及沿岸泥沙动态[J]. 海洋科学, 4(3): 12-17.

[7]
李微, 方圣辉, 佃袁勇, 等, 2005. 基于光谱分析的MODIS云检测算法研究[J]. 武汉大学学报信息科学版, 30(5): 435-438, 443.

LI WEI, FANG SHENGHUI, DIAN YUANYONG, et al, 2005. Cloud Detection in MODIS data based on spectrum Analysis[J]. Geomatics and Information Science of Wuhan University, 30(5): 435-438,443 (in Chinese English abstract).

[8]
马荣华,宋庆君,唐军武,等, 2007. 太湖秋季水体遥感反射比的简单经验估测模型[J]. 湖泊科学, 19(3):227-234.

MA RONGHUA, SONG QINGJUN, TANG JUNWU, et al, 2007. A simple empirical model for remote sensing reflectance of Lake Taihu waters in autumn[J]. Journal of Lake Sciences, 19(3): 227-234 (in Chinese with English Abstract).

[9]
庞重光, 白学志, 胡敦欣, 2004. 渤、黄、东海海流和潮汐共同作用下的悬浮物输运、沉积及其季节变化[J]. 海洋科学集刊, 46: 32-41.

PANG CHONGGUANG, BAI XUEZHI, HU DUNXIN, 2004. The transport and sedimentation of suspended matter and their seasonal variation are affected by circulation and tide current in the Bohai Sea, the Yellow Sea and the East China Sea[J]. Studia Marina Sinica, 46: 32-41 (in Chinese with English abstract).

[10]
庞重光, 韩丹岫, 赵恩宝, 2009. 黄东海悬浮泥沙浓度的垂向分布特征及其回归模型[J]. 泥沙研究, (5): 69-75.

PANG CHONGGUANG, HAN DANXIU, ZHAO ENBAO, 2009. Characteristics and Regression equations for vertical distribution of suspended sediment concentration in the Yellow Sea and East China Sea[J]. Journal of Sediment Research, (5): 69-75 (in Chinese with English abstract).

[11]
秦蕴珊, 李凡, 郑铁民, 等, 1986. 南黄海冬季海水中悬浮体的研究[J]. 海洋科学, 10(6): 1-7.

QIN YUNSHAN, LI FAN, ZHENG TIEMIN, et al, 1986. A study on total suspended matter in winter in the South Yellow Sea[J]. Marine Sciences, 10(6): 1-7 (in Chinese with English abstract).

[12]
秦蕴珊, 李凡, 徐善民, 等, 1989. 南黄海海水中悬浮体的研究[J]. 海洋与湖沼, 20(2): 101-112.

QIN YUNSHAN, LI FAN, XU SHANMIN, et al, 1989. Suspended matter in the south Yellow Sea[J]. Oceanologia et Limnologia Sinica, 20(2): 101-112 (in Chinese with English abstract).

[13]
孙效功, 方明, 黄伟, 2000. 黄、东海陆架区悬浮体输运的时空变化规律[J]. 海洋与湖沼, 31(6): 581-587.

SUN XIAOGONG, FANG MING, HUANG WEI, 2000. Spatial and temporal variations in suspended particulate matter transport on the Yellow and East China sea shelf[J]. Oceanologia Et Limnologia Sinica, 31(6): 581-587 (in Chinese with English abstract).

[14]
王飞, 王珊珊, 王新, 等, 2014. 杭州湾悬浮泥沙遥感反演与变化动力分析[J]. 华中师范大学学报(自然科学版), 48(1): 112-116, 135.

WANG FEI, WANG SHANSHAN, WANG XIN, et al, 2014. Remote Sensing retrieval and dynamic driving force analysis of suspended sediment in Hangzhou Bay[J]. Journal of Huazhong Normal University (Natural Sciences), 48(1): 112-116, 135 (in chinese with English abstract).

[15]
王勇智, 江文胜, 2007. 渤、黄、东海悬浮物质量浓度冬、夏季变化的数值模拟[J]. 海洋科学进展, 25(1): 28-33.

WANG YONGZHI, JIANG WENSHENG, 2007. Numerical simulation of variations in winter and summer suspended material concentrations in the Bohai Sea, Yellow Sea and East China Sea[J]. Advances in Marine Science, 25(1): 28-33 (in Chinese with English abstract).

[16]
杨扬, 2010. 黄东海悬浮物变化规律的研究[D]. 青岛:中国科学院研究生院(海洋研究所).

YANG YANG, 2010. Study on the change regulation of suspended matter in the Yellow Sea[D]. Qingdao: Graduate University of Chinese Academy of Sciences (in Chinese with English abstract).

[17]
杨作升, 郭志刚, 王兆祥, 等, 1991. 黄、东海毗邻海域悬浮体与水团的对应关系及影响因素[J]. 青岛海洋大学学报, 21(3): 55-69.

YANG ZUOSHENG, GUO ZHIGANG, WANG ZHAOXIANG, et al, 1991. Suspended matter in the Yellow Sea and East China sea: its contents, distribution, relation to the water masses and factors of influence[J]. Journal of Ocean University of Qingdao, 21(3): 55-69 (in Chinese with English abstract).

[18]
杨作升, 郭志刚, 王兆祥, 等, 1992. 黄东海陆架悬浮体向其东部深海区输送的宏观格局[J]. 海洋学报, 14(2): 81-90.

[19]
伊小飞, 王凯, 施心慧, 2015. 长江口外海域悬沙浓度垂向剖面实用模型计算法[J]. 湖南师范大学自然科学学报, 38(1): 12-16.

YI XIAOFEI, WANG KAI, SHI XINHUI, 2015. A new method to estimate the Profile of Suspended Sediment Concentration in the offshore near the Changjiang estuary[J]. Journal of Natural Science of Hunan Normal University, 38(1): 12-16 (in Chinese with English abstract).

[20]
余佳, 王厚杰, 毕乃双, 等, 2014. 基于MODIS L1B数据的黄海悬浮体季节性分布的反演[J]. 海洋地质与第四纪地质, 34(1): 1-9.

YU JIA, WANG HOUJIE, BI NAISHUANG, et al, 2014. Seasonal distribution and variation of suspended sediment in the Yellow Sea in 2010 based on retrieved monthly data from MODIS L1B Imagery[J]. Marine Geology & Quaternary Geology, 34(1): 1-9 (in Chinese with English abstract).

[21]
周靖斐, 周汝良, 李绍辉, 等, 2010. MODIS L1B数据的辐射定标及太阳天顶角订正研究[J]. 西南林学院学报, 30(3): 77-81.

ZHOU JINGFEI, ZHOU RULIANG, LI SHAOHUI, et al, 2010. Research of MODIS L1B level data radiometric correction and solar Zenith correction[J]. Journal of Southwest Forestry University, 30(3): 77-81 (in Chinese with English abstract).

[22]
BI NAISHUANG, YANG ZUOSHENG, WANG HOUJIE, et al, 2011. Seasonal variation of suspended-sediment transport through the southern Bohai Strait[J]. Estuarine, Coastal and Shelf Science, 93(3): 239-247.

[23]
CHEN JUN, LIU JIANLI, 2015. The spatial and temporal changes of chlorophyll-a and suspended matter in the eastern coastal zones of China during 1997-2013[J]. Continental Shelf Research, 95: 89-98.

[24]
FETTWEIS M, NECHAD B, VAN DEN EYNDE D, 2007. An estimate of the suspended particulate matter (SPM) transport in the southern North Sea using SeaWiFS images, in situ measurements and numerical model results[J]. Continental Shelf Research, 27(10-11): 1568-1583.

[25]
KISHINO M, TANAKA A, OISHI T, et al, 2000. Temporal and spatial variability of chlorophyll a, suspended solids, and yellow substance in the Yellow Sea and East China Sea using ocean color sensor[C]//Proceedings of the SPIE Hyperspectral Remote Sensing of the Ocean, Sendai, Japan: SPIE.

[26]
MILLER R L, MCKEE B A, 2004. Using MODIS Terra 250 m imagery to map concentrations of total suspended matter in coastal waters[J]. Remote Sensing of Environment, 93(1-2): 259-266.

[27]
PANG CHONGGUANG, BAI XUEZHI, HU DUNXIN, 2003. Numerical study of water and suspended matter exchange between the Yellow Sea and the east China Sea[J]. Chinese Journal of Oceanology and Limnology, 21(3): 214-221.

[28]
PANG CHONGGUANG, YU WEI, YANG YANG, et al, 2011. An improved method for evaluating the seasonal variability of total suspended sediment flux field in the Yellow and East China Seas[J]. International Journal of Sediment Research, 26(1): 1-14.

[29]
QIU ZHONGFENG, XIAO CONG, PERRIE W, et al, 2017. Using Landsat 8 data to estimate suspended particulate matter in the Yellow River estuary[J]. Journal of Geophysical Research: Oceans, 122(1): 276-290.

[30]
ROBERT E, GRIPPA M, KERGOAT L, et al, 2016. Monitoring water turbidity and surface suspended sediment concentration of the Bagre Reservoir (Burkina Faso) using MODIS and field reflectance data[J]. International Journal of Applied Earth Observation and Geoinformation, 52: 243-251.

[31]
SHANG PEI, SHEN FANG, 2016. Atmospheric correction of satellite GF-1/WFV imagery and quantitative estimation of suspended particulate matter in the Yangtze Estuary[J]. Sensors, 16(12): 1997.

[32]
TANG D L, NI I-H, MÜLLER-KARGER F E, et al, 1998. Analysis of annual and spatial patterns of CZCS-derived pigment concentration on the continental shelf of china[J]. Continental Shelf Research, 18(12): 1493-1515.

[33]
WANG SHENGQIANG, HUAN YU, QIU ZHONGFENG, et al, 2016. Remote sensing of particle cross-sectional area in the Bohai sea and Yellow Sea: algorithm development and application implications[J]. Remote Sensing, 8(10): 841.

[34]
YANG XUEFEI, MAO ZHIHUA, HUANG HAIQING, et al, 2016. Using GOCI retrieval data to initialize and validate a sediment transport model for monitoring diurnal variation of SSC in Hangzhou Bay, China[J]. Water, 8(3): 108.

[35]
ZHANG MINWEI, TANG JUNWU, DONG QING, et al, 2010. Retrieval of total suspended matter concentration in the Yellow and East China Seas from MODIS imagery[J]. Remote Sensing of Environment, 114(2): 392-403.

文章导航

/