
海南东方近岸海域海浪观测特征研究
作者简介:冯兴如(1984—), 男, 副研究员, 博士, 主要从事风暴潮海浪相互作用及其数值模拟。E-mail:fengxingru07@qdio.ac.cn
收稿日期: 2017-09-20
要求修回日期: 2017-11-28
网络出版日期: 2018-05-03
基金资助
国家重点研发计划(2016YFC1402000、2016YFC1401500)
国家自然科学基金项目(41406018、41476019)
Characteristics of ocean waves in coastal area of Dongfang, Hainan Island based on observations
Received date: 2017-09-20
Request revised date: 2017-11-28
Online published: 2018-05-03
Supported by
National Key Research and Development Program of China (2016YFC1402000, 2016YFC1401500)
National Natural Science Foundation of China (41406018, 41476019)
Copyright
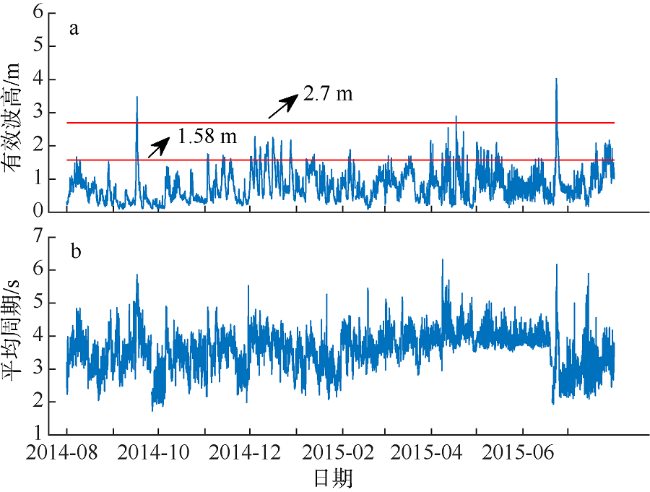
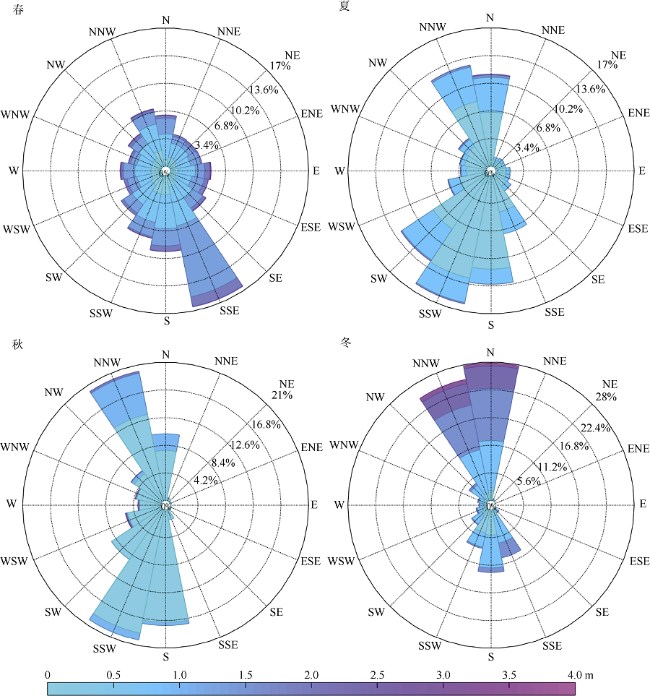
利用海南东方近岸海域2014年至2015年间一整年的海浪观测资料, 分析了海浪的时间变化特征。观测时间段内, 有效波高最大值为4.03m, 平均值0.79m; 平均周期最大值为6.32s, 平均值为3.58s。该海域冬季波高较大, 秋季最小, 常浪向为SSW方向, 强浪向为WSW向。基于该长期观测数据, 文章亦研究了平均周期、有效波高之间的关系, 同时还确立了该海域波高与平均持续时间之间的关系。最后讨论了观测时间段内波浪能流密度的变化特征, 发现一年中能流密度大于2kW·m-1的频率为26%, 且从全年的计算结果来看, 观测位置处12月的波浪能较适宜开发, 但总体波浪能资源不够丰富。文章对于认识海南东方近岸海域波浪特征以及工程设计都具有重要的意义。
冯兴如 , 李近元 , 尹宝树 , 杨德周 , 陈海英 , 高冠东 . 海南东方近岸海域海浪观测特征研究[J]. 热带海洋学报, 2018 , 37(3) : 1 -8 . DOI: 10.11978/2017102
Temporal variation characteristics of ocean waves in the coastal area of Dongfang, Hainan are analyzed based on observations of ocean waves for a whole year from Aug 1, 2014 to Jul 31, 2015. During the observation period, the maximum height of the significant wave height was 4.03m, the average was 0.79m; the maximum value of the mean period was 6.32s, and the average was 3.58 seconds. In this sea area, the wave height was higher in winter, with minimum in autumn. The normal wave direction was SSW, and the strong wave direction was WSW. Based on the one-year observation data, the relation between the mean period and significant wave height was studied, and the relation between the significant wave height and its mean duration was also established. Finally, the variation characteristics of wave energy density in the observation period were discussed. We found that the frequency of wave energy density above 2kW·m-1 in one year was 26%, and the wave energy at the observation location increased faster in December, but the total wave energy resources were not rich enough. The results obtained in this study are of great significance for understanding the wave characteristics and engineering design of the coastal area of Dongfang, Hainan.
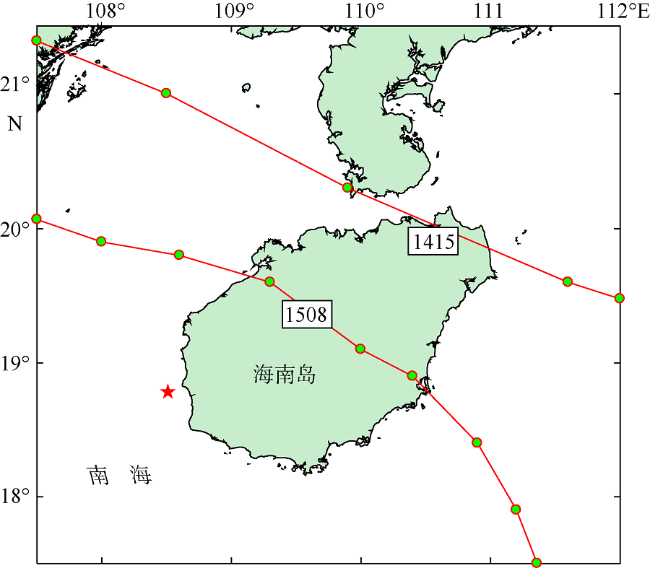
Fig. 1 Location of the wave observation station (the red star) and the typhoon track during the observation period. The red circles represent the typhoon center at an interval of 6 hours图1 波浪定点观测位置(红色五角星)及观测期间的台风过程(红色圆圈代表每6h间隔的台风中心位置) |
Fig. 2 Variation of significant wave height (a)and mean period (b)over one year图2 整年有效波高(a)和平均周期(b)的时间变化曲线 |
Fig. 3 Rose diagrams of significant wave height (m)in the four seasons of spring, summer, autumn, and winter图3 春夏秋冬4个季节的有效波高(m)玫瑰图 |
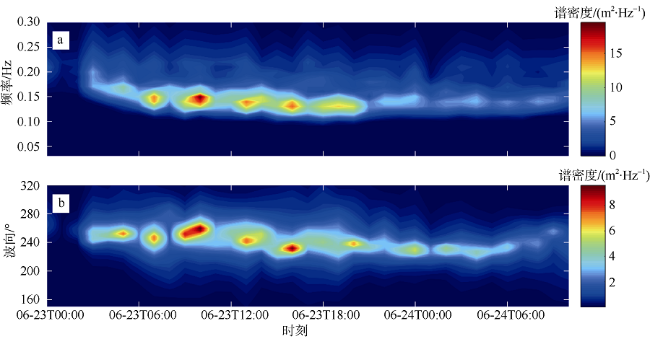
Fig. 4 Distribution and temporal evolution of wave spectrum in frequency (a) and wave direction (b) during Typhoon Kujira (1508)图4 1508号台风过程期间海浪谱在频率(a)和波向(b)上的分布及时间变化 |
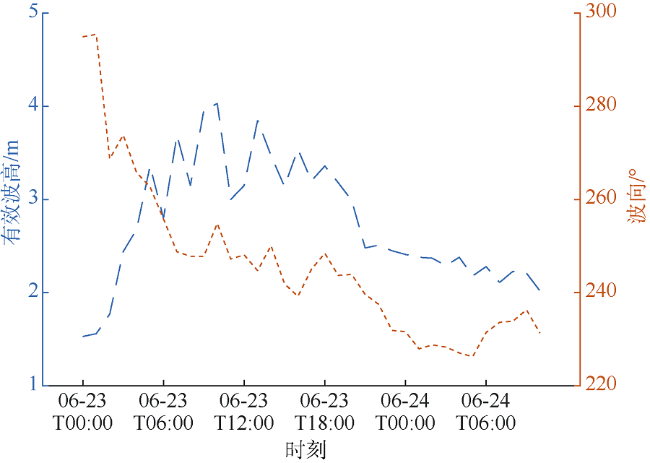
Fig. 5 Observations of significant wave height and wave direction during Typhoon Kujira (1508)图5 1508号台风过程期间的有效波高和波向观测结果 |
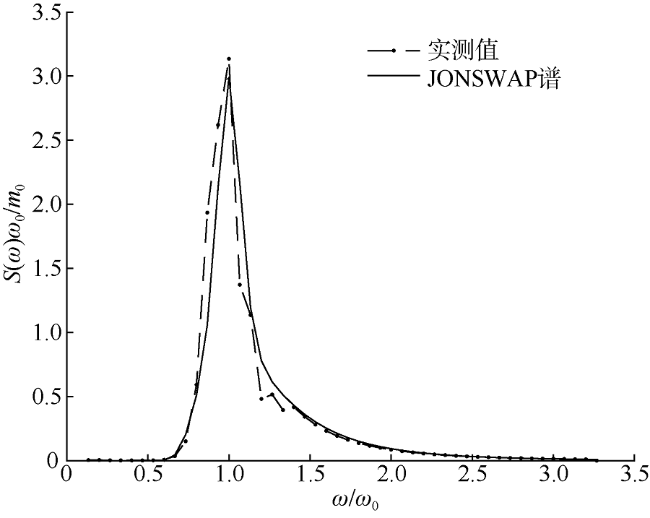
Fig. 6 Wave spectrum during the typhoon图6 观测位置台风过程中海浪谱 |
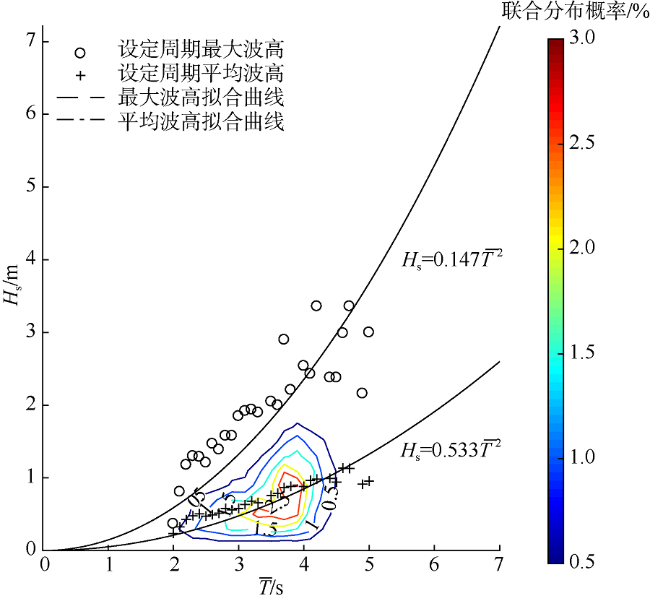
Fig. 7 Joint distribution of wave height and period (%). Hs is significant wave height, and $\overline{T}$ is mean period图7 波高与周期联合分布(%) |
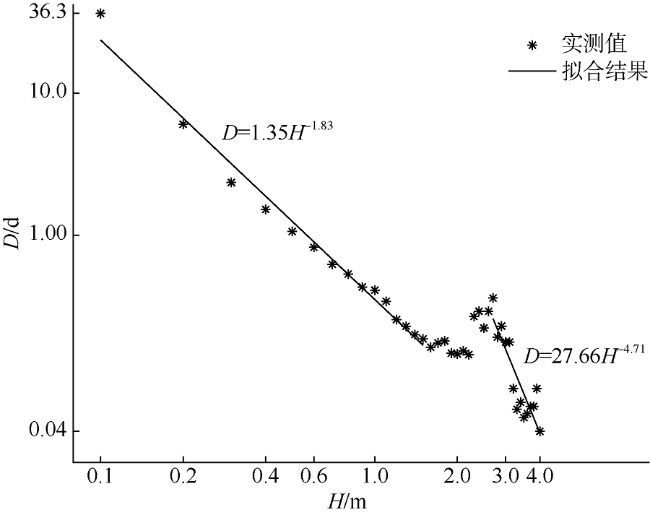
Fig. 8 Variation of the average wave height persistence duration with wave height图8 波高平均持续时间随波高的变化 |
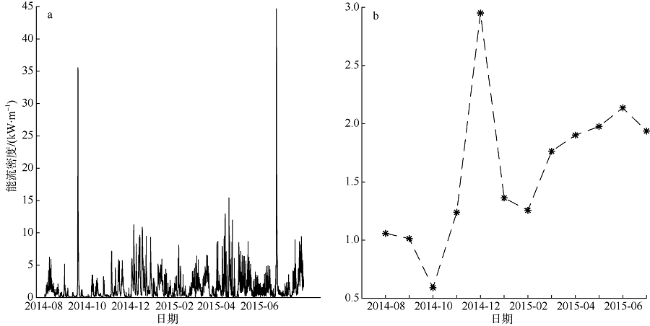
Fig. 9 Variation of wave energy over one year (a)and variation of monthly averages wave energy over one year (b)图9 整年海浪能流密度变化曲线(a)与月平均的能流密度变化曲线(b) |
The authors have declared that no competing interests exist.
| [1] |
|
| [2] |
|
| [3] |
|
| [4] |
|
| [5] |
|
| [6] |
|
| [7] |
|
| [8] |
|
| [9] |
|
| [10] |
|
| [11] |
|
| [12] |
|
| [13] |
|
| [14] |
|
| [15] |
|
| [16] |
|
| [17] |
|
| [18] |
|
| [19] |
|
| [20] |
|
/
| 〈 |
|
〉 |
