
深圳东部近岸海域溶解氧的时空分布特征
作者简介: 庄晓珊(1987), 女, 广东省汕尾市人, 硕士研究生, 从事海洋水质环境监测。E-mail: zxs@lightsun.com.cn
收稿日期: 2018-02-27
要求修回日期: 2018-06-04
网络出版日期: 2018-10-13
基金资助
深圳市海洋局资助项目(301200800174-01)
Spatial and temporal distribution of dissolved oxygen in the coastal waters of eastern Shenzhen
Received date: 2018-02-27
Request revised date: 2018-06-04
Online published: 2018-10-13
Supported by
Municipality Oceanic Administraction of Shenzhen Funded Project (301200800174-01)
Copyright
根据2012—2016年的9个浮标自动监测数据, 分析了深圳东部近岸海域溶解氧浓度的时空分布特征及其与主要水质参数的相关关系。结果表明, 大亚湾海域溶解氧浓度含量在2.15~14.86mg·L-1之间, 平均值为7.31mg·L-1, 大鹏湾海域整体表层溶解氧浓度范围为1.43~15.61mg·L-1, 平均值为7.13mg·L-1; 在时间分布上, 深圳东部海域溶解氧含量呈现白天高于夜间, 春、夏、秋季低, 冬季高的趋势; 在空间分布上, 深圳东部海域溶解氧含量呈现出夏秋季大亚湾高于大鹏湾, 春冬季大亚湾和大鹏湾相差不大的特点。Pearson相关性分析表明, 该海区溶解氧含量与温度、盐度、浊度及叶绿素a存在显著的线性相关性, 且相关关系呈现出随季节变化的差异性。
庄晓珊 , 桓清柳 , 彭莹 , 王节亮 , 庞仁松 , 周凯 . 深圳东部近岸海域溶解氧的时空分布特征[J]. 热带海洋学报, 2018 , 37(5) : 98 -105 . DOI: 10.11978/2018021
In the present work, we analyzed the spatial and temporal distribution of dissolved oxygen (DO) and the relationships between DO and water quality parameters of coastal waters in the eastern Shenzhen area. The data were collected from nine automated monitoring buoy platforms from 2012 to 2016. The results showed the ranges of DO in Daya Bay and Mirs Bay were from 2.15 to 14.86 mg·L-1 and from 1.43 to 15.61 mg·L-1, respectively. The mean DO in Daya Bay and Mirs Bay were 7.31 and 7.13 mg·L-1, respectively. Analysis showed the DO during daytime was higher than in nighttime, and the DO was higher during winter than in the other seasons. For comparison between locations, the DO in Daya Bay was higher than Mirs Bay in fall and summer but showed no difference in spring and winter. Pearson’s correlation analysis revealed the DO exhibited seasonally dependent linear relationships with temperature, salinity, turbidity, and chlorophyll-a concentration, respectively.
Tab. 1 Locations of buoys and their sampling periods表1 浮标站位坐标与采样的时间范围 |
| 站位 | 东经/° | 北纬/° | 时间范围/(年.月) | |
|---|---|---|---|---|
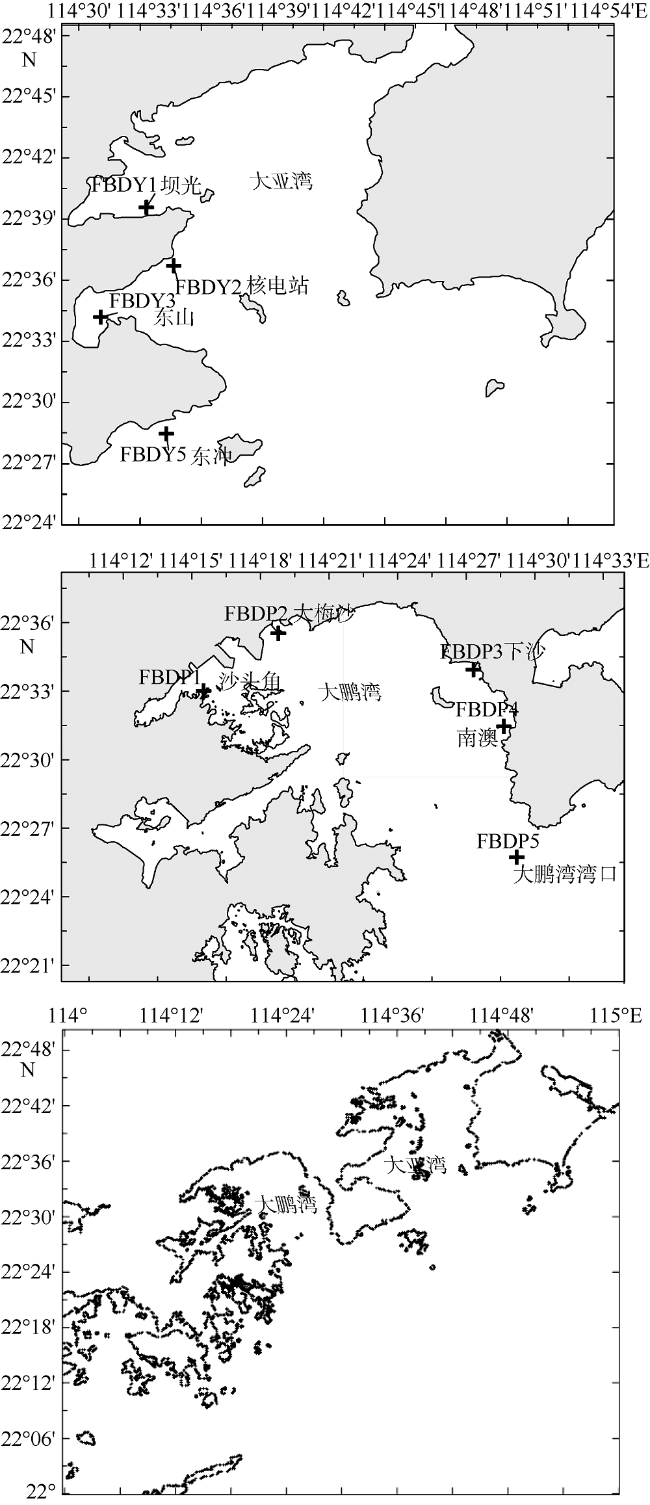
| 大亚湾 | FBDY1坝光 | 114°33'18.60" | 22°39'34.19" | 2013.12—2016.12 |
| FBDY2核电站 | 114°34'39.108" | 22°36'42.012" | 2013.7—2016.12 | |
| FBDY3东山 | 114°31'4.20" | 22°34'10.8" | 2012.1—2016.12 | |
| FBDY5东冲 | 114°34'17.4" | 22°28'27.599988" | 2013.10—2016.12 | |
| 大鹏湾 | FBDP1沙头角 | 114°15'32" | 22°33'5" | 2014.8—2016.12 |
| FBDP2大梅沙 | 114°18'48" | 22°35'36" | 2012.1—2016.12 | |
| FBDP3下沙 | 114°27'20.4" | 22°34'1.2" | 2012.1—2016.12 | |
| FBDP4南澳 | 114°28'40.20" | 22°31'31.8" | 2012.1—2016.12 | |
| FBDP5大鹏湾湾口 | 114°29'14" | 22°25'49" | 2014.7—2016.12 |
Fig. 1 Map of buoy monitoring stations in Shenzhen eastern coast图 1 深圳东部海域浮标分布 |
Tab. 2 Number of data points collected from each buoy表2 各浮标站位观测次数 |
| 大亚湾 | 大鹏湾 | ||||||||
|---|---|---|---|---|---|---|---|---|---|
| 站位 | FBDY1 坝光 | FBDY2 核电站 | FBDY3 东山 | FBDY5 东冲 | FBDP1 沙头角 | FBDP2 大梅沙 | FBDP3 下沙 | FBDP4 南澳 | FBDP5 大鹏湾湾口 |
| 观测次数 | 49866 | 422262 | 80440 | 48537 | 49866 | 708081 | 82696 | 82649 | 22488 |
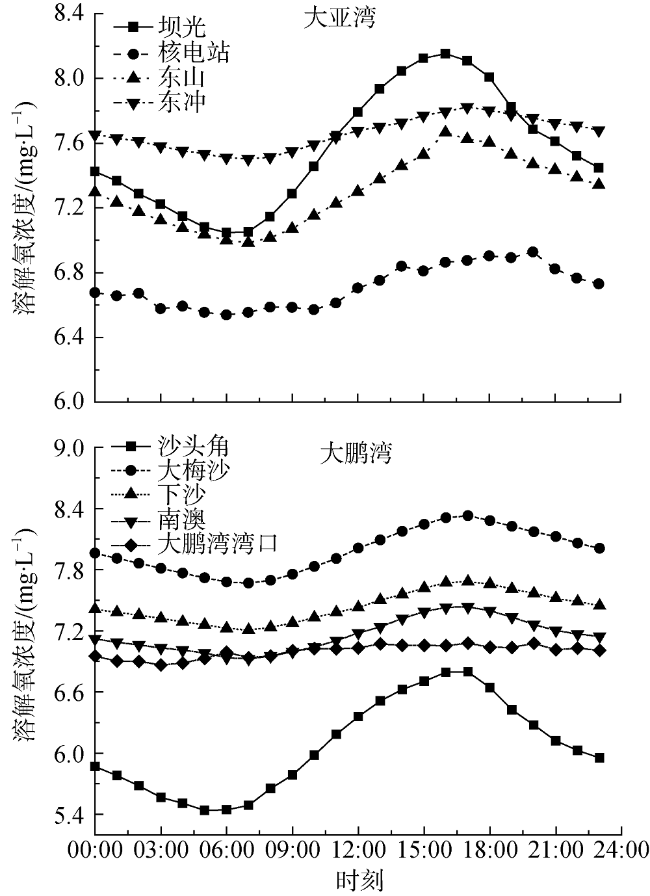
Fig. 2 Diurnal change of dissolved oxygen (DO) during 2012-2016图2 2012—2016年溶解氧浓度的日变化 |
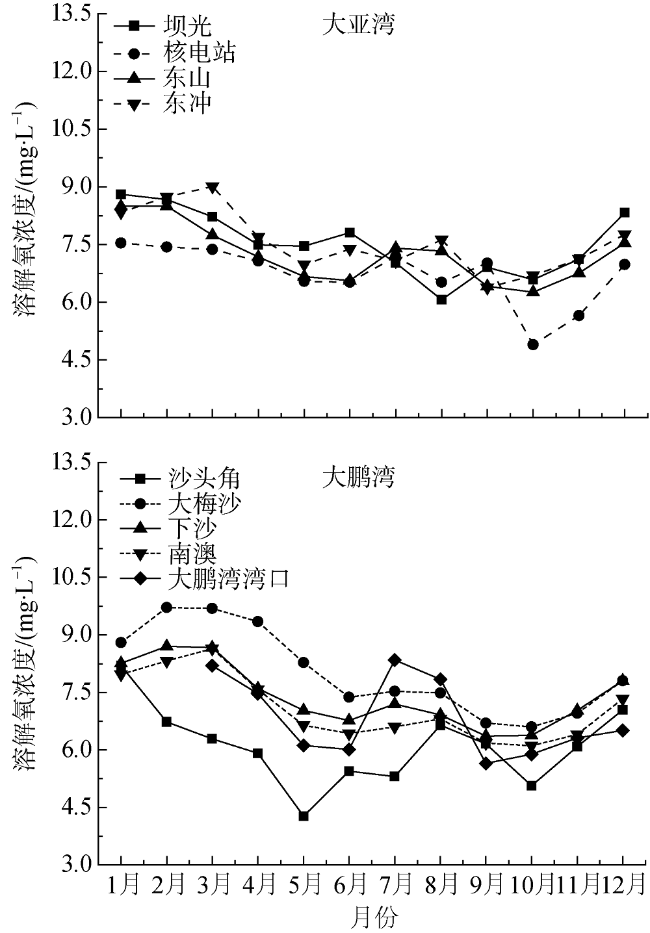
Fig. 3 Seasonal variation of DO during 2012-2016图3 2012—2016年溶解氧浓度的月变化 |
Tab. 3 Seasonal distributions of DO in surface coastal waters off eastern Shenzhen during 2012-2016表3 2012-2016年深圳东部海域表层海水溶解氧浓度季节分布特征 |
| 海区 | 溶解氧浓度绝对含量(mg·L-1) | |||||||
|---|---|---|---|---|---|---|---|---|
| 春季 | 夏季 | 秋季 | 冬季 | |||||
| 量值范围 | 平均值 | 量值范围 | 平均值 | 量值范围 | 平均值 | 量值范围 | 平均值 | |
| 大鹏湾 | 3.11~21.89 | 7.45 | 1.04~23.06 | 6.85 | 1.07~10.69 | 6.26 | 2.12~19.22 | 8.06 |
| 大亚湾 | 1.47~20.03 | 7.45 | 0.39~21.34 | 7.04 | 0.25~17.28 | 6.64 | 2.4~19.28 | 8.10 |
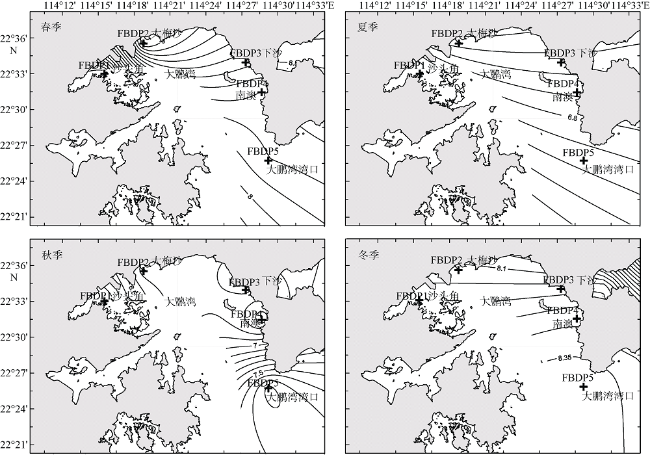
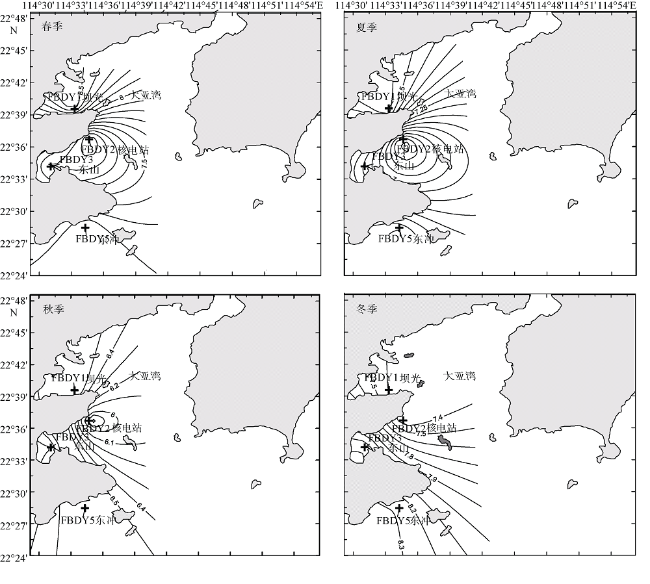
Fig. 4 Spatial distributions of DO in Mirs Bay in four seasons of 2012-2016图4 2012—2016年大鹏湾溶解氧含量(mg·L-1)的时空分布 |
Fig. 5 Spatial distributions of DO in Daya Bay in four seasons of 2012-2016图5 2012—2016年大亚湾溶解氧含量(mg·L-1)的时空分布 |
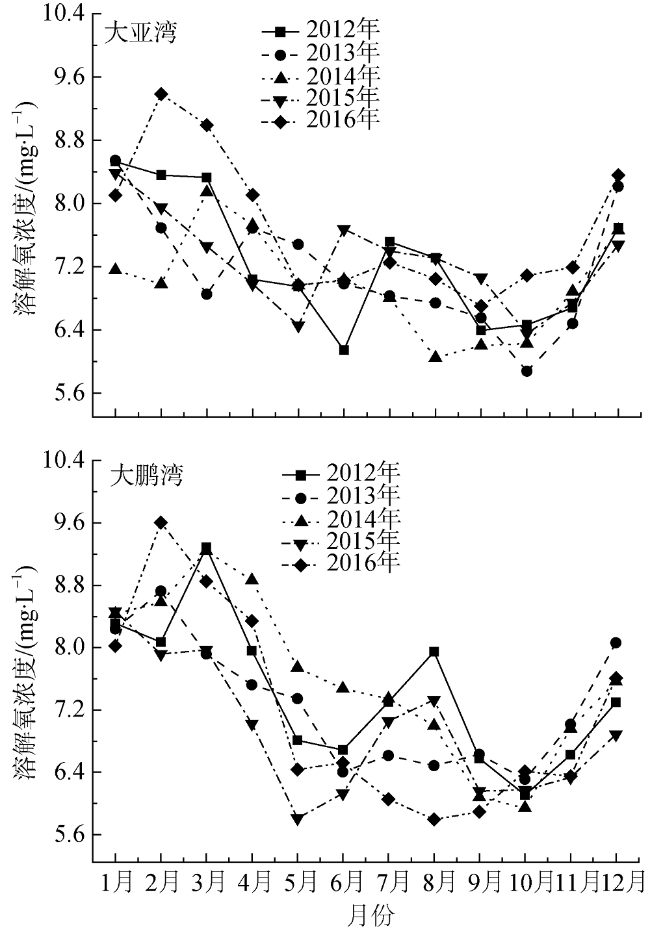
Fig. 6 Seasonal and interannual DO variation from 2012-2016图6 2012—2016年海水溶解氧浓度年月变化 |
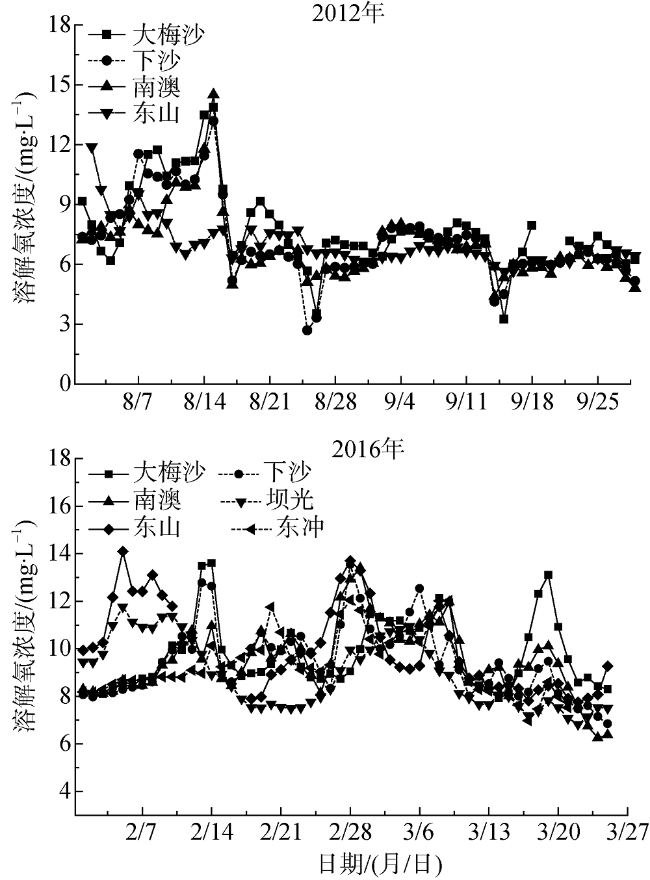
Fig. 7 Daily DO concentration variation for August 2012 to September 2012 and for February 2016 to March 2016图7 2012年8—9月与2016年2—3月海水溶解氧浓度日均值变化 |
Fig. 8 Distributions of DO in the eastern surface waters off Shenzhen图8 深圳东部表层溶解氧浓度的平面分布 |
Tab. 4 Pearson correlation coefficients between DO and each main water quality parameter of the surface costal water off eastern Shenzhen表4 深圳东部海域表层海水溶解氧浓度与主要水质相关参数的相关关系 |
| 海域 季节 | pH | 溶解氧饱和度 | 水温 | 盐度 | 叶绿素a | 浊度 | |||
|---|---|---|---|---|---|---|---|---|---|
| 大亚湾 | 夏季 | -0.127** | 0.343** | 0.163** | -0.066** | 0.194** | 0.054** | ||
| 冬季 | -0.008 | 0.570** | -0.399** | 0.393** | 0.303** | -0.007 | |||
| 大鹏湾 | 夏季 | 0.009* | 0.181** | 0.125** | 0.126** | 0.140** | -0.652** | ||
| 冬季 | 0.682** | 0.489** | 0.405** | 0.175** | 0.200** | -0.066** | |||
注: **表示在P<0.01水平(双侧)上极显著相关; *表示在P<0.05水平(双侧)上显著相关; 未标注表示相关性不明显; N=48952 |
The authors have declared that no competing interests exist.
| [1] |
|
| [2] |
|
| [3] |
|
| [4] |
|
| [5] |
|
| [6] |
|
| [7] |
|
| [8] |
|
| [9] |
|
| [10] |
|
/
| 〈 |
|
〉 |

