
基于SODA资料的南海表层风能输入的空间分布与长期趋势研究
作者简介:杨倩(1993—), 女, 浙江省绍兴市人, 硕士研究生, 主要从事海洋能量研究。E-mail:1678604785@qq.com
收稿日期: 2017-12-18
网络出版日期: 2018-12-24
基金资助
国家自然科学基金项目(41676021、41541040、91228202);近海海洋环境科学国家重点实验室开放课题(MELRS1608)
Spatial patterns and secular trends of wind energy input into the surface layer in the South China Sea based on SODA reanalysis
Received date: 2017-12-18
Online published: 2018-12-24
Supported by
National Natural Science Foundation of China (41676021, 41541040, 91228202);Visiting Fellowship (MELRS1608) from the State Key Laboratory of Marine Environmental Science (Xiamen University)
Copyright
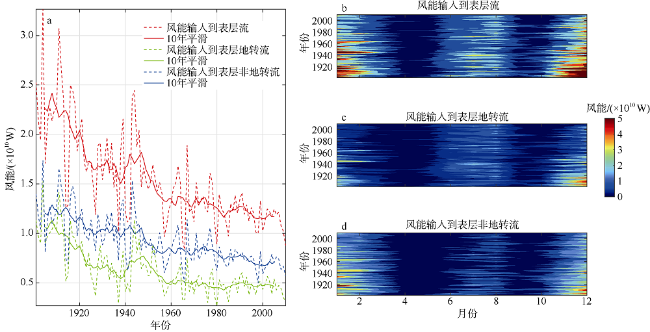
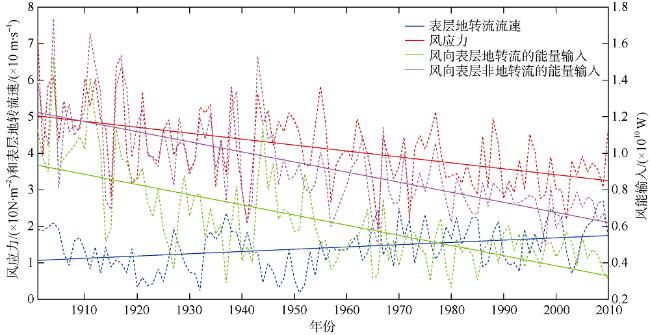
海面风不仅是驱动上层海洋运动的主要动力, 其能量也是维持海洋表层流动的主要机械能来源。为了分析南海表层流风能输入的变化, 用SODA(Simple Ocean Data Assimilation)(1901—2010)资料估算了风向南海表层流(表层地转流+表层非地转流)的能量输入。结果表明, 风向南海表层流、表层地转流和表层非地转流输入的能量总体均呈减少趋势, 110年间分别减小了约56%、65%和49%。导致风能输入减小的最主要因素是风应力的减弱(减小了35%)。由于南海受季风系统的控制, 风向表层流及其各成分输入的能量呈现出显著的季节性变化。冬季风能输入最强, 高值区位于南海西部及北部区域, 呈一个显著的“回力镖”状结构。这些结果对深入认识南海环流具有理论意义。
杨倩 , 崔超然 , 张宇 , 刘志宇 , 管玉平 , 黄瑞新 . 基于SODA资料的南海表层风能输入的空间分布与长期趋势研究[J]. 热带海洋学报, 2018 , 37(6) : 41 -48 . DOI: 10.11978/2017134
Sea surface wind is not merely a major driving force to the upper-ocean currents; the wind energy input is the main source of mechanical energy to keep these currents moving. To analyze the secular trend of wind energy input into the South China Sea (SCS), we calculate the wind energy input into the surface current, surface geostrophic current and surface ageostrophic current from 1901 and 2010 by using SODA (v 2.2.4) data. The results show that during the past 110 years, the trend of the wind energy input into surface current, surface geostrophic current and surface ageostrophic current decreased on the whole. The reducing amplitude is 56%, 65% and 49%, respectively. The dominant factor is the decline of wind stress (about 35%). Due to the monsoon systems, seasonal variation of wind energy input into the SCS is significant. In winter, the wind energy input is the strongest, mainly in the north and west parts of the basin, and the shape of energy input distribution is like a “boomerang.” Our results have some implication for further understanding SCS circulation in terms of energy.
Fig. 1 Time evolution of wind energy input into the South China Sea from 1901 to 2010. |
Fig. 2 The time series of wind energy input and relevant variables in the South China Sea |
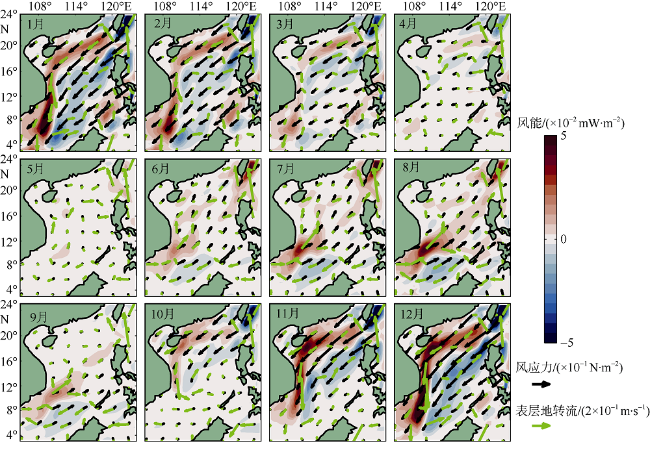
Fig. 4 Spatial distributions of monthly wind energy input into surface geostrophic current in the South China Sea. Black vectors denote wind stress, and green vectors denote surface geostrophic current图4 风向南海表层地转流输入能量的逐月分布图 |
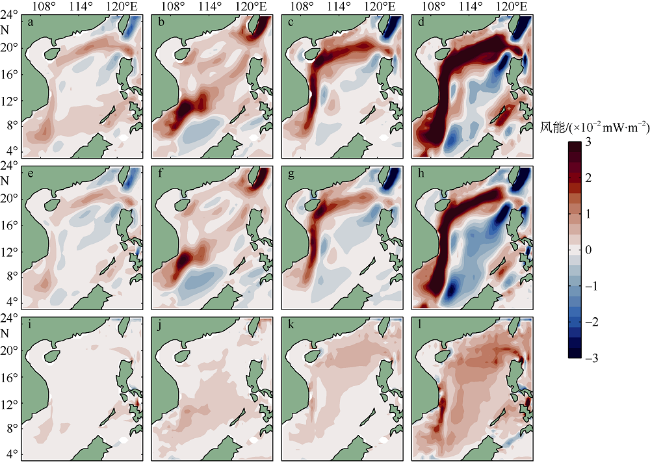
Fig. 3 Spatial patents of seasonal wind energy input into surface current (a, b, c, d), surface geostrophic current (e, f, g, h) and surface ageostrophic current (i, j, k, l) in the South China Sea图3 风向南海表层流(a—d)、表层地转流(e—h)和表层非地转流(i—l)输入能量的季节分布图 |
The authors have declared that no competing interests exist.
| [1] |
|
| [2] |
|
| [3] |
|
| [4] |
|
| [5] |
|
| [6] |
|
| [7] |
|
| [8] |
|
| [9] |
|
| [10] |
|
| [11] |
|
| [12] |
|
| [13] |
|
| [14] |
|
| [15] |
|
| [16] |
|
| [17] |
|
| [18] |
|
| [19] |
|
| [20] |
|
| [21] |
|
| [22] |
|
| [23] |
|
| [24] |
|
| [25] |
|
| [26] |
|
| [27] |
|
| [28] |
|
| [29] |
|
| [30] |
|
| [31] |
|
| [32] |
|
| [33] |
|
| [34] |
|
| [35] |
|
| [36] |
|
| [37] |
|
| [38] |
|
| [39] |
|
| [40] |
|
| [41] |
|
/
| 〈 |
|
〉 |
