
滨珊瑚Sr/Ca的种间和种内差异性*
作者简介:胡敏航(1993—), 男,广西桂林市人,硕士,研究方向:珊瑚礁地质与沉积学。E-mail: huminhang@scsio.ac.cn
收稿日期: 2018-01-11
网络出版日期: 2018-12-24
基金资助
国家自然科学基金(41476038、41676049);中国科学院青年创新促进会基金(2015284)
Inter-species and inter-colony differences of Sr/Ca-SST calibration in Porites
Received date: 2018-01-11
Online published: 2018-12-24
Supported by
National Natural Science Foundation of China (41476038, 41676049);Youth Innovation Promotion Association, Chinese Academy of Sciences (2015284)
Copyright
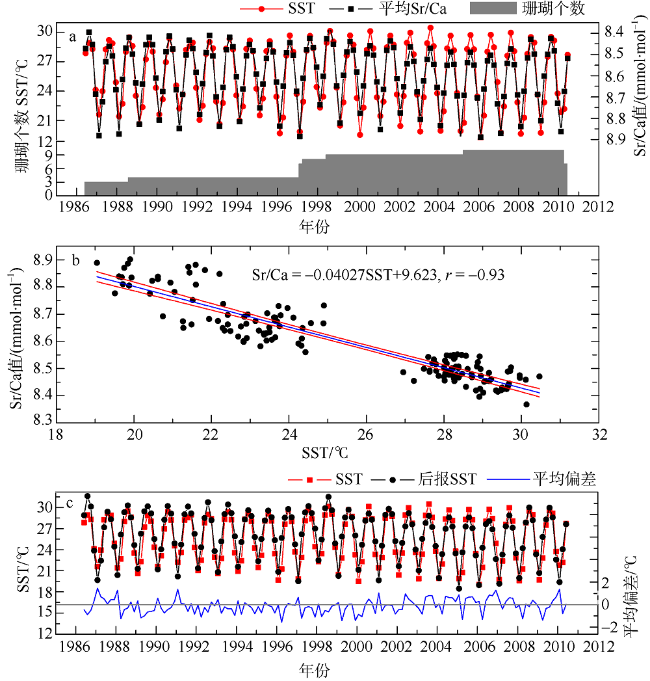
滨珊瑚骨骼的锶和钙元素的比值(Sr/Ca)是重建热带海区海水表面温度(sea surface temperature, SST)变化最常用的地球化学代用指标之一。但是, 珊瑚作为生物体, 其生理活动会对骨骼内的Sr/Ca产生干扰从而影响重建的准确度。文章采用全谱直读等离子体原子发射光谱(Inductively Coupled Plasma Optical Emission Spectrometer, ICP-OES)技术对南海北部涠洲岛两块滨珊瑚的Sr/Ca比值进行测量, 并结合卫星观测的SST值分别建立各个珊瑚个体的Sr/Ca-SST温度计方程。结果显示: 1) 该研究采集的两种滨珊瑚(澄黄滨珊瑚和普哥滨珊瑚)的Sr/Ca值和温度计具有显著的种间差异。因此在古气候重建时, 建议古珊瑚和现代珊瑚严格使用同一种滨珊瑚; 2) 同种滨珊瑚不同个体之间的Sr/Ca也存在差异性, 一方面是由于冬、夏季的极端低、高温对珊瑚生理产生胁迫, 从而造成Sr/Ca出现异常值; 另一方面则是取样误差导致, 尤其是夏季高温和冬季低温时期; 3) 同一珊瑚个体内的不同生长轴的生长率存在显著差异, 然而Sr/Ca却没有显著的差异性, 说明不同生长轴的取样对骨骼Sr/Ca没有显著影响。最后, 文章用多样品的平均值建立Sr/Ca温度计方程, 用于减小个体之间的差异性带来的误差, 得到Sr/Ca(mmol·mol-1)= -0.04027×SST(℃)+9.623的方程。用该温度计对涠洲岛海域的SST后报的误差为±0.6℃(1σ), 达到了古海温重建的精度需求。
胡敏航 , 陈天然 , 张文静 . 滨珊瑚Sr/Ca的种间和种内差异性*[J]. 热带海洋学报, 2018 , 37(6) : 74 -84 . DOI: 10.11978/2018008
Strontium-to-calcium (Sr/Ca) ratio in Porites corals is widely used as sea surface temperature (SST) proxy in tropical oceans. However, growth-related kinetic/metabolic effects in Porites may influence skeletal Sr/Ca and ultimately affect the accuracy of SST reconstruction. Here, Sr/Ca ratios in multiple Porites from Weizhou Island were measured using an Inductively Coupled Plasma Optical Emission Spectrometry (ICP-OES), to estimate the inter-species and inter-colony differences of Sr/Ca and the Sr/Ca-SST calibration with instrumental SST records. The results are as follows. (1) In this study, two species of Porites corals, Porites pukoensis and Porites lutea, were collected. Significant differences of Sr/Ca and Sr/Ca-SST equation were found between the two species. We suggest using the same species in coral-based paleo-climate reconstructions. (2) Inter-colony Sr/Ca differences were found in Porites pukoensis and Porites lutea, resulting from extreme warm and cold temperatures, which disturbed coral physiologies and caused anomalously Sr/Ca ratios, as well as sampling errors, especially in warm and cold periods. (3) No significant differences of Sr/Ca were found in different axes in a Porites colony. We established a Sr/Ca-SST thermometer as Sr/Ca (mmol/mol) = -0.04027×SST(℃)+9.623 based on multi-colony calibrations. The multi-colony approach can minimize individual biases or noise referred to growth related “vital effects” or other kinetic/metabolic effects, and eventually increase the accuracy of SST reconstruction. The error of the Sr/Ca-derived SST was ±0.6℃(1σ).
Key words: Porites; Sr/Ca; inter-species offset; inter-conoly offset; growth rate; SST
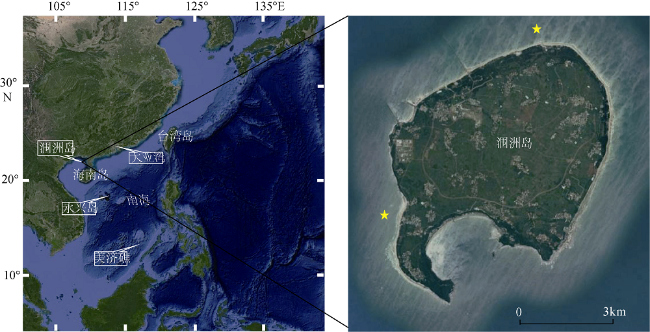
Fig. 1 Location of the sampling site from Google Earth Map图1 采样地点卫星照片(根据Google earth地图修改) |
Tab. 1 An overview of Porites corals collected from Weizhou Island表1 滨珊瑚样品的具体信息 |
| 样品编号 | 生长年龄区间(年份) | 年平均生长速率/(mm·a-1) | 取样间距/mm |
|---|---|---|---|
| WZ1-1 | 1997—2010 | 8.1 | 0.6 |
| WZ1-2 | 1998—2010 | 8.9 | 0.6 |
| WZ1-3 | 1997—2010 | 10.5 | 1 |
| WZ1-4 | 1997—2010 | 10.1 | 1 |
| WZ2 | 1976—2010 | 4.4 | 0.6 |
| WZ3 | 1983—2010 | 10.7 | 1 |
| WZ4 | 1988—2010 | 9.4 | 1 |
| WZ5 | 1985—2010 | 7.4 | 1 |
| WZ6 | 1997—2010 | 10.8 | 1 |
| WZ7 | 1979—2010 | 9.8 | 1 |
| WZ8 | 1981—2010 | 6.9 | 1 |
| WZ9 | 2005—2015 | 11.3 | 1 |
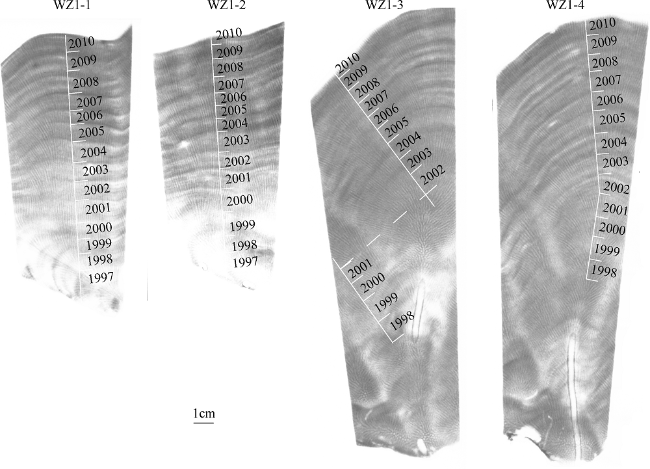
注: WZ1-1—WZ1-4均来自同一个珊瑚样品WZ1, 分别取自同一个珊瑚的不同生长轴 |
Fig. 2 X-radiographs of Porites WZ1. A pair of light and dark bands represents an annual growth. |
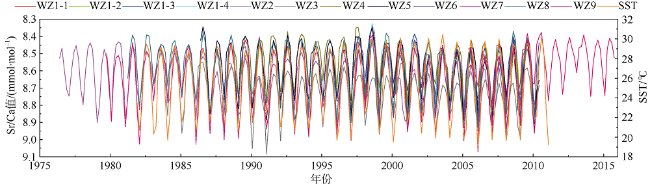
Fig. 3 Interpolated Porites Sr/Ca ratio and biomonthly SST time series图3 线性插值的珊瑚Sr/Ca比值和双月分辨率的SST时间序列 |
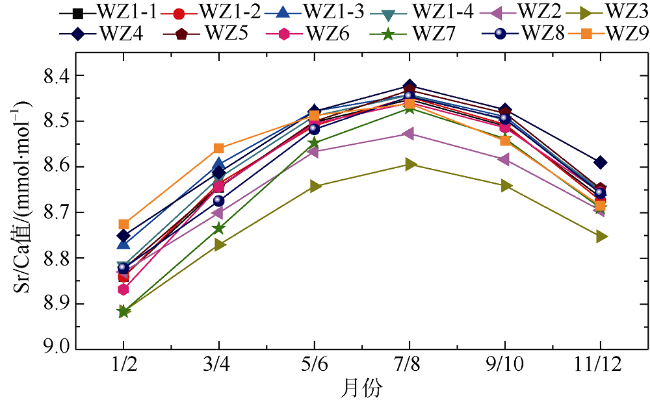
Tab. 2 Ranges of Sr/Ca, mean and mean biomonthly Sr/Ca ratio表2 Sr/Ca比值变化范围、平均值及双月平均值 |
| Sr/Ca值/(mmol·mol-1) | WZ1-1 | WZ1-2 | WZ1-3 | WZ1-4 | WZ2 | WZ3 | WZ4 | WZ5 | WZ6 | WZ7 | WZ8 | WZ9 |
|---|---|---|---|---|---|---|---|---|---|---|---|---|
| 最大值 | 8.95 | 8.89 | 8.91 | 8.94 | 8.99 | 9.08 | 8.91 | 8.96 | 8.95 | 9.07 | 8.95 | 8.80 |
| 最小值 | 8.33 | 8.35 | 8.38 | 8.32 | 8.41 | 8.45 | 8.35 | 8.34 | 8.39 | 8.40 | 8.37 | 8.38 |
| 平均值 | 8.60 | 8.60 | 8.57 | 8.59 | 8.64 | 8.72 | 8.56 | 8.59 | 8.61 | 8.65 | 8.60 | 8.55 |
| 1/2双月 | 8.84 | 8.84 | 8.77 | 8.82 | 8.83 | 8.92 | 8.75 | 8.82 | 8.87 | 8.92 | 8.82 | 8.73 |
| 3/4双月 | 8.65 | 8.64 | 8.59 | 8.62 | 8.70 | 8.77 | 8.61 | 8.64 | 8.64 | 8.74 | 8.68 | 8.56 |
| 5/6双月 | 8.50 | 8.51 | 8.48 | 8.49 | 8.57 | 8.64 | 8.48 | 8.50 | 8.51 | 8.55 | 8.52 | 8.49 |
| 7/8双月 | 8.45 | 8.45 | 8.44 | 8.44 | 8.53 | 8.59 | 8.42 | 8.43 | 8.46 | 8.47 | 8.45 | 8.46 |
| 9/10双月 | 8.51 | 8.51 | 8.49 | 8.50 | 8.58 | 8.64 | 8.48 | 8.48 | 8.51 | 8.54 | 8.50 | 8.54 |
| 11/12双月 | 8.67 | 8.67 | 8.65 | 8.65 | 8.70 | 8.75 | 8.59 | 8.65 | 8.66 | 8.69 | 8.66 | 8.69 |
Fig. 4 Mean bimonthly Sr/Ca ratio in each Porites sample图4 每个珊瑚样品的Sr/Ca双月平均值 |
Fig. 5 Comparison of two different species with microscope. |
Tab. 3 Porites Lutea Sr/Ca ratio significance test (P value)—Dunnett T3 method表3 澄黄滨珊瑚Sr/Ca比值显著性(P值)检验——Dunnett T3法 |
| 样品编号 | WZ1-1 | WZ1-2 | WZ1-3 | WZ1-4 | WZ4 | WZ5 | WZ6 | WZ7 | WZ8 |
|---|---|---|---|---|---|---|---|---|---|
| WZ1-1 | |||||||||
| WZ1-2 | 1.000 | ||||||||
| WZ1-3 | 1.000 | 1.000 | |||||||
| WZ1-4 | 1.000 | 1.000 | 1.000 | ||||||
| WZ-4 | 0.998 | 1.000 | 1.000 | 1.000 | |||||
| WZ-5 | 1.000 | 1.000 | 0.999 | 1.000 | 0.994 | ||||
| WZ-6 | 1.000 | 1.000 | 0.997 | 1.000 | 0.988 | 1.000 | |||
| WZ-7 | 0.420 | 0.237 | 0.012 | 0.098 | 0.007 | 0.561 | 0.606 | ||
| WZ-8 | 1.000 | 1.000 | 0.616 | 0.983 | 0.481 | 1.000 | 1.000 | 0.995 |
Tab. 4 Correlations between SST and Sr/Ca in summer and winter表4 夏冬两季SST值与Sr/Ca相关性 |
| WZ1-1 | WZ1-2 | WZ1-3 | WZ1-4 | WZ2 | WZ3 | WZ4 | WZ5 | WZ6 | WZ7 | WZ8 | WZ9 | |
|---|---|---|---|---|---|---|---|---|---|---|---|---|
| 夏季 | 0.003 | 0.063 | 0.183 | 0.017 | 0.170 | -0.175 | 0.198 | -0.244 | 0.310 | -0.190 | 0.168 | -0.483 |
| n | 13 | 12 | 13 | 13 | 13 | 13 | 13 | 13 | 13 | 13 | 13 | 5 |
| 冬季 | -0.239 | -0.159 | -0.164 | -0.201 | 0.569 | -0.408 | -0.191 | 0.543 | 0.247 | 0.124 | 0.213 | -0.589 |
| n | 13 | 12 | 13 | 13 | 14 | 14 | 14 | 14 | 13 | 14 | 14 | 5 |
Fig. 6 (a) Time series of Porites Lutea Sr/Ca and SST (1997-2010). (b) Time series of Porites pukoensis Sr/Ca and SST (1983-2010)图6 1997—2010年澄黄滨珊瑚(a)和1983—2010年普哥滨珊瑚(b)的Sr/Ca值及SST序列 |
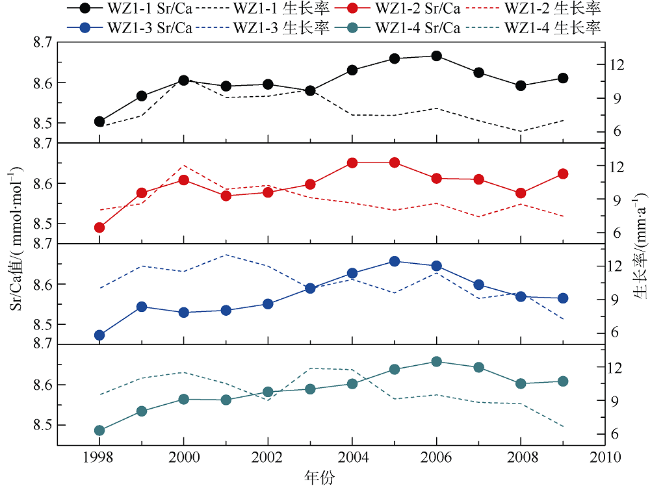
Fig. 7 Comparison between Sr/Ca ratios along different growth axes and growth rates图7 同一珊瑚个体不同生长轴的Sr/Ca和生长率比较 |
Tab. 5 Significance (P) and correlation between WZ1 sample’s growth rate and Sr/Ca表5 WZ1样品的生长率与Sr/Ca值的显著性及相关性 |
| 样品编号 | 显著性 | 相关性(P值) | n |
|---|---|---|---|
| WZ1-1 | 0.746 | 0.105 | 13 |
| WZ1-2 | 0.875 | -0.051 | 13 |
| WZ1-3 | 0.550 | -0.192 | 13 |
| WZ1-4 | 0.336 | -0.305 | 13 |
Fig. 8 (a) Calibration between mean Sr/Ca and instrumental SST. (b) RMA regression of mean Sr/Ca with instrumental SST (red curve represents the 95% confidence interval). (c) Comparison between Sr/Ca-derived SST and instrumental SST图8 滨珊瑚平均Sr/Ca比值与SST对比(a)和平均Sr/Ca—SST线性回归方程(红色曲线表示95%的置信区间)(b)以及后报的SST值与实测值比较(c) |
Tab. 6 Coral Sr/Ca thermometers in the South China Sea表6 南海各海区珊瑚Sr/Ca温度计 |
| 采样地点 | Sr/Ca温度计方程 | 相关系数r |
|---|---|---|
| 大亚湾(Chen et al, 2013a) | Sr/Ca = -0.048×SST+10.432 | -0.899 |
| 三亚(Wei et al, 2000) | Sr/Ca = -0.05043×SST+10.60 | -0.75 |
| 海南岛东部(刘羿 等, 2006) | Sr/Ca = -0.0625×SST+10.625 | -0.80 |
| 永兴岛(田翠翠, 2012) | Sr/Ca = -0.0449×SST+10.534 | -0.976 |
| 雷州半岛(Yu et al, 2005) | Sr/Ca = -0.0424×SST+9.836 | -0.83 |
| 美济礁(林紫云 等, 2016) | Sr/Ca = -0.0574×SST+10.527 | -0.9237 |
| 涠洲岛(本文) | Sr/Ca = -0.04027×SST+9.623 | -0.93 |
| 太平洋平均(Corrège, 2006) | Sr/Ca = -0.0607×SST+10.553 |
The authors have declared that no competing interests exist.
| [1] |
|
| [2] |
|
| [3] |
|
| [4] |
|
| [5] |
|
| [6] |
|
| [7] |
|
| [8] |
|
| [9] |
|
| [10] |
|
| [11] |
|
| [12] |
|
| [13] |
|
| [14] |
|
| [15] |
|
| [16] |
|
| [17] |
|
| [18] |
|
| [19] |
|
| [20] |
|
| [21] |
|
| [22] |
|
| [23] |
|
| [24] |
|
| [25] |
|
| [26] |
|
| [27] |
|
| [28] |
|
| [29] |
|
| [30] |
|
| [31] |
|
| [32] |
|
| [33] |
|
| [34] |
|
| [35] |
|
| [36] |
|
| [37] |
|
| [38] |
|
/
| 〈 |
|
〉 |


