
非线性流函数在实验风浪场计算中的应用
作者简介:蒋昌波(1970—), 男, 陕西省石泉县人, 教授, 博士。主要从事河流、海岸动力过程及其模拟技术研究。E-mail: jcb36@163.com
收稿日期: 2018-04-11
要求修回日期: 2018-06-22
网络出版日期: 2019-01-16
基金资助
国家自然科学基金项目(51239001)
An application of nonlinear stream function in analysis of experimental wind-wave field
Received date: 2018-04-11
Request revised date: 2018-06-22
Online published: 2019-01-16
Supported by
National Natural Science Foundation of China (51239001)
Copyright
风作用于水面产生风浪, 其中由于波流紊动产生的动量和能量的交换机制是一个很复杂的过程。风应力一般用来描述这种能量交换, 可以分为3个部分: 水面的剪切力、波生应力以及紊动应力。采用一种有效的非线性波流分离方法——NSFM(Nonlinear Stream Function Method)对波流运动的动量和能量输移进行定性描述。构造能够有效表达非线性波浪的解析流函数, 摄动求解使其满足拉普拉斯方程、动力边界条件和运动边界条件, 结合实验室风浪数据, 分离出波生速度场。通过交叉谱分析, 得到波生雷诺应力在不同风速下对风应力的贡献。结果表明: NSFM对不同工况条件下的风浪的处理具有较高的精度, 模型适应性良好; 且风速越大, 波生应力沿着水深衰减得越快, 且自由面波生应力在动量输移中的比重会逐渐减弱。
蒋昌波 , 杨扬 , 汤寒松 . 非线性流函数在实验风浪场计算中的应用[J]. 热带海洋学报, 2019 , 38(1) : 19 -26 . DOI: 10.11978/2018039
The wind on the water surface can create wind waves. The exchange mechanism of momentum and energy due to the turbulence of wave current is a complicated process. Wind stress is generally used to describe this energy exchange, and can be divided into three components: shear stress, wave induced stress and turbulent stress. An effective nonlinear wave current separation method, namely, the Nonlinear Stream Function Method (NSFM), is used to qualitatively describe the momentum and energy transports between wave and current. An analytical stream function is constructed, which can effectively express nonlinear waves and satisfies the Laplace equation, the boundary condition and the kinematic boundary condition of the water surface, separating the wave-induced velocity field based on the laboratory wind-wave data. Through the cross-spectral technique, the contribution of wave-induced Reynolds stress to wind stress at different wind speed is obtained. The results are as follows. NSFM has higher accuracy and better applicability in treating wind waves under different working conditions. With the increase of wind speed, wave-induced stress decays faster along water depth, and the ratio of wave-induced stress at the free surface to the momentum transport mechanism should be gradually weakened.
Key words: wind wave; wave-current separation; stream function
Tab. 1 Description of experimental data表1 实验数据统计描述 |
| 序号 | P/Hz | U∞/(m·s-1) | U*/(m·s-1) | H1/3/cm | Hrms/cm | Have/cm | T/s | Tf/s | N | Ac-rms/cm | At-rms/cm |
|---|---|---|---|---|---|---|---|---|---|---|---|
| 1 | 10 | 3.4 | 0.134 | 0.83 | 0.65 | 0.62 | 0.26 | 1.5 | 17 | 0.41 | 0.26 |
| 2 | 15 | 6.1 | 0.363 | 1.80 | 1.42 | 1.32 | 0.30 | 1.5 | 17 | 0.78 | 0.55 |
| 3 | 20 | 7.8 | 0.506 | 2.33 | 1.73 | 1.61 | 0.36 | 1.5 | 17 | 0.94 | 0.81 |
| 4 | 25 | 10.1 | 0.762 | 3.66 | 2.69 | 2.47 | 0.43 | 2 | 23 | 1.55 | 1.16 |
| 5 | 30 | 12.2 | 0.940 | 4.04 | 3.04 | 2.83 | 0.47 | 2 | 23 | 1.89 | 1.78 |
| 6 | 35 | 14.6 | 1.239 | 6.47 | 4.95 | 4.68 | 0.54 | 3 | 35 | 2.74 | 2.56 |
注: P—风机功率; U∞—远场风速; U*—摩阻风速; H1/3—有效波高; Hrms—均方波高; Have—平均波高; Ac-rms—均方波峰; At-rms—均方波谷; Tf—样本数据时间长度。 |
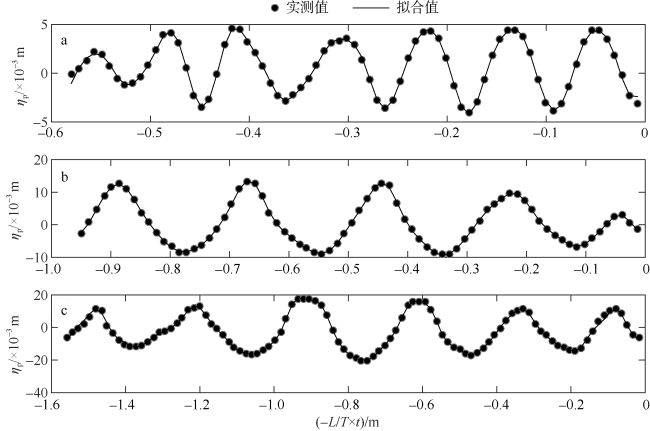
Fig. 1 Sample of free surface elevation: a) 10 Hz, b) 20 Hz and c) 30 Hz图1 自由面高程样本片段a. 10Hz; b. 20Hz; c. 30Hz |
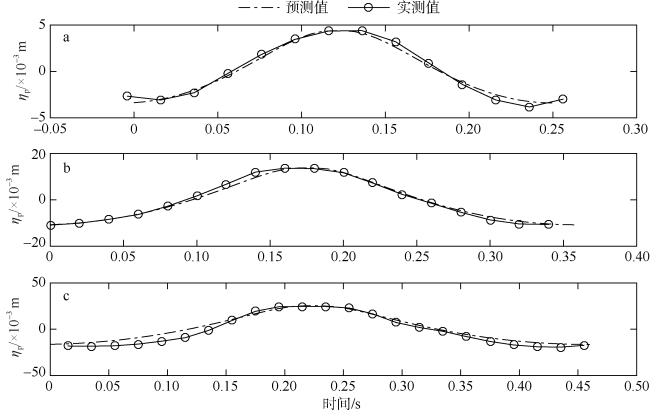
Fig. 2 Comparison of predicted waveforms by NSFM method with experimental data: a) 10 Hz, b) 20 Hz and c) 30 Hz图2 NSFM方法预测的波形与实验数据的比对a. 10Hz; b. 20Hz; c. 30Hz |
Tab. 2 Boundary condition error表2 边界条件误差 |
| 动力边界条件 | 运动边界条件 | |
|---|---|---|
| 全局误差 | \({{E}_{1}}=\frac{1}{k}\sum\limits_{n=1}{k}{{{({{Q}_{\text{k}}}-\overset{\_}{\mathop{Q}}\,)}{2}}}\) | \({{E}_{2}}=\frac{1}{k}\sum\limits_{n=1}{k}{{{({{\eta }_{\text{pk}}}-{{\eta }_{\text{mk}}})}{\text{2}}}}\) |
| 局部误差 | \({{\delta }_{\text{1}}}\text{=}{{Q}_{\text{k}}}-\bar{Q}\) | \({{\delta }_{\text{2}}}={{\eta }_{\text{pk}}}-{{\eta }_{\text{mk}}}\) |
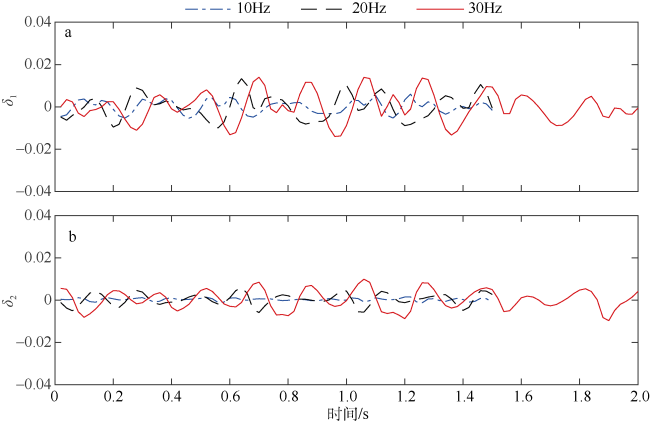
Fig. 3 Local errors of dynamic (a) and kinematic (b) boundary conditions图3 动力边界条件(a)和运动边界条件(b)的局部误差 |
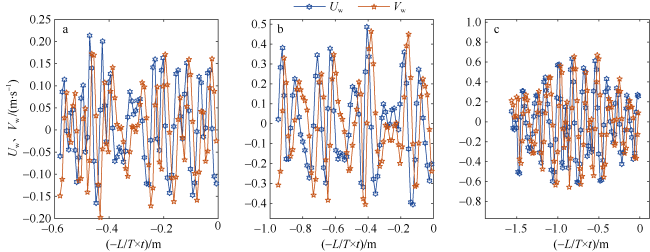
Fig. 4 Wave-induced velocity field: a) 10 Hz, b) 20 Hz and c) 30 Hz图4 波生速度场a) 10Hz; b) 20Hz; c) 30Hz |
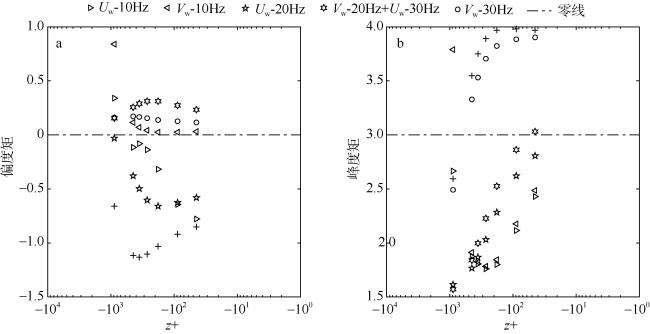
Fig. 5 Moment statistics of wave-induced velocity: a) skewness moment and b) kurtosis moment图5 波生速度的矩统计a. 偏度矩; b. 峰度矩 |
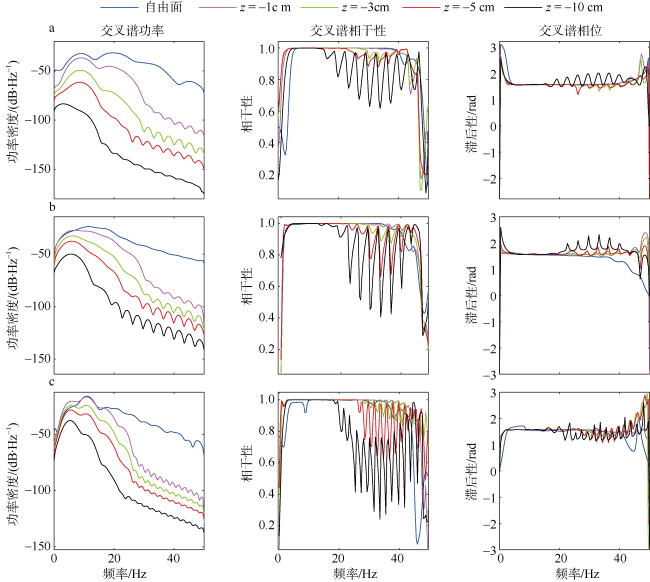
Fig. 6 Cross spectral analysis. a) 10 Hz, b) 20 Hz and c) 30 Hz图6 交叉谱分析a. 10Hz; b. 20Hz; c. 30Hz |
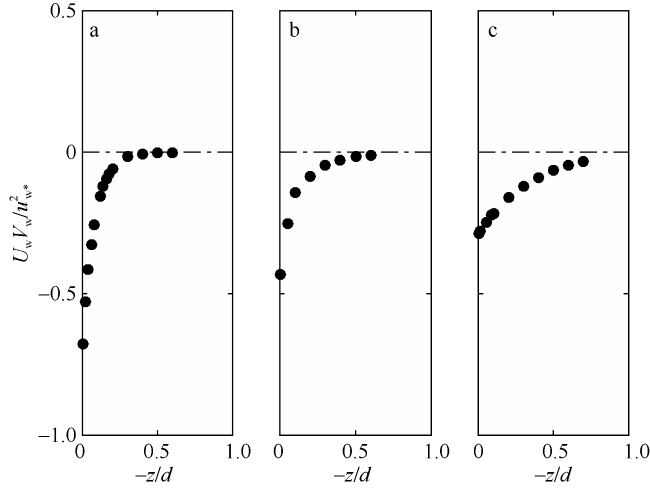
Fig. 7 Variation of \({{U}_{\text{w}}}{{V}_{\text{w}}}\text{/}u_{\text{w}*}{2}\) with water depth: a) 10 Hz, b) 20 Hz and c) 30 Hz图7 \({{U}_{\text{w}}}{{V}_{\text{w}}}\text{/}u_{\text{w}*}{2}\)随水深的变化a. 10Hz; b. 20Hz; c. 30Hz |
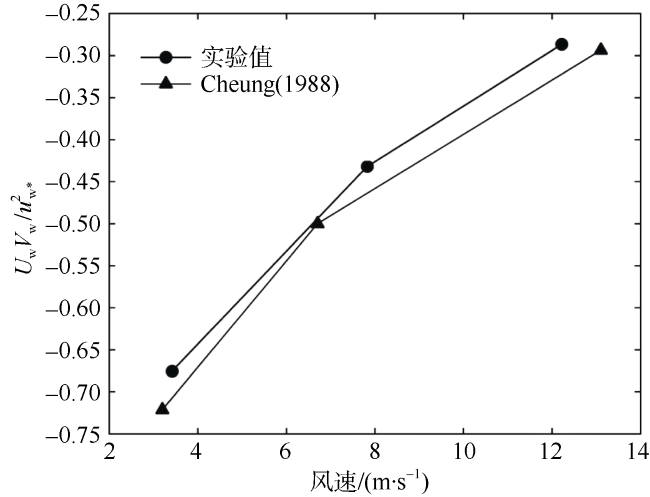
Fig. 8 Variation of \({{U}_{\text{w}}}{{V}_{\text{w}}}\text{/}u_{\text{w}*}{2}\) with wind speed at air-water interface图8 \({{U}_{\text{w}}}{{V}_{\text{w}}}\text{/}u_{\text{w}*}{2}\)在自由面附近与风速的关系 |
The authors have declared that no competing interests exist.
| [1] |
|
| [2] |
|
| [3] |
|
| [4] |
|
| [5] |
|
| [6] |
|
| [7] |
|
| [8] |
|
| [9] |
|
| [10] |
|
| [11] |
|
| [12] |
|
| [13] |
|
/
| 〈 |
|
〉 |
