
基于遥感反演的珠江河口表层悬沙浓度分位数趋势分析 *
|
詹伟康(1991—), 男, 广东省潮州市人, 博士研究生, 主要从事河口悬沙遥感研究。E-mail:zhanweikang13@mails.ucas.ac.cn |
Copy editor: 林强
收稿日期: 2018-10-09
要求修回日期: 2018-11-06
网络出版日期: 2019-06-17
基金资助
广州市科技项目(201607020042)
热带海洋环境国家重点实验室自主研究项目(LTOZZ1503)
版权
Quantile trend analysis for suspended sediment concentration in the Pearl River Estuary based on remote sensing
Copy editor: LIN Qiang
Received date: 2018-10-09
Request revised date: 2018-11-06
Online published: 2019-06-17
Supported by
Science and Technology Program of Guangzhou, China(201607020042)
Self-research Program of the State Key Laboratory of Tropical Oceanography(LTOZZ1503)
Copyright
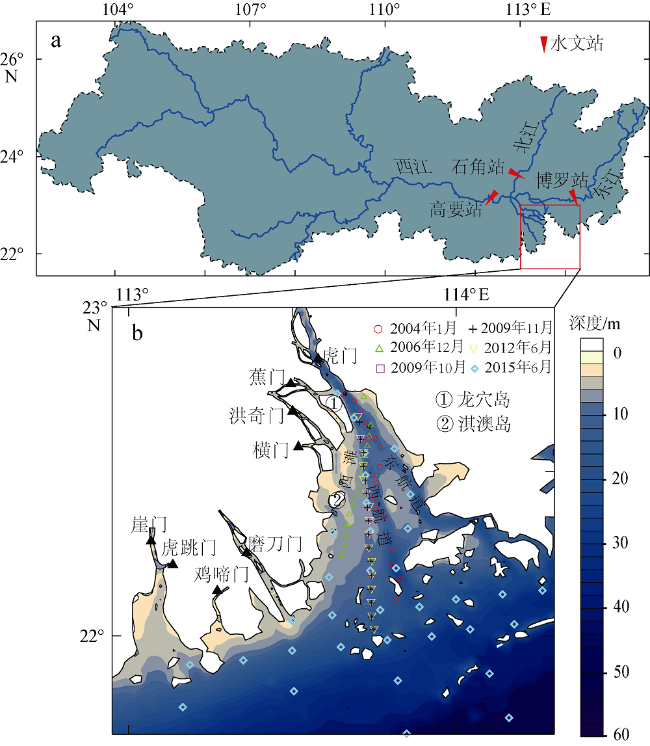
利用中分辨率成像光谱仪(moderate resolution imaging spectroradiometer, MODIS)一级产品并结合航次数据, 反演2003—2015年间珠江河口表层悬浮泥沙浓度(suspended sediment concentration, SSC), 分析其分位数长期变化趋势并探讨其影响因素。结果表明, 珠江河口SSC呈总体下降趋势, 平均下降速率约为1.03mg·L -1·yr -1。口门外以及河口东北部区域平均SSC下降更快, 最高可达约4.0mg·L -1·yr -1。总体上, 珠江河口SSC高值下降速率大于低值, 且存在空间差异性。低值下降趋势显著地区主要分布在淇澳岛北部的口门外区域, 其SSC大小值之间的差异逐年增加; 而高值下降速率快的地区主要分布在虎门口、龙穴岛东南岸以及东航道附近水域, SSC每年大小值差异呈减小趋势。珠江河口SSC分位数趋势受径流输沙量、河口地形变化以及风的影响。由水库修建所致的上游输沙量减少导致淇澳岛北部口门外区域SSC的低值部分显著下降。虎门口、龙穴岛东南岸以及东航道附近水域的加深使得这些区域SSC高值部分下降显著, 而西滩区域的变浅使得冬季潮汐混合减弱, 导致SSC高值部分下降趋势显著。此外, 由风速下降引起的表层风混合减弱也是导致西滩南部SSC高值下降趋势显著的原因之一。
詹伟康 , 吴颉 , 韦惺 , 唐世林 , 詹海刚 . 基于遥感反演的珠江河口表层悬沙浓度分位数趋势分析 *[J]. 热带海洋学报, 2019 , 38(3) : 32 -42 . DOI: 10.11978/2018101
Suspended sediment concentration (SSC) in the Pearl River Estuary (PRE) during 2003-2015 was studied based on Moderate Resolution Imaging Spectroradiometer (MODIS) Level-1B product and in-situ measurements. The data were further used to analyze quantile trends and corresponding influence factors. The results showed that the SSC in the PRE displayed a decreasing trend, with an averaged SSC reduction rate of about1.03 mg·L -1·yr -1. The SSC in the regions near the river outlets and northeast part of the estuary suffered from much stronger decreases, which could be up to 4.0 mg·L -1·yr -1 during 2003-2015. Decreasing rate in high SSC were generally larger than those in low SSC, with a marked spatial difference. Low percentile of the SSC suffered from a stronger decline in the regions north of Qiao Island, with an increase in the variance of the distribution, while remarkable trends of high percentile of SSC occurred in the Humen outlet, northeastern coast of Longxue Island and regions near the East Channel, with corresponding decreases in the variance of the distribution. The quantile trends in the PRE were influenced by many factors. The seasonal variation of dam-induced reduction of the sediment load into the PRE contributed to most of the low-percentile SSC decreases north of Qiao Island. The subaqueous topographic change in the PRE induced by human activities dominated the high-percentile SSC trends in the Humen outlet, northeastern coast of Longxue Island, southern West Shoal, and regions near the East Channel. The decrease of the wind speed over the PRE also affected the high-percentile SSC trend in the southern West Shoal by weakening wind mixing in the boundary layer.
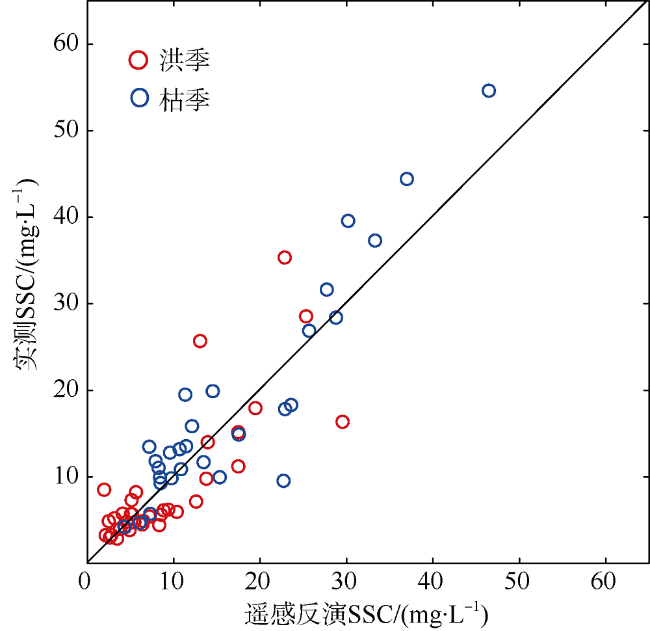
图2 遥感反演与实测SSC验证黑色实线表示1:1关系 Fig. 2 Scatter plot of satellite-derived SSC vs. measured SSC from the samples collected during oceanographic cruises. The solid line shows the 1:1 relationship |
表1 SSC算法统计分析Tab. 1 Statistical evaluation of the SSC algorithm |
| 数据 组数 | 斜率 | 截距 | 相关系数 | 均方根误差/(mg·L-1) | |
|---|---|---|---|---|---|
| 全年 | 64 | 1.04 | -0.004 | 0.90 | 4.75 |
| 洪季 | 35 | 0.87 | 0.97 | 0.81 | 4.58 |
| 枯季 | 29 | 1.04 | -0.03 | 0.92 | 4.95 |
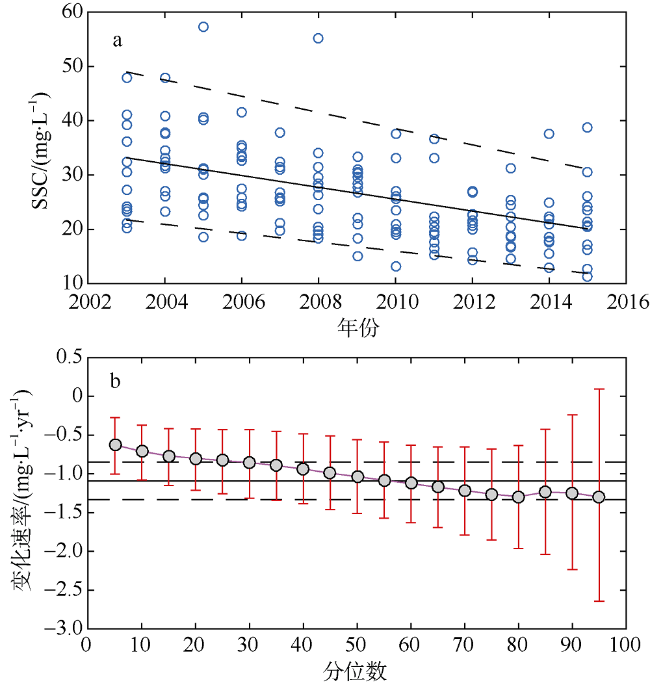
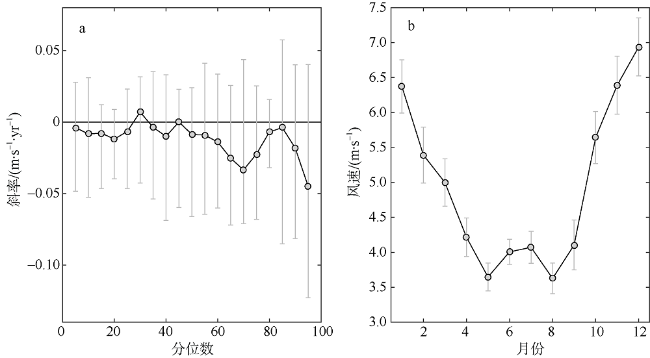
图4 分位数回归趋势(a)以及分位数变化速率(b)a中圆圈代表珠江河口SSC月平均值, 黑色实线表示珠江河口SSC平均值线性回归结果, 虚线表示5th和95th百分位数回归结果。b中误差棒对应变化速率的95%置信区间, 黑色实线表示平均值变化速率, 黑色虚线表示其95%置信区间 Fig. 4 Quantile regression trends (a) and quantile slopes (b) for monthly-mean SSC. The blue circles in (a) show the monthly-mean SSC averaged in the Pearl River Estuary. The thick black line is the trend of the mean SSC, and the dash-dotted black lines are the trends in the 5th and 95th percentiles, respectively. The vertical error bars in (b) indicate the corresponding 95% confidence interval, and the black solid line shows the mean SSC slope, with the corresponding 95% confidence interval (dashed line) |
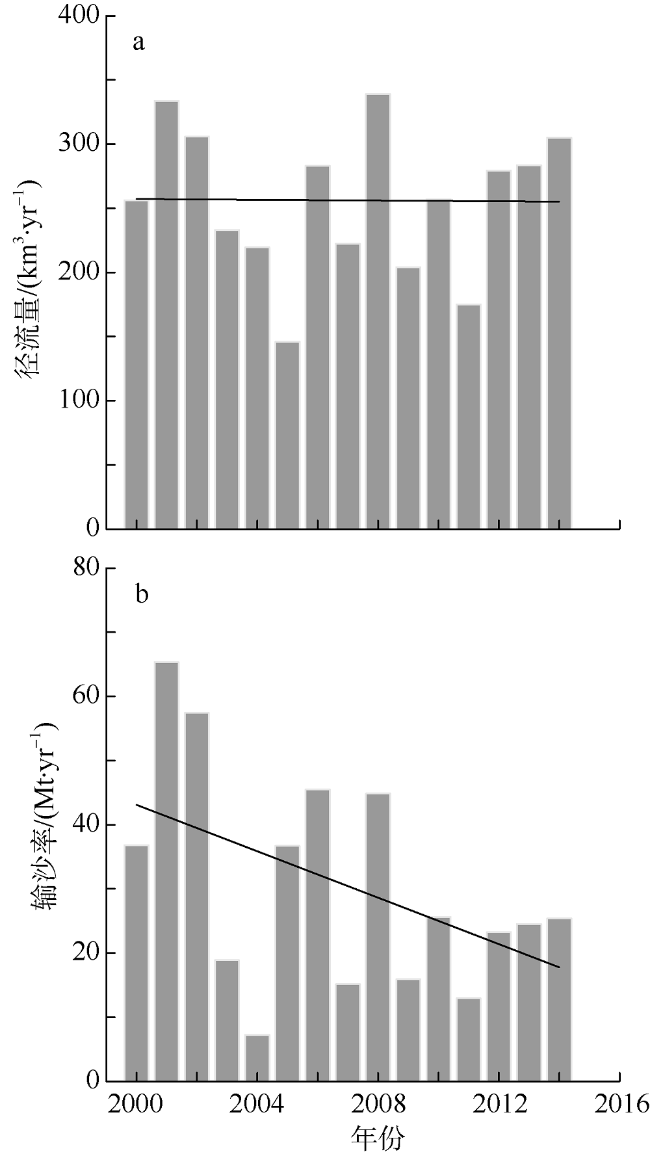
图7 2000—2014年珠江(高要站、石角站和博罗站)径流及输沙量趋势Fig. 7 Trends (2000-2014) of water discharge and sediment load in the Pearl River |
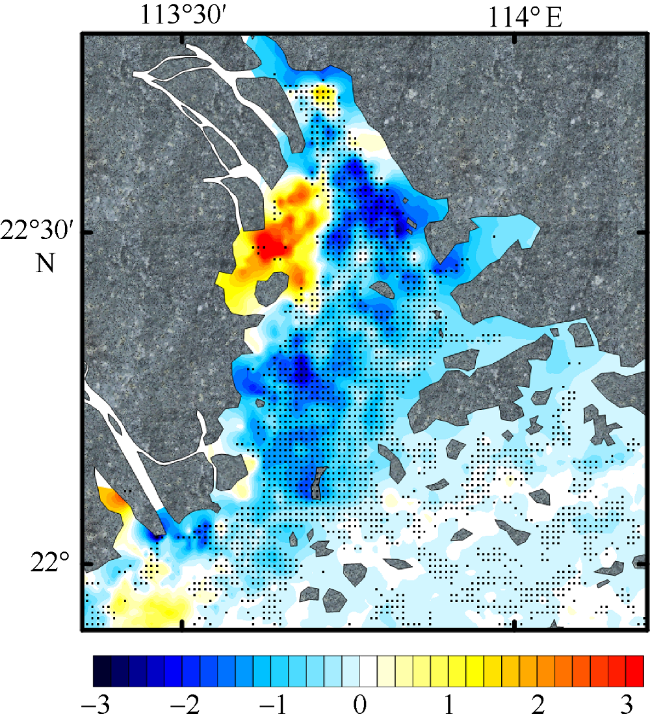
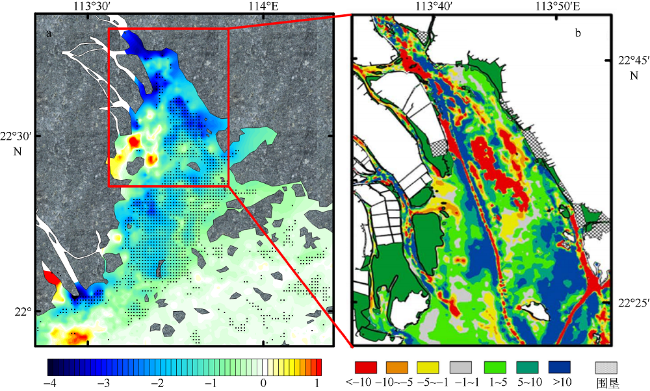
图9 2003—2015年珠江河口SSC的95th百分位数变化(单位: mg·L-1·yr-1)趋势(a)和2000—2010年水深变化(单位: cm·yr-1)分布(b)a中黑点表示区域SSC具有显著上升或下降趋势;b引自Wu 等(2016) Fig. 9 Trend (units: mg·L-1·yr-1) (2003-2015) in 95th percentile for the SSC (a) and subaqueous topographic change (2000-2010) in the Pearl River Estuary. Stippling indicates areas where there are significant increasing or decreasing trends |
The authors have declared that no competing interests exist.
作者已声明无竞争性利益关系。
| [1] |
何为 , 2001. 珠江口泥沙特点与控制因素[J]. 中山大学研究生学刊(自然科学), 22(1):84-89.
|
| [2] |
季荣耀, 陆永军, 王志力 , 等, 2015. 河口治理开发对伶仃洋滩槽演变影响分析[C]// 第十七届中国海洋(岸)工程学术讨论会论文集. 北京: 海洋出版社: 987-990.
|
| [3] |
刘大召, 陈楚群, 刘汾汾 , 等, 2009. 利用混合光谱分解估测珠江口悬浮泥沙浓度[J]. 热带海洋学报, 28(5):43-48.
|
| [4] |
刘汾汾, 陈楚群, 唐世林 , 等, 2009. 基于现场光谱数据的珠江口MERIS悬浮泥沙分段算法[J]. 热带海洋学报, 28(1):9-14.
|
| [5] |
栾虹, 付东洋, 李明杰 , 等, 2017. 基于Landsat 8珠江口悬浮泥沙四季遥感反演与分析[J]. 海洋环境科学, 36(6):892-897.
|
| [6] |
倪培桐, 吴超羽, 陈卓英 , 2000. 应用数值模拟方法探讨河口最大浑浊带若干机理[J]. 热带海洋学报, 19(2):27-32.
|
| [7] |
倪培桐, 闻平, 刘剑宇 , 2016. 珠江三角洲水沙年际变化趋势分析[J]. 人民珠江, 37(1):19-24.
|
| [8] |
唐兆民, 何志刚, 任杰 , 等, 2005. 珠江口虎门悬浮泥沙浓度的测量[J]. 中山大学学报(自然科学版), 44(4):124-128.
|
| [9] |
田向平 , 1986. 珠江河口伶仃洋最大混浊带研究[J]. 热带海洋, 5(2):27-35.
|
| [10] |
吴创收, 杨世伦, 黄世昌 , 等, 2014. 1954-2011年间珠江入海水沙通量变化的多尺度分析[J]. 地理学报, 69(3):422-432.
|
| [11] |
禹定峰, 邢前国, 陈楚群 , 等, 2010. 利用导数光谱估算珠江河口水体悬浮泥沙浓度[J]. 生态科学, 29(6):563-567.
|
| [12] |
朱樊, 欧素英, 张铄涵 , 等, 2015. 基于MODIS影像的珠江口表层悬沙浓度反演及时空变化分析[J]. 泥沙研究, ( 2):67-73.
|
| [13] |
|
| [14] |
|
| [15] |
|
| [16] |
|
| [17] |
|
| [18] |
|
| [19] |
|
| [20] |
|
| [21] |
|
| [22] |
|
| [23] |
|
| [24] |
|
| [25] |
|
| [26] |
|
| [27] |
|
| [28] |
|
| [29] |
|
| [30] |
|
| [31] |
|
| [32] |
|
| [33] |
|
| [34] |
|
| [35] |
|
| [36] |
|
| [37] |
|
| [38] |
|
| [39] |
|
| [40] |
|
| [41] |
|
| [42] |
|
| [43] |
|
| [44] |
|
| [45] |
|
| [46] |
|
| [47] |
|
| [48] |
|
| [49] |
|
/
| 〈 |
|
〉 |


