
2015/2016年超强厄尔尼诺事件基本特征及生成和消亡机制
|
郑依玲(1995—), 女, 广东省汕头市人, 硕士研究生, 主要从事海气相互作用研究。E-mail: |
Copy editor: 孙淑杰
收稿日期: 2018-11-05
要求修回日期: 2019-01-04
网络出版日期: 2019-07-21
基金资助
中国科学院战略性先导科技专项((XDA19060501);)
国家自然科学基金项目((41525019、41506019、41805057、41830538);)
国家海洋局专项(GASI-IPOV AI-02)((GASI-IPOV AI-02).)
版权
Features of 2015/2016 extreme El Niño event and its evolution mechanisms
Copy editor: SUN Shu-jie
Received date: 2018-11-05
Request revised date: 2019-01-04
Online published: 2019-07-21
Supported by
This work is supported by the Chinese Academy of Sciences((XDA19060501);)
and the National Natural Science Foundation of China(41525019、41506019、41805057、41830538);)
the State Oceanic Administration of China((GASI-IPOV AI-02).)
Copyright
全球变暖背景下, 2015/2016年超强厄尔尼诺(El Niño)事件倍受关注, 此次事件是中部型和东部型El Niño的混合。研究发现, 西风爆发和北太平洋经向模态对触发此次事件均有所贡献。通过对比2015/2016年、1997/1998年与中部型事件可知, 2015/2016年事件在暖背景中产生, 其发展形态与中部型事件较为相似, 后期海表面温度异常迅速衰退主要与赤道东太平洋海域持续的东风异常以及纬向平流较弱有关。较之1997/1998年事件, 2015/2016年事件的海洋动力调整较弱, 表现为较弱的温跃层反馈和海洋波动, 纬向平流反馈的贡献大于温跃层反馈, 大气强迫影响显著, 中部海域相关要素异常值较大。在2015/2016年事件期间, 赤道海域以及近赤道海域海洋上层热含量的变化基本呈负相关, 且变化较为同步; 衰退阶段热含量的流失主要集中在5°S—5°N海域, 向两极的热输送明显。
关键词: El Niño事件;; 西风爆发; 北太平洋经向模态; 温跃层; 机制
郑依玲 , 陈泽生 , 王海 , 杜岩 . 2015/2016年超强厄尔尼诺事件基本特征及生成和消亡机制[J]. 热带海洋学报, 2019 , 38(4) : 10 -19 . DOI: 10.11978/2018114
In the context of global warming, the 2015/2016 extreme El Niño event received much attention. This event was a mixture of central Pacific (CP) and eastern Pacific El Niño. Our study shows that both the westerly wind bursts and the North Pacific Meridional Mode contributed to the generation of this event. By comparing the 1997/1998 event, the 2015/2016 event and the CP event, the 2015/2016 event occurred in the warm background and shared similar development pattern with the CP event. What’s more, the rapid decline of sea surface temperature anomaly in the 2015/2016 event was related to the continued easterly anomalies and the weakened zonal current advection in the eastern equatorial Pacific. Compared with the 1997/1998 event, the ocean dynamic adjustment of the 2015/2016 event was weak, which was mainly reflected by weaker thermocline feedback and its associated fluctuations near the equator. Moreover, the zonal advection feedback was more efficient than the thermocline feedback, and the atmospheric forcing and its anomalous values in the central equatorial Pacific were larger. In addition, during the 2015/2016 event, the changes of the upper-ocean heat content in the equatorial region and the near- equatorial region were basically negatively correlated, and the changes were relatively synchronous. In the decay phase, the loss of ocean heat content mainly occurred in the 5°S-5°N region with significant heat transport to the higher latitudes.
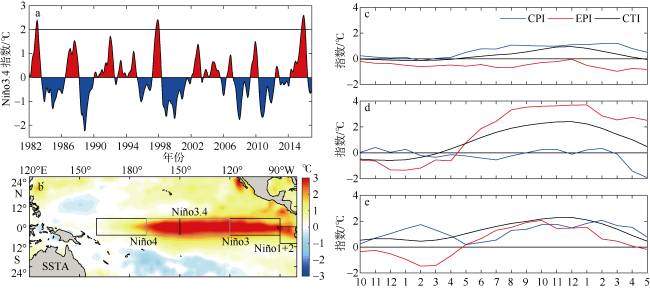
图1 El Niño指数及空间分布a. Niño3.4指数分布图; b. 2015/2016年事件冬季(11月至次年1月)赤道太平洋海域SSTA分布图; c、d、e分别为中部型事件、1997/1998年事件以及2015/2016年事件的CTI、EPI和CPI Fig. 1 Index of El Niño event and its spatial structure. a) Distribution of Niño3.4 index. b) Distribution of SSTA in winter (NDJ) of the 2015/2016 event. c) The CTI, EPI and CPI in the CP event. d) The CTI, EPI and CPI in the 1997/1998 event. e) The CTI, EPI and CPI in the 2015/2016 event |
图2 2015/2016年El Niño事件的前期状态a. 2015/2016年事件的NPO指数和PMM指数; b. c. d. 赤道太平洋附近海域SSTA和风场异常的分布情况, 依次为2014-11与2014-12、2015-01与2015-02、2015-03与2015-04的时间平均 Fig. 2 The pre-condition of the 2015/2016 El Niño event. a) NPO index and PMM index in the 2015/2016 event. b, c, d) Distributions of SSTA and wind anomalies in the equatorial Pacific Ocean averaged over Nov and Dec 2014, over Jan and Feb 2015, and over Mar and Apr 2015, respectively |
图3 SSTA和海表面纬向流异常的时间-经度演变a、b、c分别为中部型、1997/1998年、2015/2016年El Niño事件赤道海域SSTA的时间-经度图, 取南北纬2°平均, 等值线间距为0.5℃, 时间间隔为一周。d、e、f分别为中部型、1997/1998年、2015/2016年El Niño事件赤道海域海表面纬向流异常的时间-经度图, 取南北纬2°平均, 中部型事件等值线间距为0.2m·s-1, 超强事件等值线间距为0.5m·s-1, 时间间隔为一周 Fig. 3 Time-longitude sections of SSTA and surface zonal current anomalies. a, b, c) Time-longitude cross sections of SSTA averaged over 2°S-2°N for the CP, 1997/1998 and 2015/2016 events, respectively. The contour interval is 0.5°C. The time interval is one week. d, e, f) Time-longitude cross sections of surface zonal current anomalies averaged over 2°S-2°N for the CP, 1997/1998 and 2015/2016 events, respectively. The contour interval is 0.2 m·s-1. The time interval is one week |
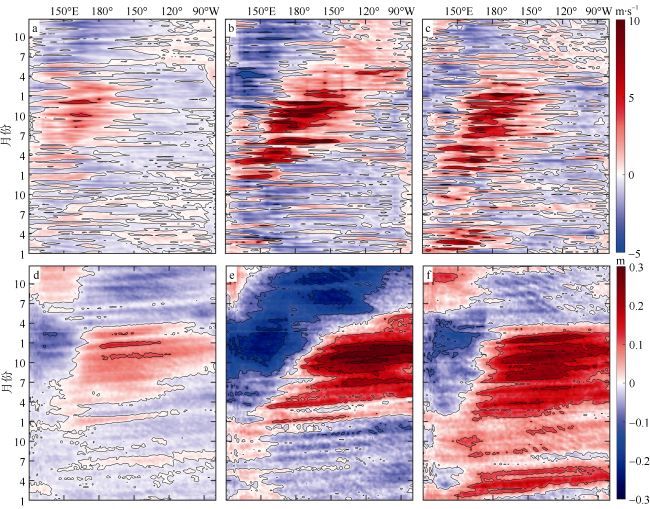
图4 海表面纬向风异常和SSHA的时间-经度演变a、b、c分别为中部型、1997/1998年、2015/2016年El Niño事件赤道海域海表面纬向风异常的时间-经度图, 取南北纬2°平均, 等值线间距为4m·s-1, 时间间隔为一周。d、e、f分别为中部型、1997/1998年、2015/2016年El Niño事件赤道海域SSHA的时间-经度图, 取南北纬2°平均, 等值线间距为0.1m, 时间间隔为一周 Fig. 4 Time-longitude sections of surface zonal wind anomalies and SSHA. a, b, c) Time-longitude cross sections of surface zonal wind anomalies averaged over 2°S-2°N for the CP, 1997/1998 and 2015/2016 events, respectively. The contour interval is 4 m·s-1. The time interval is one week. d, e, f) Time-longitude cross sections of SSHA averaged over 2°S-2°N for the CP event, 1997/1998 event and 2015/2016 event, respectively. The contour interval is 0.1 m. The time interval is one week |
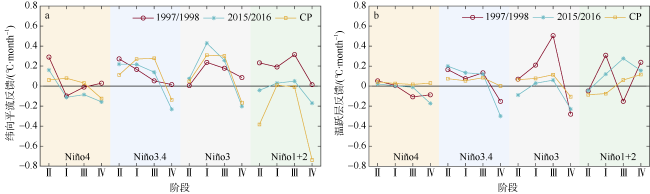
图5 中部型事件、1997/1998年事件、2015/2016年事件的纬向平流反馈贡献和温跃层反馈贡献a. $-u'{{\bar{T}}_{x}}$在Ⅰ—Ⅳ这4个阶段的变化情况。b. $-\bar{w}T_{z}^{'}$在Ⅰ—Ⅳ这4个阶段的变化情况。不同颜色的背景代表不同的区域, 从左到右分别为Niño4区、Niño3.4区、Niño3区以及Niño1+2区。Ⅰ阶段为2015-02—2015-05的平均, Ⅱ阶段为2015-06—2015-09的平均, Ⅲ阶段为2015-10—2016-01的平均, Ⅳ阶段为2016-02—2016-05的平均。海洋上混合层深度取50m Fig. 5 Contributions of zonal advection feedback and thermocline feedback for the CP, 1997/1998 and 2015/2016 events, respectively. a) The changes of$-u'{{\bar{T}}_{x}}$ in four phases. b) The changes of$-\bar{w}T_{z}^{'}$ in four phases. The backgrounds of different colors represent different regions; they are Niño4 zone, Niño3.4 zone, Niño3 zone, and Niño1+2 zone, respectively. Phase I is the average of Feb and May 2015. Phase II is the average of Jun and Sep 2015. Phase III is the average of Oct 2015 and Jan 2016. Phase IV is the average of Feb and May 2016. The mixed layer depth is 50 m |
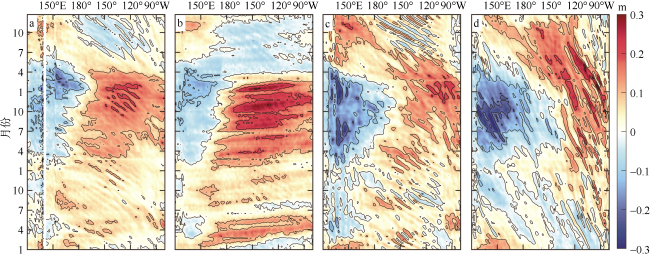
图6 2014-2016年期间赤道太平洋附近海域SSHA的时间-经度图a、b、c、d分别为5°S、0°(EQ)、5°N和10°N太平洋海域SSHA的时间-经度图, 等值线间距为0.1m, 时间间隔为一周 Fig. 6 Time-longitude sections of SSHA in the Pacific Ocean during 2015-2016. a, b, c, d) The time-longitude cross sections of SSHA for 5°S, 0°(EQ), 5°N, and 10°N, respectively. The contour interval is 0.1 m. The time interval is one week |
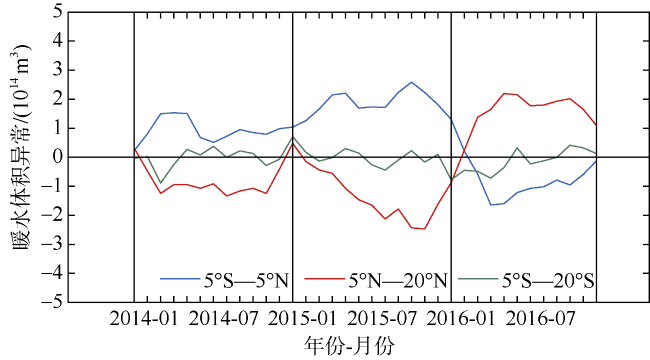
图7 2014—2016赤道太平洋附近海域暖水体积异常的变化情况蓝线代 Fig. 7 The changes of warm water volume anomalies in the equatorial Pacific Ocean during 2014-2016. The blue line represents the warm water volume anomalies averaged over 5°S-5°N and 120°E-80°W, the red line represents the warm water volume anomalies averaged over 5°N-20°N and 120°E-80°W, the green line represents the warm water volume anomalies averaged over 5°S-20°S and 120°E-80°W. Calculation formula for warm water volume anomalies is $\iint{\frac{1}{\Delta \rho '\rho }\Delta h\Delta x\Delta y}$, where $\Delta h$ is SSHA, and$\Delta \rho '\rho =0.005$ |
| [1] |
李崇银, 穆穆, 周广庆 , 等. 2008. ENSO机理及其预测研究[J]. 大气科学, 32(4):761-781.
|
| [2] |
刘秦玉, 王启 . 1995. “暖池”表层对大气局地强迫的响应特征[J]. 海洋与湖沼, 26(6):658-664.
|
| [3] |
骆高远 . 2000. 我国对厄尔尼诺、拉尼娜研究综述[J]. 地理科学, 20(3):264-269.
|
| [4] |
蒲书箴, 于非, 赵新 , 等. 1998. 1997/1998厄尔尼诺的发生与发展[J]. 海洋学报, 20(6):124-131.
|
| [5] |
任宏利, 王润, 翟盘茂 , 等. 2017. 超强厄尔尼诺事件海洋学特征分析与预测回顾[J]. 气象学报, 75(1):1-18.
|
| [6] |
袁媛, 高辉, 贾小龙 , 等. 2016. 2014-2016年超强厄尔尼诺事件的气候影响[J]. 气象, 42(5):532-539.
|
| [7] |
|
| [8] |
ATLAS, R,
|
| [9] |
|
| [10] |
|
| [11] |
|
| [12] |
|
| [13] |
|
| [14] |
|
| [15] |
|
| [16] |
|
| [17] |
|
| [18] |
|
| [19] |
|
| [20] |
|
| [21] |
|
| [22] |
|
| [23] |
|
| [24] |
|
| [25] |
|
| [26] |
|
| [27] |
|
| [28] |
|
| [29] |
|
| [30] |
|
| [31] |
|
| [32] |
|
| [33] |
|
| [34] |
|
| [35] |
|
| [36] |
|
| [37] |
|
| [38] |
|
| [39] |
|
/
| 〈 |
|
〉 |


