
新西兰弧后塔拉纳基地区地幔楔各向异性*
|
曹令敏(1983—), 女, 吉林省延吉市人, 副研究员, 研究方向为地球物理与深部探测。email: |
|
感谢何小波博士对论文讨论的建议。感谢两位匿名审稿专家提出的建设性意见。感谢IRIS (Incorporated Research Institutions for Seismology) 数据管理中心和GeoNet (http://www.geonet.org.nz)为本研究提供地震波形数据和地震目录信息。 |
Copy editor: 姚衍桃
收稿日期: 2022-01-31
修回日期: 2022-04-12
网络出版日期: 2022-04-08
基金资助
中国科学院战略性先导科技专项(B类)资助(XDB42020103)
国家自然科学基金项目(42076068)
国家自然科学基金项目(91858212)
国家自然科学基金项目(91958212)
南方海洋科学与工程广东省实验室(广州)人才团队引进重大专项项目(GML2019ZD0204)
Anisotropic structure in the back arc region, Taranaki, New Zealand*
Copy editor: YAO Yantao
Received date: 2022-01-31
Revised date: 2022-04-12
Online published: 2022-04-08
Supported by
Strategic Priority Research Program of the Chinese Academy of Sciences(XDB42020103)
National Natural Science Foundation of China(42076068)
National Natural Science Foundation of China(91858212)
National Natural Science Foundation of China(91958212)
Key Special Project for Introduced Talents Team of Southern Marine Science and Engineering Guangdong Laboratory (Guangzhou)(GML2019ZD0204)
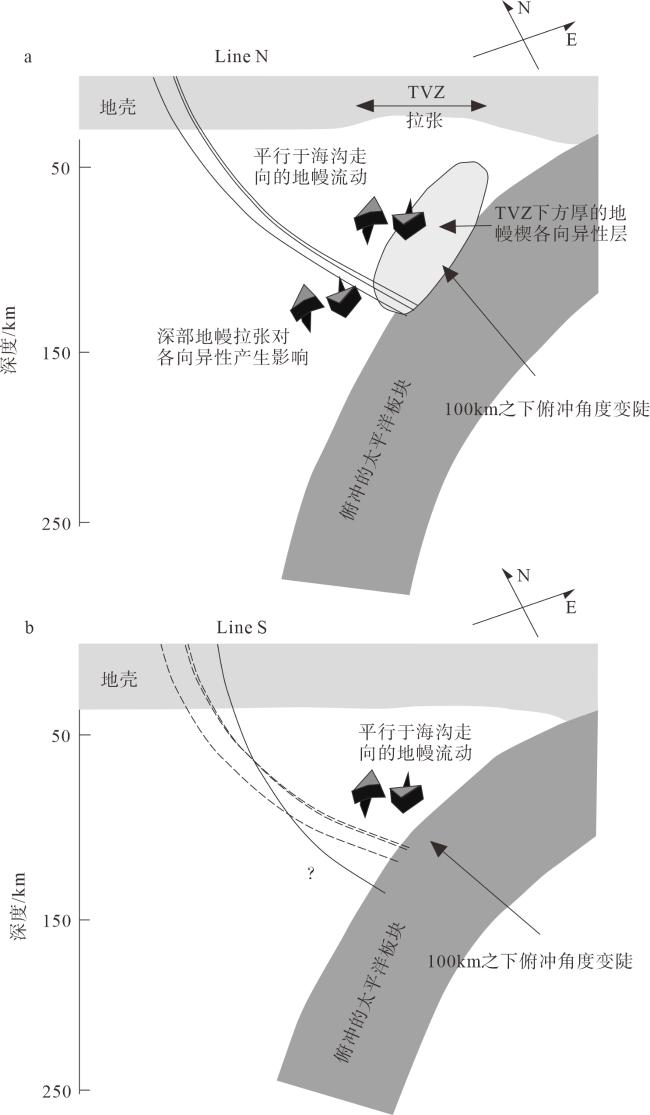
太平洋板块沿希库兰吉海沟俯冲至新西兰北岛下方300km左右, 向南与新西兰南岛发生碰撞, 导致北岛发生顺时针旋转。该区域为研究俯冲带地幔楔变形, 理解俯冲过程中地幔物质运动及其动力学过程的理想场所。本研究利用近震(深度范围在70~150km) S波分裂计算获得了北岛弧后塔拉纳基地区的地幔楔各向异性特征, 结果显示快波方向和延迟时间在空间上存在一定的变化。深度在120km之上的地震对应的快波优势方向为NE—SW, 近似平行于海沟走向, 反映了地幔楔中平行于海沟方向的地幔流动引起的橄榄岩晶格优势排列; 而120km之下地震主要集中在塔拉纳基地区北部, 快波方向为NNE—SSW向, 且延迟时间随深度增大而增加。由于太平洋板块俯冲到100~150km处的俯冲角度急剧变陡至近似直立, 引起深部地幔楔强烈变形。因此, 推测弧后北部深度>120km地震的NNE—SSW快波方向可能是受到地幔楔中平行于海沟走向的地幔流动, 以及俯冲角度变陡而使深部地幔楔强烈变形的共同作用的结果。弧后北部地幔楔深部的拉张作用更为强烈, 是造成各向异性在空间上变化的主要原因。
曹令敏 , 赵亮 , 赵明辉 , 丘学林 , 袁怀玉 . 新西兰弧后塔拉纳基地区地幔楔各向异性*[J]. 热带海洋学报, 2023 , 42(1) : 124 -134 . DOI: 10.11978/2022021
The Pacific plate is subducting beneath the North Island of New Zealand along the Hikurangi Trench to depths of ~300 km, and is colliding with the South Island to the south, causing clockwise rotation of the North Island. Study on deformation of the mantle wedge in the subduction zone is essential to understand the mantle material movement and its dynamic mechanism. In this study, we investigate the anisotropy in the mantle wedge beneath the Taranaki region in the western backarc area of the North Island using the S-wave splitting measurement of local events with depths ranging from 70 km to 150 km. The results show spatial variations in the fast wave direction and delay time. The NE-SW trending dominant fast direction from the events with depths above 120 km is approximately trench-parallel, reflecting the crystallographic preferred orientation of olivine caused by the trench-parallel mantle flow in the mantle wedge. The events below 120 km depth are mainly from north of the Taranaki region. The predominant fast direction of these events is NNE-SSW, which delay times increase with depth. The Pacific slab steepens abruptly to a near-vertical plane at about 100~150 km depth, which could induce stronger shear deformation of upper mantle material in the deep mantle wedge. Therefore, the NNE-SSW trending anisotropy with larger delay times in the deep mantle wedge north of the Taranaki region may be caused by the combination of trench-parallel mantle flow and strong deformation of deep mantle wedge due to steepening of the dipping Pacific slab. The stronger extension in the deep mantle wedge of the northern backarc is the main reason for the spatial variation of anisotropy.
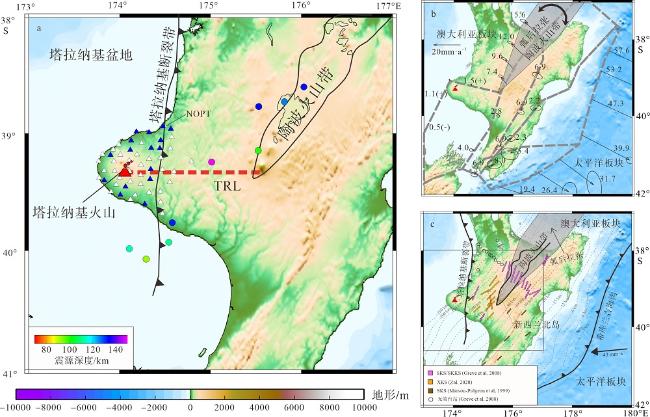
图1 新西兰希库兰吉俯冲带构造背景及北岛塔拉纳基地区41台宽频带地震台站分布图图a Regional tectonic setting of the Hikurangi subduction zone and locations of 41 broadband seismometers used in this study. (a) Triangles represent all the seismometers among which the blue ones yield final reliable splitting measurements. Local events are shown as circles, and colored according to the depth ranging from 70 km to 150 km. The TRL (Taranaki-Ruapehu Line) is marked by the dashed red line. (b) Predicted relative motion (indicated by arrows) across block boundaries (in mm·a-1) made by Wallace and Beavan (2004). Ellipses show the uncertainties of the estimates; plus and minus signify extension and contraction, respectively. (c) Regional tectonic setting of the North Island of New Zealand. Dotted contours of plate interface (in km) are taken from Williams et al (2013). Colored bars represent previous XKS splitting results (Marson-Pidgeon et al, 1999; Greve et al, 2008; Zal, 2020). The black arrow shows the absolute plate motion vector (Beavan et al, 2002). The black rectangle marks the study area |
表1 本研究使用的新西兰北岛塔拉纳基地区41个台站的坐标信息Tab. 1 List of 41 broadband seismometer stations in the Taranaki region used in this study |
| 台站 | 东经/° | 南纬/° | 台站 | 东经/° | 南纬/° | |
|---|---|---|---|---|---|---|
| ALBT | 174.13 | 39.15 | NOPT | 174.49 | 38.95 | |
| AOTT | 174.80 | 39.25 | NOWT | 174.29 | 39.61 | |
| BRET | 174.48 | 39.32 | OMUT | 174.02 | 39.54 | |
| BROT | 174.19 | 38.99 | OPUT | 173.84 | 39.41 | |
| CART | 174.02 | 39.19 | PIKT | 174.46 | 39.07 | |
| CHET | 174.35 | 39.40 | PITT | 174.14 | 39.07 | |
| CLMT1 | 174.24 | 39.37 | PUET | 173.91 | 39.51 | |
| CROT | 174.24 | 39.06 | PUKT1 | 174.59 | 39.04 | |
| DOVT | 173.91 | 39.19 | PUNT | 174.02 | 39.29 | |
| HOLT | 174.56 | 39.43 | SAUT | 173.94 | 39.25 | |
| INGT | 174.46 | 39.60 | STAT | 174.35 | 39.32 | |
| INST | 174.18 | 39.54 | TAVT | 174.46 | 39.51 | |
| KERT | 174.25 | 39.09 | TIRT | 174.33 | 39.51 | |
| LHUT | 174.24 | 39.45 | TOET1 | 174.36 | 39.13 | |
| LTET | 174.61 | 39.34 | TORT | 174.45 | 39.14 | |
| LWHT | 174.07 | 39.47 | UNGT | 173.95 | 39.33 | |
| MAGT | 174.61 | 39.34 | WANT | 173.97 | 39.45 | |
| MATT1 | 174.57 | 39.14 | WAST | 174.33 | 39.00 | |
| MOKT1 | 174.58 | 38.97 | WINT | 174.13 | 39.58 | |
| MTET1 | 174.61 | 39.34 | YORT | 174.25 | 39.28 | |
| NGAT | 174.11 | 39.24 |
表2 本研究中最终使用的近震信息Tab. 2 Information of local events |
| 序号 | 发震时间 | 南纬 /° | 东经 /° | 深度/km | 深度误差/km | 震级 | |
|---|---|---|---|---|---|---|---|
| 日期 | 时刻 | ||||||
| 1 | 2002-04-14 | 23:49:43 | 39.94 | 174.55 | 110.7 | 2.7 | 3.8 |
| 2 | 2002-04-21 | 7:23:13 | 40.08 | 174.30 | 92.6 | 3.9 | 3.9 |
| 3 | 2002-05-06 | 20:51:48 | 39.77 | 174.59 | 132.1 | 3.6 | 3.8 |
| 4 | 2002-05-16 | 17:16:12 | 38.73 | 175.83 | 126.2 | 2.3 | 5.0 |
| 5 | 2002-05-26 | 13:05:23 | 39.15 | 175.54 | 99.7 | 1.9 | 4.0 |
| 6 | 2002-07-25 | 14:02:09 | 39.25 | 175.02 | 149.7 | 2.8 | 3.9 |
| 7 | 2002-07-27 | 20:36:20 | 38.77 | 175.55 | 133.4 | 3.1 | 4.0 |
| 8 | 2002-08-12 | 9:10:32 | 38.60 | 176.05 | 132.8 | 2.4 | 4.0 |
| 9 | 2002-08-22 | 17:51:17 | 39.99 | 174.11 | 113.4 | 3.2 | 3.5 |
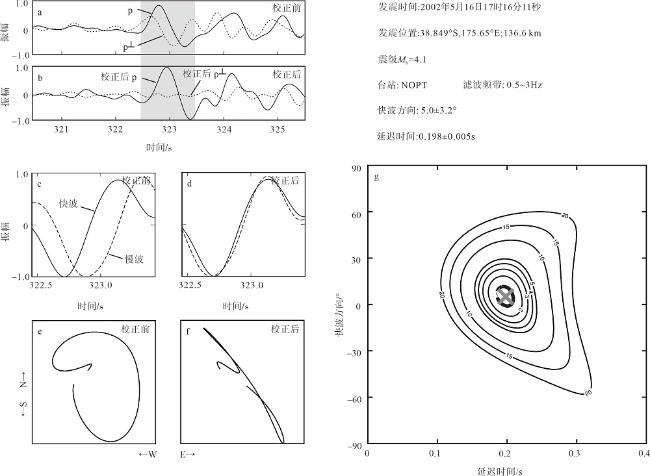
图2 台站ΝΟPΤ记录到的近震S波分裂计算事例图a An example of local S-wave splitting measurement using the MFAST program at station NOPT: (a) S phase on incoming polarization direction (p) and its perpendicular value (p⊥) before anisotropic correction; (b) the waveforms after correction; (c) and (d) normalized fast (solid lines) and slow (dashed lines) shear-wave waveforms before and after the splitting correction, respectively; (e) particle motion in the selected window (gray zones in (a)); (f) particle motion in the selected window (gray zones in (b)); (g) results of grid search for optimal φ and δt (cross). Event information and values of splitting measurements are shown at the top right. Location of the station is shown in |
表3 近震S波分裂计算结果Tab. 3 Summary of local S splitting parameters by station |
| 台站 | 地震序号 | Δt/s | δt误差/s | φ/° | φ误差/° | 台站 | 地震序号 | Δt/s | δt误差/s | φ/° | φ误差/° | |
|---|---|---|---|---|---|---|---|---|---|---|---|---|
| ALBT | 4 | 0.16 | 0.027 | 21 | 6.5 | NOWT | 2 | 0.08 | 0.008 | 49 | 8 | |
| BROT | 4 | 0.13 | 0.007 | 40 | 2.75 | OMUT | 2 | 0.27 | 0.008 | 27 | 6.5 | |
| CHET | 5 | 0.12 | 0.009 | 73 | 2.75 | OPUT | 9 | 0.10 | 0.009 | 70 | 6.5 | |
| DOVT | 2 | 0.11 | 0.015 | 77 | 4 | PIKT | 5 | 0.17 | 0.004 | 40 | 1 | |
| LWHT | 2 | 0.22 | 0.003 | 12 | 5.5 | PITT | 6 | 0.12 | 0.006 | 73 | 5 | |
| MOKT1 | 7 | 0.14 | 0.005 | 4 | 2 | STAT | 1 | 0.11 | 0.050 | 31 | 6.25 | |
| MOKT1 | 8 | 0.33 | 0.016 | 1 | 1.75 | STAT | 3 | 0.06 | 0.004 | 17 | 9.25 | |
| NOPT | 4 | 0.20 | 0.005 | 5 | 3.25 | TOET1 | 5 | 0.12 | 0.018 | 39 | 4.75 | |
| NOPT | 6 | 0.19 | 0.007 | 14 | 2.25 | TORT | 7 | 0.32 | 0.003 | 10 | 2.25 |
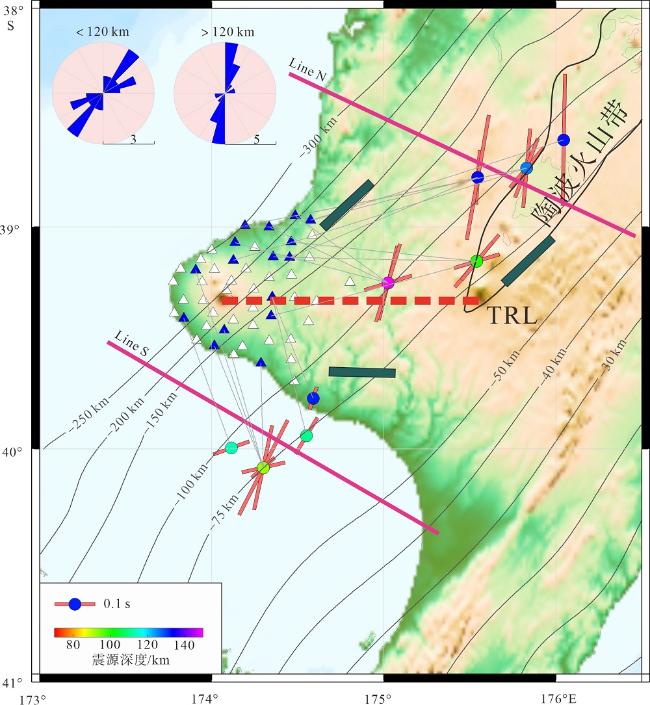
图3 塔拉纳基地区近震S波分裂结果图中三角形代表研究中使用的地震台站, 其中蓝色三角形代表最终获得分裂结果的台站。圆代表分裂结果投影在地震震中的位置, 其不同颜色表示不同震源深度; 橘红色线条的方向和长度分别代表分裂结果的快波方向和延迟时间的大小。灰色虚线为地震到接收台站的连线。左上角的玫瑰图分别为震源深度<120km和>120km的地震S波分裂结果的快波方向统计图; 以15°分区, 区域大小正比于该范围内快波方向的数目(玫瑰图下方数字对应半径长度, 代表该快波方向范围内结果个数)。俯冲板片上界面等深线参考Williams等(2013)。墨绿色线条代表SHmax(最大水平挤压应力)方向(Townend et al, 2012); 红色虚线为TRL(位置见 Fig. 3 All the S-phase splitting measurement results in the Taranaki region. Triangles represent all the stations used in this study, in which the blue ones yield final reliable splitting measurements. Each red-orange bar is plotted at the location of the event (circle colored according to the depth) and represents a single measurement. Orientation of each bar is parallel to measured fast polarization; length is scaled according to delay time. Raypaths between events and stations are delineated with dotted grey lines. Equal-area rose diagrams of S-phase polarizations of results from events above and below the depth of 120 km are shown in the top left corner of the map, respectively. Sectors are drawn every 15°, with areas proportional to the number of polarizations in those directions. The number to the bottom right of each circle represents maximum petal length (the number of polarizations in the corresponding direction). Dotted contours of plate interface (in km) are from Williams et al (2013). Dark green bars show SHmax orientations calculated from focal mechanisms (Townend et al, 2012). TRL marked as a red dotted line is labeled in |
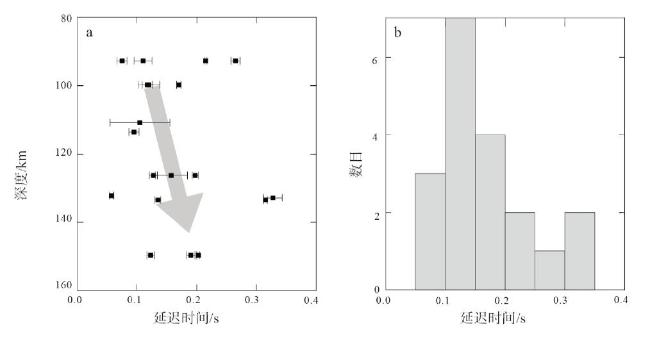
图4 分裂延迟时间与震源深度的关系(a)及慢波延迟时间统计直方图(b)图a中黑色方框左右两侧线段的长度代表延迟时间的误差大小, 灰色箭头代表延迟时间随深度增加而增大的趋势 Fig. 4 Plots of depth versus delay time (a) and histogram of magnitudes of delay times (b). In (a), black rectangles with black bars denote the delay times and their errors. Grey arrow indicates that delay times increase with depths |
图5 沿Line N与Line S剖面地幔楔各向异性模型示意图剖面位置见 Fig. 5 Schematic of possible anisotropic models along Line N and Line S. Locations of the profiles are shown in |
| [1] |
常利军, 王椿镛, 丁志峰, 2006. 云南地区SKS波分裂研究[J]. 地球物理学报, 49(1): 197-204.
|
| [2] |
高原, 刘希强, 梁维, 等, 2004. 剪切波分裂系统分析方法(SAM)软件系统[J]. 中国地震, 20(1): 101-107.
|
| [3] |
宋晓晓, 李春峰, 2016. 西太平洋科学大洋钻探的地球动力学成果[J]. 热带海洋学报, 35(1): 17-30.
|
| [4] |
|
| [5] |
|
| [6] |
|
| [7] |
|
| [8] |
|
| [9] |
|
| [10] |
|
| [11] |
|
| [12] |
|
| [13] |
|
| [14] |
|
| [15] |
|
| [16] |
|
| [17] |
|
| [18] |
|
| [19] |
|
| [20] |
|
| [21] |
|
| [22] |
|
| [23] |
|
| [24] |
|
| [25] |
|
| [26] |
|
| [27] |
|
| [28] |
|
| [29] |
|
| [30] |
|
| [31] |
|
| [32] |
|
| [33] |
|
| [34] |
|
| [35] |
|
| [36] |
|
| [37] |
|
| [38] |
|
| [39] |
|
| [40] |
|
| [41] |
|
| [42] |
|
| [43] |
|
| [44] |
|
| [45] |
|
| [46] |
|
| [47] |
|
| [48] |
|
| [49] |
|
| [50] |
|
| [51] |
|
| [52] |
|
| [53] |
|
| [54] |
|
| [55] |
|
| [56] |
|
| [57] |
|
| [58] |
|
/
| 〈 |
|
〉 |
