
基于贝叶斯网络和GIS的热带气旋灾害风险评估
|
田城(1998—), 男, 湖南省常德市人, 硕士研究生, 从事海洋灾害风险评估研究。email: |
收稿日期: 2022-04-29
修回日期: 2022-07-12
网络出版日期: 2022-07-19
基金资助
国家自然科学基金项目(41605051)
国家自然科学基金项目(41976188)
国防科技大学重点科研计划项目(ZK17-02-010)
Assessment of tropical cyclone disaster risk based on the Bayesian network and GIS
Received date: 2022-04-29
Revised date: 2022-07-12
Online published: 2022-07-19
Supported by
National Natural Science Foundation of China(41605051)
National Natural Science Foundation of China(41976188)
Key Research Program of National University of Defense Technology(ZK17-02-010)
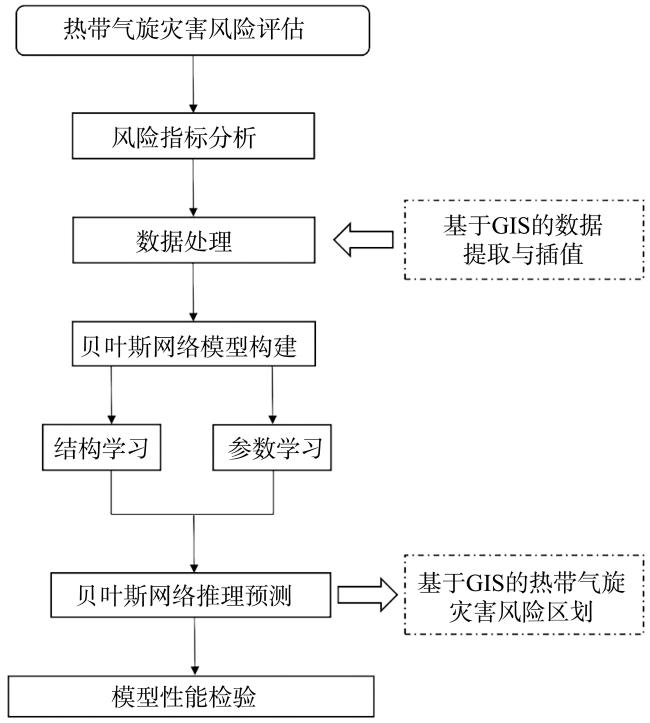
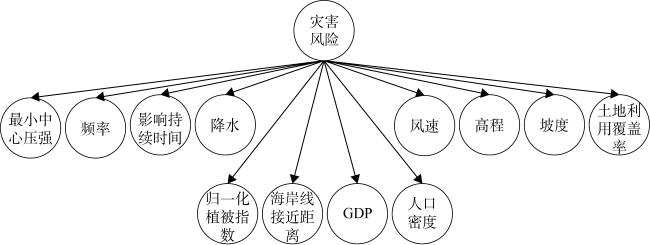
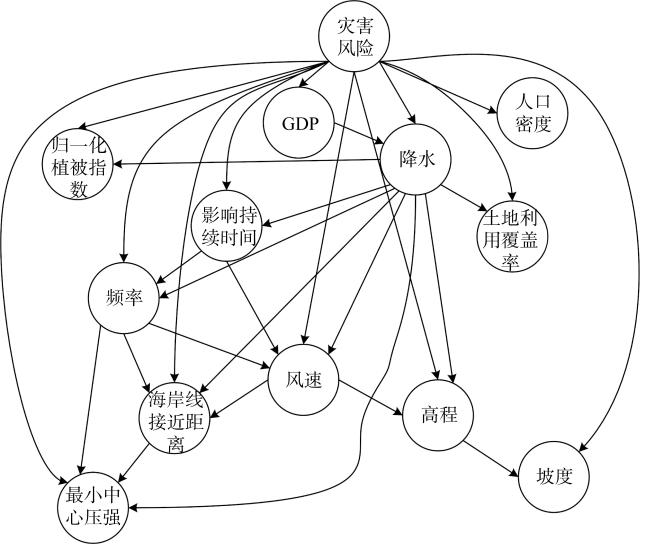
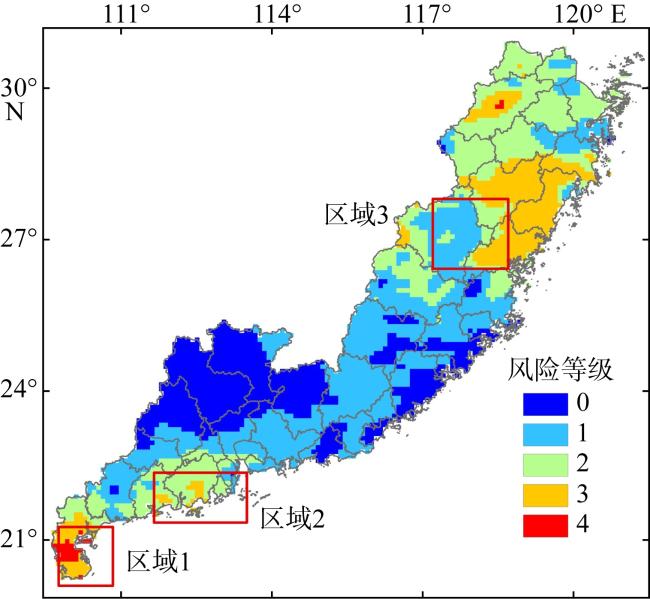
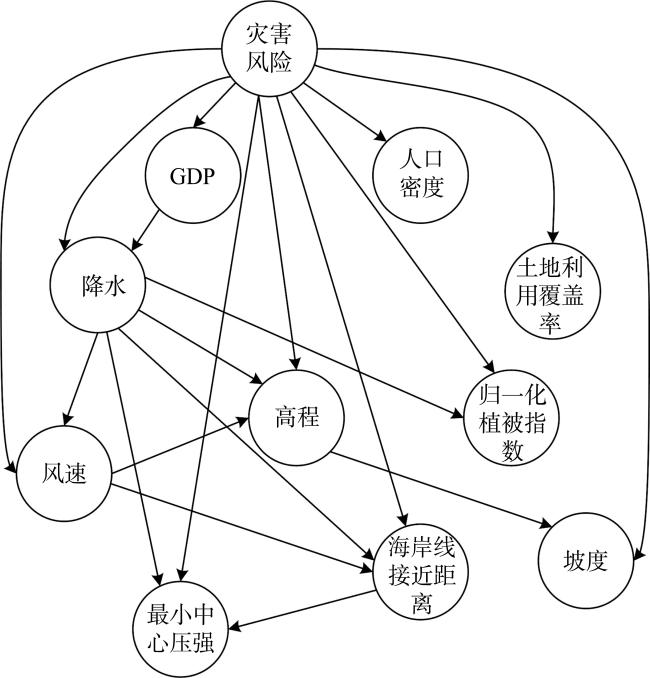
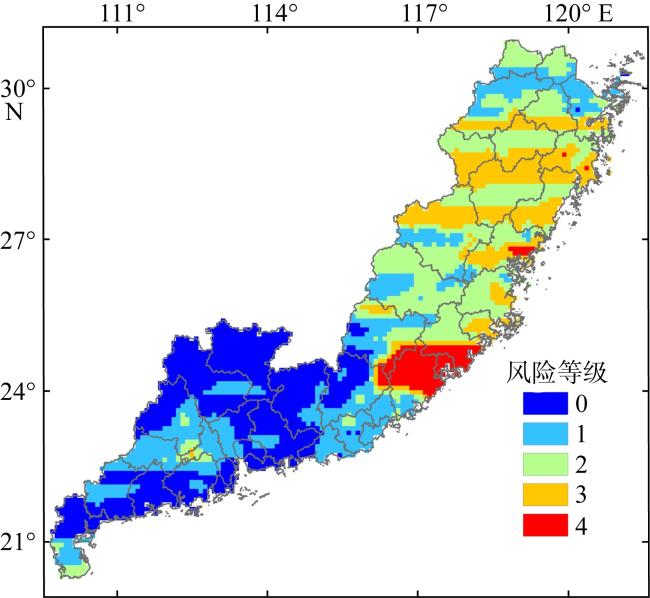
针对热带气旋灾害的复杂性和不确定性, 文章基于贝叶斯网络和地理信息系统(geographic information system, GIS)提出了一种新的热带气旋灾害风险评估模型。该模型能够从客观历史数据中自动挖掘灾害影响因素间的因果关系, 并以概率形式进行表达和推理, 从而对不确定灾害风险进行评估预测。基于1980—2016年中国东南沿海三省(广东、福建、浙江)的热带气旋灾害历史数据进行风险评估实验, 选取致灾因子危险性、孕灾环境敏感性、承灾体脆弱性3个方面共计12个评估指标作为模型输入, 直接经济损失量化为灾害风险等级作为模型输出, 构建基于贝叶斯网络的风险评估模型。然后利用2017—2021年热带气旋灾害数据进行模型检验, 评估预测的准确率为80.75%。模型预测的极低、低、中、高和极高风险的相对误差分别为27.72%、8.45%、18.58%、16.52%和19.12%, 风险预测值的区划结果在空间形态上与实际灾害损失分布高度一致。此外, 还将评估模型构建方法应用于“莫兰蒂”台风灾害个例的风险评估。结果表明, 模型评估出的灾害高风险和极高风险区域与实际灾情报告基本一致。由此可见, 本研究建立的热带气旋灾害风险评估模型具有较高的准确率和可信度, 为热带气旋灾害风险评估提供了一种新的方法途径和技术支撑。
田城 , 黎鑫 , 杜洋 , 李明 , 谢勇 , 夏际炉 . 基于贝叶斯网络和GIS的热带气旋灾害风险评估[J]. 热带海洋学报, 2023 , 42(5) : 17 -29 . DOI: 10.11978/2022092
To address the complexity and uncertainty of tropical cyclone disaster, this study proposes a new tropical cyclone disaster risk assessment model based on the Bayesian network and geographic information system (GIS). The model can automatically explore the causal relationships among disaster influencing factors from objective historical data, and express them in the form of probabilities to assess and predict uncertain disaster risks. Based on the historical data of tropical cyclone disaster in three southeastern coastal provinces (Guangdong, Fujian, and Zhejiang) of China from 1980 to 2016 for risk assessment experiments, a total of 12 assessment indicators in three aspects, i.e., hazard of disaster-causing factors, sensitivity of disaster-inducing environment, and vulnerability of disaster-bearing bodies, were selected as model inputs, and direct economic losses were quantified as disaster risk levels as model outputs to construct a Bayesian network-based risk assessment model. The model was then tested against cyclone disaster data from 2017 to 2021, and the accuracy of the assessment prediction was 80.75%. The relative errors of very low, low, medium, high and very high risks predicted by the model were 27.72%, 8.45%, 18.58%, 16.52%and 19.12%, respectively, and the zonal results of risk prediction values were highly consistent with the actual disaster loss distribution in terms of spatial patterns. In addition, the assessment construction method was applied to the risk assessment of individual cases of Typhoon “Meranti”. The results showed that the high and very high risk areas assessed by the model were basically consistent with the actual disaster reports. Thus, the tropical cyclone disaster risk assessment model established in this study has high accuracy and credibility, and provides a new methodological approach and technical support for tropical cyclone disaster risk assessment.
表1 热带气旋灾害风险评估指标Tab. 1 Tropical cyclone hazard risk indicators |
| 风险组成成分 | 风险指标 |
|---|---|
| 致灾因子危险性 | 最小中心压强 |
| 频率 | |
| 影响持续时间 | |
| 降水 | |
| 风速 | |
| 孕灾环境敏感性 | 高程 |
| 坡度 | |
| 土里利用覆盖率 | |
| 归一化植被指数 | |
| 海岸线接近距离 | |
| 承灾体脆弱性 | 地方生产总值(GDP) |
| 人口密度 |
表2 离散指标数据Tab. 2 Discrete indicator data |
| 划分的区域单元格 | 1 | 2 | 3 | 4 | …… | 4039 | 4040 | 4041 |
|---|---|---|---|---|---|---|---|---|
| 最小中心压强 | 1 | 1 | 1 | 2 | …… | 4 | 4 | 4 |
| 频率 | 1 | 1 | 1 | 0 | …… | 4 | 4 | 4 |
| 影响持续时间 | 0 | 0 | 0 | 0 | …… | 2 | 4 | 4 |
| 降水 | 4 | 4 | 4 | 4 | …… | 0 | 0 | 0 |
| 风速 | 2 | 2 | 2 | 2 | …… | 2 | 1 | 2 |
| 高程 | 3 | 4 | 3 | 4 | …… | 3 | 3 | 3 |
| 坡度 | 4 | 4 | 3 | 4 | …… | 3 | 3 | 3 |
| 土地利用覆盖率 | 1 | 3 | 4 | 4 | …… | 3 | 4 | 0 |
| 归一化植被指数 | 2 | 0 | 2 | 3 | …… | 1 | 1 | 1 |
| 海岸线接近距离 | 2 | 2 | 2 | 3 | …… | 4 | 4 | 4 |
| GDP | 4 | 4 | 4 | 4 | …… | 4 | 4 | 4 |
| 人口密度 | 0 | 0 | 0 | 0 | …… | 0 | 0 | 0 |
| 热带气旋灾害风险 | 3 | 3 | 3 | 3 | …… | 2 | 2 | 2 |
表3 指标节点降水和灾害风险等级的条件概率分布表Tab. 3 Conditional probability distribution P(Risk|Precipitation) of node precipitation |
| 降水等级 | 灾害风险等级 | ||||
|---|---|---|---|---|---|
| 0 | 1 | 2 | 3 | 4 | |
| 0 | 0.0206 | 0.0995 | 0.0443 | 0.0198 | 0.0000 |
| 1 | 0.1777 | 0.0357 | 0.0521 | 0.0555 | 0.0201 |
| 2 | 0.0985 | 0.0636 | 0.0404 | 0.0047 | 0.0573 |
| 3 | 0.0073 | 0.0675 | 0.0010 | 0.0177 | 0.0417 |
| 4 | 0.0000 | 0.0000 | 0.0000 | 0.0443 | 0.0307 |
表4 测试集样本后验概率分布和风险等级Tab. 4 Posterior probability distribution and risk level of tropical cyclone disasters |
| 测试集样本 | 0 | 1 | 2 | 3 | 4 | 评估 风险等级 | 实际 风险等级 |
|---|---|---|---|---|---|---|---|
| 1 | 0 | 0 | 0 | 0.811148 | 0.188852 | 3 | 4 |
| 2 | 0.844427 | 0.155573 | 0 | 0 | 0 | 0 | 0 |
| 3 | 0.862136 | 0.137864 | 0 | 0 | 0 | 0 | 0 |
| 4 | 0 | 0 | 0 | 0 | 1 | 4 | 4 |
| ⋮ | ⋮ | ⋮ | ⋮ | ⋮ | ⋮ | ⋮ | ⋮ |
| 201 | 0 | 0 | 0.029417 | 0.970583 | 0 | 3 | 3 |
| 202 | 1 | 0 | 0 | 0 | 0 | 0 | 0 |
| 203 | 1 | 0 | 0 | 0 | 0 | 0 | 0 |
注: 加粗数字代表最大概率状态节点 |
表5 各风险状态的预测和实际单元格数Tab. 5 Predicted and actual number of cells for each risk state |
| 风险等级 | 0 | 1 | 2 | 3 | 4 |
|---|---|---|---|---|---|
| 模型预测风险等级 | 1055 | 1424 | 951 | 556 | 55 |
| 实际风险等级 | 826 | 1313 | 1168 | 666 | 68 |
| 相对误差/% | 27.72 | 8.45 | 18.58 | 16.52 | 19.12 |
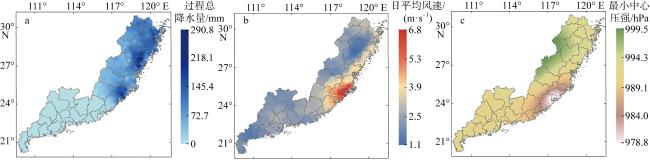
图7 台风“莫兰蒂”致灾因子危险性各指标空间分布图a. 过程总降水量分布图; b. 日平均分速分布图; c. 最小中心压强分布图。该图基于国家测绘地理信息局标准地图服务网站下载的审图号为GS(2021)5447号的标准地图制作, 底图无修改 Fig. 7 Spatial distribution of hazard risk indicators. (a) Distribution map of process total precipitation; (b) Distribution map of daily average wind speed; (c) Distribution map of minimum central pressure |
| [1] |
包文轩, 宫阿都, 徐澯, 等, 2023. 基于区域灾害系统论的广东省台风灾害风险评估——以“山竹”台风为例[J]. 北京师范大学学报(自然科学版), 59(1): 94-103.
|
| [2] |
陈楷俊, 陈艺仪, 陈菁, 2019. 近30年粤东地区台风灾害风险评估与分析[J]. 水土保持研究, 26(3): 362-366, 372.
|
| [3] |
陈香, 2007. 福建省台风灾害时空变化分析[J]. 灾害学, 22(4): 66-70.
|
| [4] |
高歌, 黄大鹏, 赵珊珊, 2019. 基于信息扩散方法的中国台风灾害年月尺度风险评估[J]. 气象, 45(11): 1600-1610.
|
| [5] |
黎鑫, 洪梅, 王博, 等, 2012. 南海-印度洋海域海洋安全灾害评估与风险区划[J]. 热带海洋学报, 31(6): 121-127.
|
| [6] |
李超超, 田军仓, 申若竹, 2020. 洪涝灾害风险评估研究进展[J]. 灾害学, 35(3): 131-136.
|
| [7] |
李明, 张韧, 洪梅, 2018a. 基于加权贝叶斯网络的海洋灾害风险评估[J]. 海洋通报, 37(2): 121-128.
|
| [8] |
李明, 张韧, 洪梅, 等, 2018b. 基于信息流改进的贝叶斯网络结构学习算法[J]. 系统工程与电子技术, 40(6): 1385-1390.
|
| [9] |
刘合香, 卢耀健, 王萌, 等, 2020. 基于信息扩散技术的华南极端台风灾害风险评估[J]. 热带海洋学报, 39(3): 31-41.
|
| [10] |
民政部门户网站, 2022.06.17. 国家减灾委、民政部紧急启动国家Ⅳ级救灾应急响应协助福建省做好“莫兰蒂”台风灾害救灾工作[EB/OL]. [2016-09-16]. http://www.ndrcc.org.cn/yjgz/10466.jhtml (in Chinese).
|
| [11] |
潘金兰, 徐庆娟, 刘合香, 2021. 基于AHP-TOPSIS最优组合赋权的台风灾害风险评估[J]. 南宁师范大学学报(自然科学版), 38(1): 60-67.
|
| [12] |
申怀飞, 杨清洁, 魏亿鑫, 等, 2020. 基于GIS的湖南省滑坡灾害风险和损失评估[J]. 水土保持通报, 40(6): 146-152, 329.
|
| [13] |
汤国安, 2019. 地理信息系统教程(第二版)[M]. 北京: 高等教育出版社.
|
| [14] |
王洁, 杨奕杰, 王杰, 等, 2021. 基于近20a历史数据的中国沿海城市台风灾害风险评估[J]. 海洋预报, 38(5): 24-30.
|
| [15] |
王伟, 金贤锋, 2020. 面向国土空间规划的测绘地理信息技术及数据成果服务应用展望[J]. 测绘通报, 12: 58-64.
|
| [16] |
温家洪, 黄蕙, 陈珂, 等, 2012. 基于社区的台风灾害概率风险评估——以上海市杨浦区富禄里居委地区为例[J]. 地理科学, 32(3): 348-355.
|
| [17] |
吴斌, 钱业, 王瑞芳, 等, 2021. 全球气候模式对影响西北太平洋台风强度的大尺度环境因子的模拟评估[J]. 干旱气象, 39(3): 466-479.
|
| [18] |
徐庆娟, 潘金兰, 刘合香, 2020. 基于云模型—风险矩阵的华南台风灾害综合等级评估[J]. 气象与减灾研究, 43(3): 161-169.
|
| [19] |
于小兵, 俞显瑞, 吉中会, 等, 2019. 基于信息扩散的东南沿海台风灾害风险评估[J]. 灾害学, 34(1): 73-77.
|
| [20] |
张悦, 李珊珊, 陈灏, 等, 2017. 广东省台风灾害风险综合评估[J]. 热带气象学报, 2017, 33(2): 281-288.
|
| [21] |
周华任, 张晟, 穆松, 等, 2015. 综合评价方法及其军事应用[M]. 北京: 清华大学出版社.
|
| [22] |
朱婧, 陆逸, 李国平, 等, 2017. 基于县级分辨率的福建省台风灾害风险评估[J]. 灾害学, 32(3): 204-209.
|
| [23] |
朱婧, 叶龙彬, 陈德花, 等, 2020. 1614号台风“莫兰蒂”在厦门湾及其周边海域引发风暴潮的数值模拟[J]. 海洋预报, 37(6): 20-30.
|
| [24] |
中国新闻网, 2022.06.17. “莫兰蒂”台风造成浙闽直接经济损失210.73亿元[EB/OL]. http://news.cri.cn/uc-eco/20160918/660ac9c9-c670-1ba3-a8a2-c93667984aab.html (in Chinese).
|
| [25] |
|
| [26] |
|
| [27] |
|
| [28] |
|
| [29] |
|
| [30] |
|
| [31] |
|
| [32] |
|
| [33] |
|
| [34] |
|
| [35] |
|
| [36] |
|
| [37] |
|
| [38] |
|
| [39] |
|
| [40] |
|
| [41] |
|
| [42] |
|
| [43] |
|
| [44] |
|
| [45] |
|
| [46] |
|
| [47] |
|
| [48] |
|
/
| 〈 |
|
〉 |
