
基于线粒体控制区序列的黄海日本鳀(Engraulis japonicus)的群体遗传结构*
|
邹聪聪(1994—), 女, 浙江省丽水市人, 博士研究生, 主要从事海水鱼类遗传学研究。email: |
Copy editor: 殷波
收稿日期: 2020-10-15
要求修回日期: 2021-01-29
网络出版日期: 2021-02-09
基金资助
科技基础性工作专项(2014FY110500)
国家海洋水产种质资源库项目(2017DKA30470)
版权
Population genetic structure of Japanese anchovy (Engraulis japonicus) in the Yellow Sea based on mitochondrial control region sequences*
Copy editor: YIN Bo
Received date: 2020-10-15
Request revised date: 2021-01-29
Online published: 2021-02-09
Supported by
Special Program for Basic Research of the Ministry of Science and Technology of China(2014FY110500)
National Marine Genetic Resource Center(2017DKA30470)
Copyright
遗传多样性和群体遗传结构是研究群体动态变化的重要内容, 也是种质资源评估与保护的基础。日本鳀(Engraulis japonicus)是我国东部近海的重要鱼种, 具有重要的生态价值和经济价值。文章利用线粒体控制区全序列分析了黄海海域4个地理群体(北黄海北部、北黄海南部、南黄海北部和南黄海中部)日本鳀的遗传多样性、种群遗传结构和历史动态变化。结果显示, 131个样品检测到了126个单倍型, 且4个群体的单倍型多样性均很高, 其中北黄海南部群体的最低(0.995±0.009), 南黄海中部群体的最高(1.000±0.014)。而核苷酸多样性均较低, 为0.010±0.005 ~ 0.011±0.006。主成分判别分析(DAPC)和遗传分化系数Fst表明4个群体无明显的群体分化现象, 群体间的遗传同质性水平高, 分子方差分析(AMOVA)也显示分子变异基本来自于群体内, 并且没有明显的群体遗传结构。贝叶斯系统发育树分析发现, 黄海日本鳀有2个谱系, 谱系1和谱系2的分化时间为0.701Ma前, 可以追溯到更新世期间; 进一步中性检验和核苷酸错配分布分析表明这2个谱系可能发生过群体扩张。贝叶斯天际线图则显示黄海鳀鱼的有效群体数量在0.150Ma前发生了明显的下降。
邹聪聪 , 王丽娟 , 吴志昊 , 尤锋 . 基于线粒体控制区序列的黄海日本鳀(Engraulis japonicus)的群体遗传结构*[J]. 热带海洋学报, 2021 , 40(5) : 25 -35 . DOI: 10.11978/2020119
Genetic diversity and population structure are important aspects in population dynamics study, and are the basis of fish resources evaluation and protection. Japanese anchovy (Engraulis japonicus) is an important fish species in the China East Coast, which has both ecological and economic values. In this study, the whole sequence of mitochondrial control region was used to analyze the genetic diversity, population genetic structure, and demographic history of its four geographical populations in the Yellow Sea, namely, north of the northern Yellow Sea (NYN), south of the northern Yellow Sea (NYS), north of the southern Yellow Sea (SYN), and central part of the southern Yellow Sea (SYC). A total of 126 haplotypes were detected in 131 samples of the four populations, and their haplotype diversity levels were high, among which the lowest was in the NYS (0.995±0.009) and the highest was in the SYC (1.000±0.014). In all populations, the nucleotide diversity was low (0.010±0.005 to 0.011±0.006). The results of Discriminant Analysis of Principal Components (DAPC) and Fst values indicated that there was no significant segregation among the four populations, and the level of genetic homogeneity among populations was high. There was no obvious population genetic structure, with the large molecular variation within the populations based on the Analysis of Molecular Variance (AMOVA). The Bayesian phylogenetic tree revealed two distinct lineages, which diverged at 0.701 million years ago, dating back to the Pleistocene period. Neutrality test and nucleotide mismatch distribution analyses demonstrated that these two lineages experienced demographic expansions. The effective population of Japanese anchovy in the Yellow Sea decreased significantly at 0.150 million years ago by analyzing the Bayesian skyline.
图1 黄海日本鳀样本采集的地理分布图图中 Fig. 1 Map of sampling locations of Engraulis japonicus in the Yellow Sea. |
表1 日本鳀4个地理群体的遗传多样性参数Tab. 1 Genetic diversity parameters in four Engraulis japonicus populations |
| 群体 | 样品数/个 | 单倍型数/个 | 单倍型多样性 (h±SD) | 核苷酸多样性 (π±SD) | 多态位点数/个 | 碱基转换数/个 | 碱基颠换数/个 | 碱基插入数/个 |
|---|---|---|---|---|---|---|---|---|
| NYN | 43 | 42 | 0.999±0.005 | 0.011±0.005 | 71 | 57 | 19 | 0 |
| NYS | 36 | 34 | 0.995±0.009 | 0.010±0.005 | 61 | 48 | 15 | 4 |
| SYN | 30 | 30 | 1.000±0.009 | 0.010±0.005 | 60 | 52 | 15 | 0 |
| SYC | 22 | 22 | 1.000±0.014 | 0.011±0.006 | 50 | 39 | 11 | 1 |
| 谱系1 | 61 | 60 | 1.000±0.003 | 0.008±0.004 | 72 | 59 | 23 | 1 |
| 谱系2 | 70 | 66 | 0.998±0.003 | 0.009±0.005 | 81 | 65 | 21 | 3 |
| 所有个体 | 131 | 126 | 0.999±0.001 | 0.010±0.005 | 108 | 85 | 38 | 4 |
注: NYN表示北黄海北部; NYS表示北黄海南部; SYN表示南黄海北部; SYC表示南黄海中部 |
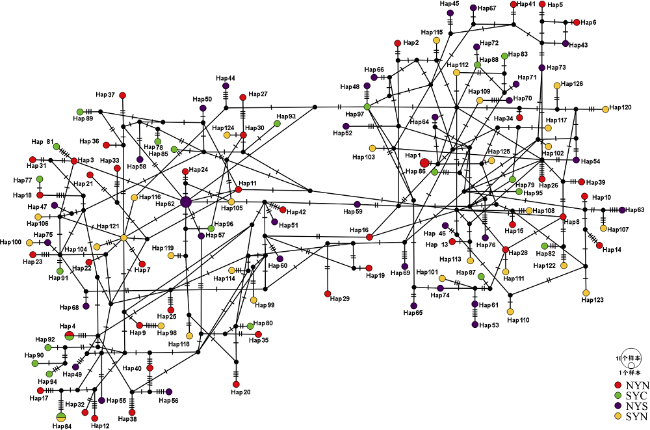
图2 黄海日本鳀的单倍型网络图分支上的短线表示单倍型间的突变 Fig. 2 The haplotype network of Engraulis japonicus in the Yellow Sea. The short lines on the branches indicate mutation step between haplotypes |
表2 日本鳀4个地理群体的成对Fst值的矩阵Tab. 2 Matrix of pairwise Fst’s values among four Engraulis japonicus populations |
| NYN | NYS | SYN | SYC | |
|---|---|---|---|---|
| NYN | 0.000 | |||
| NYS | 0.010 | 0.000 | ||
| SYN | -0.002 | -0.010 | 0.000 | |
| SYC | -0.008 | 0.018 | 0.003 | 0.000 |
注: NYN表示北黄海北部; NYS表示北黄海南部; SYN表示南黄海北部; SYC表示南黄海中部 |
表3 分层结构的分子方差分析Tab. 3 Analysis of Molecular Variance (AMOVA) in hierarchical structure |
| 变异来源 | 平方和 | 变异百分比 | F 统计 | p |
|---|---|---|---|---|
| 一个基因池 | ||||
| 群体间 | 16.901 | 0.190 | ||
| 群体内 | 673.710 | 99.810 | Fst = 0.00192 | 0.341 |
| 两个基因池(NYN、NYS)(SYN、SYC) | ||||
| 组群间 | 3.759 | -0.84 | Fct = -0.00841 | 1.000 |
| 组群内群体间 | 13.141 | 0.74 | Fsc = 0.00734 | 0.131 |
| 群体内 | 673.710 | 100.10 | Fst = -0.00101 | 0.286 |
| 两个基因池(NYN、NYS、SYN)(SYC) | ||||
| 组群间 | 6.157 | 0.41 | Fct = 0.00414 | 0.483 |
| 组群内群体间 | 10.743 | 0.03 | Fsc = 0.00035 | 0.392 |
| 群体内 | 673.710 | 99.55 | Fst = 0.00448 | 0.329 |
注: Fst表示群体内的分化指数; Fct表示组群间的分化指数; Fsc表示组群内群体间的分化指数; p表示显著性差异检测值 |
表4 日本鳀4个地理群体的中性检验Tab. 4 Neutrality tests of four Engraulis japonicus populations in the Yellow Sea |
| 群体 | Tajima’s D | Fu’s Fs | Ramos-Onnsis and Roza’s R2 | |||
|---|---|---|---|---|---|---|
| D | p | Fs | p | R2 | p | |
| NYN | -1.307 | 0.073 | -24.603 | 0.000 | 0.107 | 0.000 |
| NYS | -1.013 | 0.162 | -24.077 | 0.000 | 0.113 | 0.000 |
| SYN | -1.348 | 0.070 | -24.249 | 0.000 | 0.118 | 0.000 |
| SYC | -0.702 | 0.284 | -13.580 | 0.000 | 0.127 | 0.000 |
| 谱系 1 | -1.532 | 0.034 | -24.790 | 0.000 | 0.103 | 0.000 |
| 谱系 2 | -1.435 | 0.041 | -24.619 | 0.000 | 0.099 | 0.000 |
注: p表示显著性差异检测值 |
表5 群体扩张和空间扩张模型下的错配分布Tab. 5 Mismatch distribution under demographic expansion and spatial expansion models |
| 群体 | 群体扩张模型 | 空间扩张模型 | |||||||||
|---|---|---|---|---|---|---|---|---|---|---|---|
| τ | t | θ0 | θ1 | SSD | HRI | τ | θ | M | SSD | HRI | |
| NYN | 10.578 | 0.172 | 0.000 | 1527.500 | 0.001 | 0.007 | 10.585 | 0.010 | 1574.756 | 0.001 | 0.007 |
| NYS | 9.396 | 0.153 | 1.331 | 386.250 | 0.002 | 0.009 | 9.232 | 1.480 | 206.480 | 0.002 | 0.009 |
| SYN | 9.855 | 0.160 | 0.000 | 280.625 | 0.003 | 0.011 | 8.745 | 1.201 | 99999.000 | 0.003 | 0.011 |
| SYC | 11.881 | 0.193 | 0.002 | 279.688 | 0.004 | 0.010 | 11.802 | 0.026 | 99999.000 | 0.004 | 0.010 |
| 谱系1 | 8.326 | 0.135 | 0.228 | 99999.000 | 0.001 | 0.010 | 8.543 | 0.103 | 99999.000 | 0.001 | 0.010 |
| 谱系2 | 10.109 | 0.164 | 0.025 | 118.896 | 0.001 | 0.005 | 9.189 | 0.860 | 287.179 | 0.001 | 0.005 |
注: τ: 扩张参数; t: 实际扩张时间(单位: Ma); θ0: 初始群体大小; θ1: 扩张后群体大小; SSD: 偏差平方和; HRI: Harpending’s Raggedness指数。*表示差异显著(p<0.05); **表示差异极显著(p<0.01) |
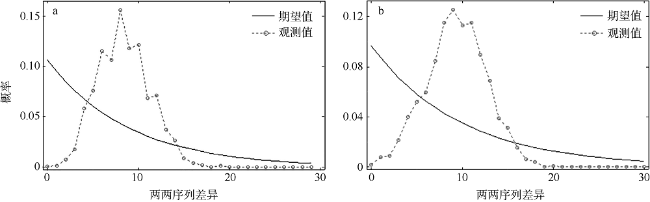
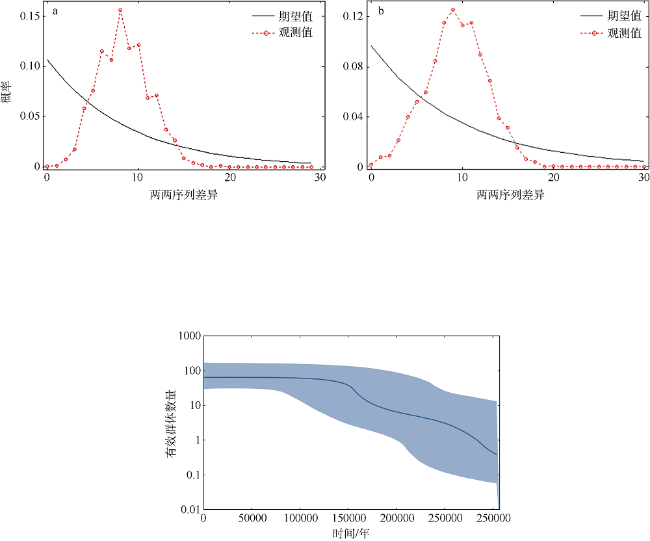
图5 谱系1 (a)和谱系2 (b)的错配分布图Fig. 5 Mismatch distributions of lineage 1 (a) and lineage 2 (b) |
| [1] |
成庆泰, 郑葆珊, 1987. 中国鱼类系统检索[M]. 北京: 科学出版社: 59-61.
|
| [2] |
高天翔, 高兵兵, 李忠炉, 等, 2020. 基于线粒体DNA控制区序列的短棘鲾群体遗传学[J]. 水产学报, 44(5):715-722.
|
| [3] |
胡东方, 2009. 黄海鳀鱼的摄食生态学研究[D]. 青岛: 中国海洋大学: 1-2.
|
| [4] |
李秀梅, 叶振江, 李增光, 等, 2016. 黄海中部近岸产卵场日本鳀卵子大小的时空变化[J]. 中国海洋大学学报, 46(2):54-60.
|
| [5] |
梁述章, 宋炜, 马春艳, 等, 2019. 基于线粒体控制区的中国近海棘头梅童鱼群体遗传结构研究[J]. 海洋渔业, 41(22):138-148.
|
| [6] |
唐启升, 苏纪兰, 2000. 中国海洋生态系统动力学研究. Ⅰ. 关键科学问题与研究发展战略[M]. 北京: 科学出版社: 45-72(in Chinese).
|
| [7] |
吴仁协, 张浩冉, 牛素芳, 等, 2019. 东海近岸带鱼(Trichiurus japonicus)线粒体控制区序列的群体遗传变异研究[J]. 海洋与湖沼, 50(6):1318-1327.
|
| [8] |
薛利建, 刘子藩, 2005. 东海日本鳀数量分布和生物学特性的研究[J]. 浙江海洋学院学报(自然科学版), 24(4):312-317.
|
| [9] |
赵爽, 章群, 乐小亮, 等, 2010. 中国近海5个黑鲷地理群体的遗传变异[J]. 海洋科学, 34(2):75-79.
|
| [10] |
赵宪勇, 2006. 黄海鳀鱼种群动力学特征及其资源可持续利用[D]. 青岛: 中国海洋大学: 18-43.
|
| [11] |
朱琨, 刘微, 2020. 一种鳀鱼提取物的开发和生产工艺研究[J]. 中国食品添加剂, 31(5):69-74.
|
| [12] |
|
| [13] |
|
| [14] |
|
| [15] |
|
| [16] |
|
| [17] |
|
| [18] |
|
| [19] |
|
| [20] |
|
| [21] |
|
| [22] |
|
| [23] |
|
| [24] |
|
| [25] |
|
| [26] |
|
| [27] |
|
| [28] |
|
| [29] |
|
| [30] |
|
| [31] |
|
| [32] |
|
| [33] |
|
| [34] |
|
| [35] |
|
| [36] |
|
| [37] |
|
| [38] |
|
| [39] |
|
| [40] |
|
| [41] |
|
| [42] |
|
| [43] |
|
| [44] |
|
| [45] |
|
| [46] |
|
| [47] |
|
| [48] |
|
| [49] |
|
| [50] |
|
| [51] |
|
| [52] |
|
| [53] |
|
| [54] |
|
| [55] |
|
| [56] |
|
| [57] |
|
| [58] |
|
| [59] |
|
| [60] |
|
/
| 〈 |
|
〉 |


