
热带大洋春季海气耦合模态及其与ENSO的关系*
*感谢ERA5再分析资料提供海表气压、风场数据, 感谢美国国家气候中心提供SST数据下载, 感谢NOAA气候记录计划提供降水, 感谢哥白尼海洋环境监测服务中心提供海表面高度数据下载。
|
张玉红 (1984—), 女, 副研究员, 主要从事海洋动力过程与海气相互作用研究。email: |
Copy editor: 殷波
收稿日期: 2022-05-10
修回日期: 2022-07-14
网络出版日期: 2022-08-02
基金资助
国家自然科学基金项目(41976024)
国家自然科学基金项目(41830538)
国家自然科学基金项目(42090042)
南方海洋科学与工程广东省实验室(广州)项目(2019BT02H594)
热带海洋环境国家重点实验室自主研究项目(LTOZZ2101)
Tropical ocean-atmosphere coupling modes and their relationship with ENSO during spring*
Copy editor: YIN Bo
Received date: 2022-05-10
Revised date: 2022-07-14
Online published: 2022-08-02
Supported by
National Natural Science Foundation of China(41976024)
National Natural Science Foundation of China(41830538)
National Natural Science Foundation of China(42090042)
Southern Marine Science, Engineering Guangdong Laboratory (Guangzhou)(2019BT02H594)
Independent Research Project Program of State Key Laboratory of Tropical Oceanography(LTOZZ2101)
在北半球的春季, 热带三大洋的海洋-大气系统年际变化会对同期太平洋厄尔尼诺-南方涛动(El Niño-Southern oscillation, ENSO)产生响应, 同时也能通过区域海洋-大气耦合过程影响ENSO的发展。基于国际公开使用的海表温度资料和降水资料, 通过联合正交经验分解方法分析, 可以发现全球大洋春季存在两种显著的海气耦合模态。第一模态表现为: 在热带中东太平洋, 海表温度增暖、降水增多; 在热带大西洋和热带印度洋, 降水呈现经向偶极型分布以及跨赤道的海表温度梯度异常; 即伴随ENSO在春季消亡期的空间型态, 大西洋出现经向模态, 印度洋出现反对称模态。第二模态表现为: 太平洋经向海表温度和降水模态, 即太平洋经向模态。回归分析结果表明, ENSO盛期的大气环流调整引起了热带大西洋和印度洋降水辐合带异常, 并通过海面风场异常激发海盆内部的海洋-大气反馈, 引起春季经向模态。进一步研究发现, 冬、春季大西洋和印度洋热带辐合带分别位于赤道以北和以南, 导致两个海盆经向模态的降水异常相对赤道呈反对称分布。在春季, 太平洋经向模态的暖中心延伸到赤道上, 引起西风异常, 为后续El Niño的发展提供了有利条件。文章揭示了太平洋ENSO与春季热带三大洋经向模态之间的关系, 这有助于更好地理解热带气候模态的季节性“足迹”的发展过程。
张玉红 , 张涟漪 , 杜岩 . 热带大洋春季海气耦合模态及其与ENSO的关系*[J]. 热带海洋学报, 2023 , 42(2) : 34 -44 . DOI: 10.11978/2022105
The tropical ocean-atmosphere system in spring may simultaneously respond to the El Niño-Southern Oscillation (ENSO) in the Pacific ocean. At the same time, it can affect the ENSO development through coupled regional ocean-atmosphere interactions. Based on the joint empirical orthogonal function and open-source datasets, we identify two major global climate modes. The first EOF mode presents the ENSO pattern along with the spring meridional mode in the Atlantic and asymmetric mode in the Indian Ocean, in which the sea surface temperature warms up and precipitation increases in the tropical central and eastern Pacific ocean, accompanied by the equator-asymmetric pattern of precipitation in the tropical Atlantic and Indian Oceans as well as anomalous sea surface temperature gradient in the trans-equatorial. Further analyses suggest that the ENSO influences the intertropical convergence zone by adjusting atmospheric circulation during its mature phase and then induces regional ocean-atmosphere feedback resulting in the spring meridional modes. The differences in spring asymmetric modes of precipitation in the tropical Atlantic and the Indian Ocean are determined by the different positions of the intertropical convergence zone in winter and spring. The second mode shows a meridional sea surface temperature and precipitation anomalies in the tropical Pacific, i.e., the Pacific meridional mode. The warm pole of the spring Pacific meridional mode extends over the equator, causing westerly wind anomalies that favor the El Niño development. This study reveals the relationship between the Pacific ENSO and the global spring meridional mode, contributing to a better understanding of the seasonal 'footprint' of tropical climate modes.
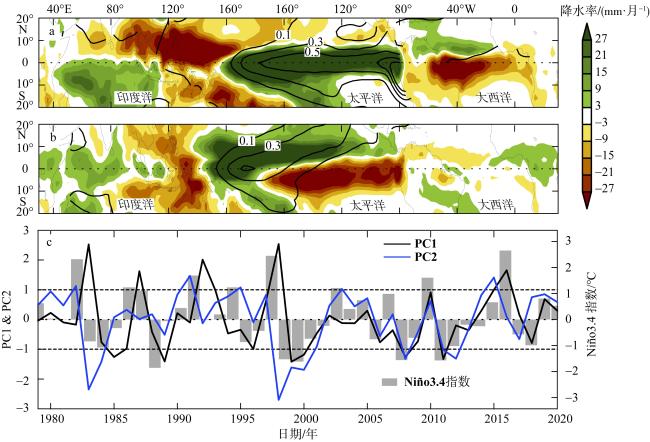
图1 热带海洋北半球春季(3—5月)平均降水率(填色, 单位: mm·月-1)和海表温度(等值线, 单位: ℃)联合经验正交函数的前两模态空间分布和时间序列a. 第一模态空间分布; b. 第二模态空间分布; c. 第一和第二模态对应的时间序列。图c中短虚线标注了1倍标准差的值, 点线为0值; 灰色柱状图为ENSO盛期11月至次年1月平均的Niño3.4指数 Fig. 1 The first two modes of the Joint empirical orthogonal functions (EOF) of boreal spring (March—April—May) mean precipitation rate (shaded, mm·month-1) and sea surface temperature (contours, ℃) in the global tropical ocean and the corresponding time series. (a) the first mode; (b) the second mode; (c) the corresponding time series (PC1 and PC2). Short dashed lines indicate the value of one standard deviation, the dotted line indicates the zero. The gray bars in c indicate the three-month mean Nino3.4 index in November—next January (NDJ) |
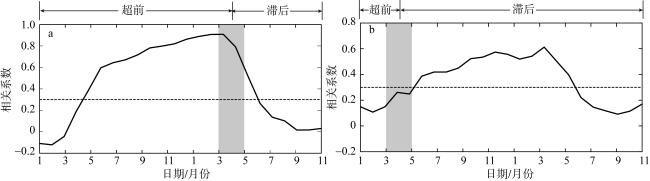
图2 海表温度(单位: ℃)和降水率(单位: mm·月-1)联合EOF分析前两模态时间序列分别与Niño3.4指数之间的超前滞后相关a. PC1与Niño3.4指数; b. PC2与Niño3.4指数。虚线为t检验95%置信度的阈值, 灰色矩形标注了第一、二模态发生的时间, 超前和滞后表示Niño3.4指数超前和滞后第一、二模态 Fig. 2 Lead and lag correlation coefficient between the Noni 3.4 index and PC1, and PC2, respectively. (a) PC1 and Niño3.4 index; (b) PC2 and Niño3.4 index. Dashed lines indicate the threshold value of 95% confidence level of Student’s t-test, the grey rectangles mark the mature phase of the first and second modes, the lead and lag indicate the Nino3.4 index leads and lags the first and second modes |
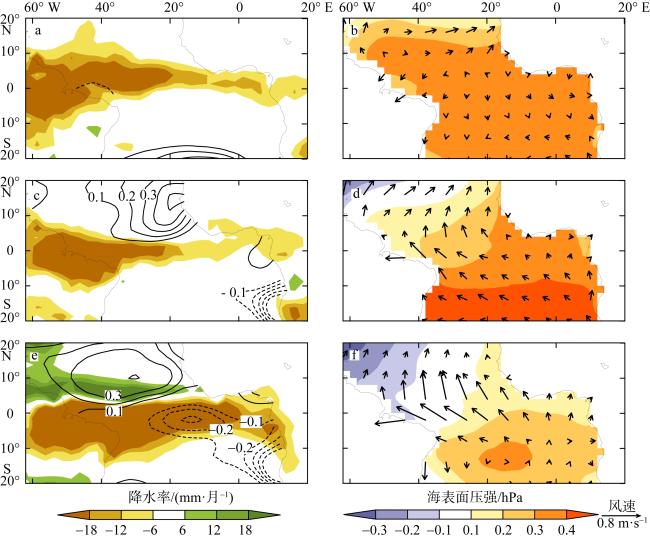
图3 热带大西洋降水率、海表温度、海表面压强和风场异常回归到海表温度和降水联合EOF分析第一模态时间序列上的超前滞后回归系数a, c, e: 降水(填色)和海表温度(等值线, 单位: ℃); b, d, f: 海表面压强(填色)和风场(矢量)。(a, b: 上一年12月到当年1月; c, d: 2月到3月; e, f: 4月到5月。图中只展示了超过t检验95%置信度的结果 Fig. 3 Anomalies of precipitation (Precip, mm·month-1), sea surface temperature (SST, ℃), sea level pressure (Slp, hPa), and 10 m wind (m·s-1) in the tropical Atlantic Ocean obtained by regressing to the PC1, respectively. (a, c, e) precipitation (shaded) and SST (contours); (b, d, f) Slp (shaded) and winds (vectors); (a, b) the last December to January; (c, d) February—March; (e, f) April—May. The regressed results exceeding 95% confidence level of Student’s t-test are shown |
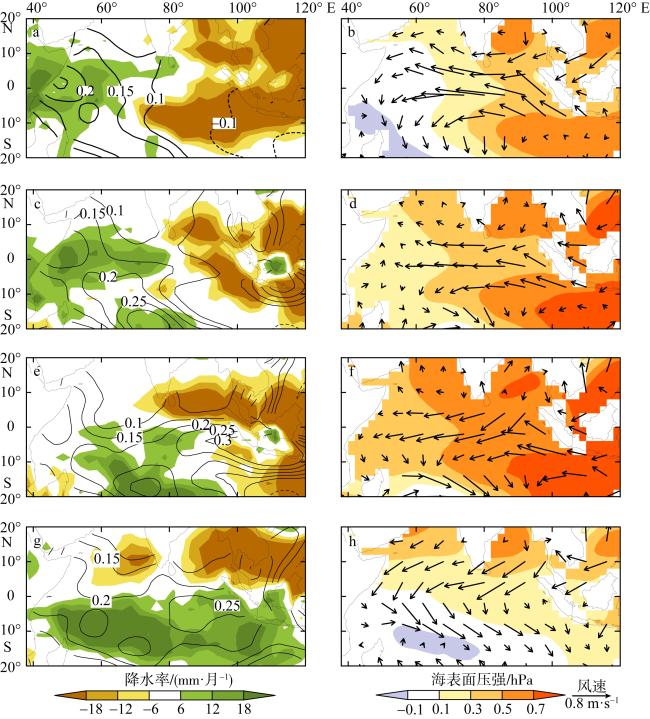
图4 热带印度洋降水、海表温度、海表面压强和风场异常回归到海表温度和降水联合EOF分析第一模态时间序列上的超前滞后回归系数a, c, e, g: 降水(填色)和海表温度(等值线, 单位: ℃); b, d, f, h: 海表面压强(填色)和风场(矢量)。a, b: 上一年10月到11月; c, d: 上一年12月到当年1月; e, f: 2月到3月; g, h: 4月到5月。图中只展示了超过t检验95%置信度的结果 Fig. 4 Anomalies of precipitation (Precip, mm·month-1), sea surface temperature (SST, ℃), sea level pressure (Slp, hPa), and 10 m wind (m·s-1) in the tropical Indian Ocean obtained by regressing to the PC1, respectively. (a, c, e, g) precipitation (shaded) and SST (contours); (b, d, f) Slp (shaded) and winds (vectors); (a, b) the last October to November; (c, d) December to January; (e, f) February—March; (g, h) April—May. The regressed results exceeding 95% confidence level of Student’s t-test are shown. |
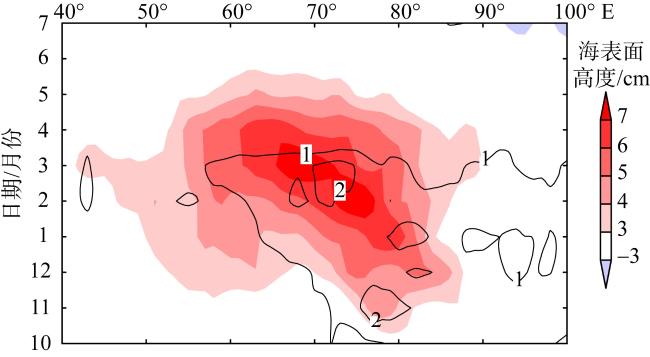
图5 热带南印度洋12°—8°S海表面高度(填色, 单位: cm)和10m大气风场旋度(等值线, 单位: ×10-6s-1)回归到海表温度和降水联合EOF分析第一模态时间序列上的超前滞后回归系数经向平均的经度-时间变化图图中只展示了超过t检验95%置信度的结果 Fig. 5 Longitude-time diagram of the meridional averaged anomalies of sea surface height (SSH, shaded, cm), and 10 m wind curl (contours, s-1) in the south tropical Indian Ocean between 12°—8°S obtained by regressing to the PC1, respectively. The regressed results exceeding 95% confidence level of Student’s t-test are shown |
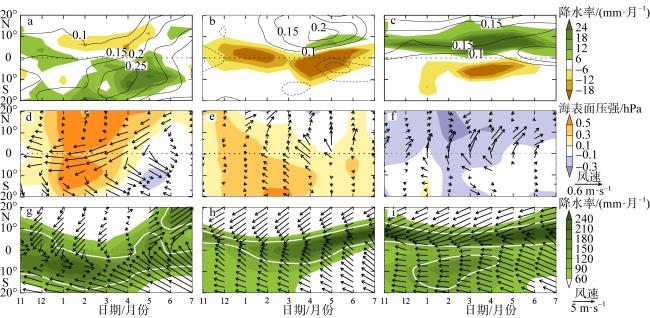
图6 热带印度洋、大西洋和太平洋降水率、海表温度、海表面压强(hPa)和风场异常回归到海表温度和降水联合EOF分析第一和第二模态时间序列上的超前滞后回归系数和气候态降水和风场的纬向平均的纬度-时间变化图a, d, g: 印度洋(50°—90°E); b, e, h: 大西洋(60°W—20°E); c, f, i: 太平洋(140°E—80°W)。a, b, c: 降水(填色)和海表温度(等值线, 单位: ℃)的回归系数; d, e, f: 海表面压强(填色)和风场(矢量)的回归系数; g, h, i: 气候态降水(填色)和风场(矢量), 图中白色粗实线标注了气候态降水量为130 mm·月-1 的等值线(强降水中心)。印度洋和大西洋的各变量回归到第一模态; 太平洋的变量回归到第二模态。图中回归系数只展示了超过t检验95%置信度的结果 Fig. 6 Latitude-time diagram of the zonal averaged anomalies of precipitation (mm·month-1), sea surface temperature (℃), sea level pressure (hPa), and 10 m wind (m·s-1) in the tropical Indian Ocean, the Atlantic Ocean and the Pacific Oceans obtained by regressing to the PC1 and PC2, respectively, and the climatological mean precipitation and wind. The regressed results exceeding 95% confidence level of Student’s t-test are shown. (a, d, g) Indian Ocean (50°—90°E); (b, e, h) Atlantic Ocean (60°W—20°E); (c, f, i) Pacific (140°E—80°W); (a, b, c) regressions of precipitation (shading) and SST (contours); (d, e, f) regressions of sea level pressure (shaded), and 10 m wind (vectors); (g, h, i) climatological mean precipitation (shaded) and wind (vectors). White bold contours in e and f labels the heavy precipitation centers with precipitation rate larger than 130 mm·month-1. The anomalies in the tropical Indian Ocean and the Atlantic Ocean are regressed to the PC1; the anomalies in the Pacific ocean are regressed to the PC2 |
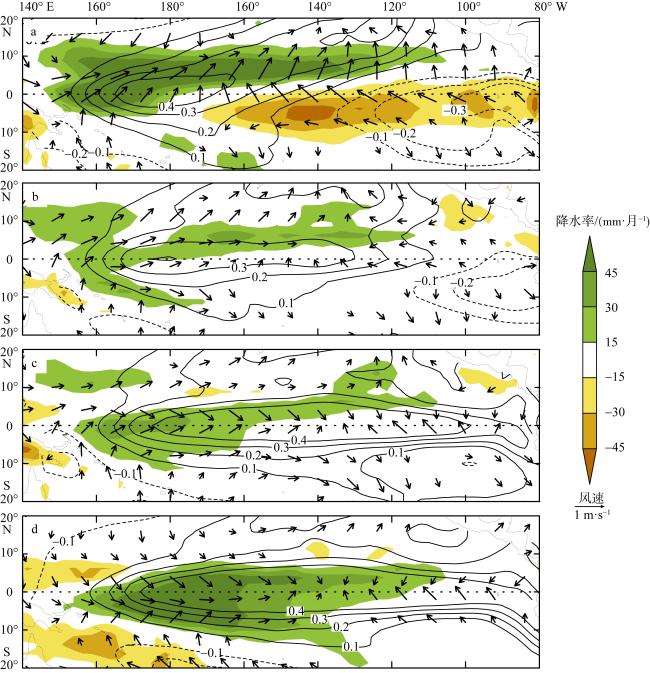
图7 热带太平洋降水率(填色)、海表温度(等值线, 单位: ℃)和风场(箭头)异常回归到海表温度和降水联合EOF分析第二模态时间序列上的超前滞后回归系数的季节平均值a. 春季(3—5月); b. 夏季(6—8月); c. 秋季(9—11月); d. 冬季(12月—次年2月)。图中只展示了超过t检验95%置信度的结果 Fig. 7 Anomalies of precipitation (mm·month-1) and sea surface temperature (℃) in the tropical Pacific Ocean obtained by regressing to the PC2, respectively. The regressed results exceeding 95% confidence level of Student’s t-test are shown. (a) spring (March—April—May, MAM); (b) summer (June—July—August, JJA); (c) fall (September—October—November, SON); (d) winter (December—January—February, DJF) |
| [1] |
|
| [2] |
|
| [3] |
|
| [4] |
|
| [5] |
|
| [6] |
|
| [7] |
|
| [8] |
|
| [9] |
|
| [10] |
|
| [11] |
|
| [12] |
|
| [13] |
|
| [14] |
|
| [15] |
|
| [16] |
|
| [17] |
|
| [18] |
|
| [19] |
|
| [20] |
|
| [21] |
|
| [22] |
|
| [23] |
|
| [24] |
|
| [25] |
|
| [26] |
|
| [27] |
|
| [28] |
|
| [29] |
|
| [30] |
|
| [31] |
|
| [32] |
|
| [33] |
|
| [34] |
|
| [35] |
|
| [36] |
|
| [37] |
|
| [38] |
|
| [39] |
|
| [40] |
|
| [41] |
|
| [42] |
|
| [43] |
|
| [44] |
|
| [45] |
|
| [46] |
|
| [47] |
|
| [48] |
|
| [49] |
|
| [50] |
|
| [51] |
|
| [52] |
|
| [53] |
|
| [54] |
|
| [55] |
|
| [56] |
|
| [57] |
|
| [58] |
|
| [59] |
|
| [60] |
|
| [61] |
|
/
| 〈 |
|
〉 |
