
南海北部陆缘不均匀伸展及脉动式构造升降史*
|
赵中贤(1985—), 男, 山东省菏泽市人, 研究员, 从事构造沉降与地球动力学研究。email: |
|
*感谢中国海洋石油公司提供的反射地震数据。感谢编辑部老师和两位匿名审稿专家提出的宝贵建议。 |
Copy editor: 林强
收稿日期: 2022-06-10
修回日期: 2022-08-15
网络出版日期: 2022-09-07
基金资助
中国科学院青年创新促进会资助项目
自然资源部海底矿产资源重点实验室开放基金(KLMMR-2018-B-06)
南方海洋科学与工程广东省实验室(广州)人才团队引进重大专项(GML2019ZD0205)
国家重点研发计划(2021YFC3100604)
国家自然科学基金面上基金(42076077)
Heterogeneous extension and pulsed tectonic subsidence in the northern South China Sea margin*
Copy editor: LIN Qiang
Received date: 2022-06-10
Revised date: 2022-08-15
Online published: 2022-09-07
Supported by
Youth Innovation Promotion Association CAS
Key Laboratory of Marine Mineral Resources, Ministry of Natural Resources(KLMMR-2018-B-06)
Key Special Project for Introduced Talents Team of Southern Marine Science and Engineering Guangdong Laboratory (Guangzhou)(GML2019ZD0205)
National Key Research and Development Program of China(2021YFC3100604)
National Natural Science Foundation of China(42076077)
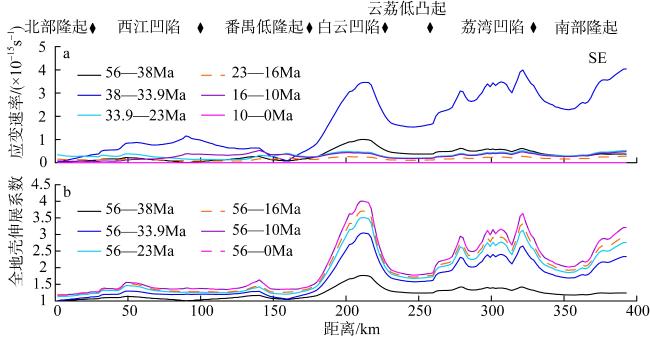
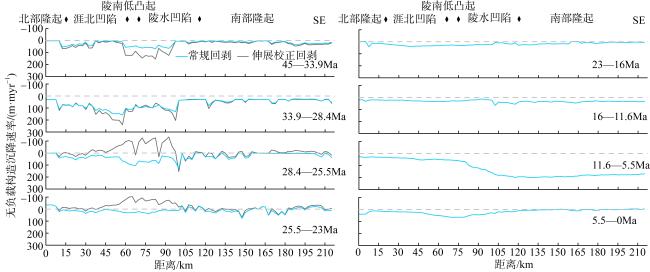
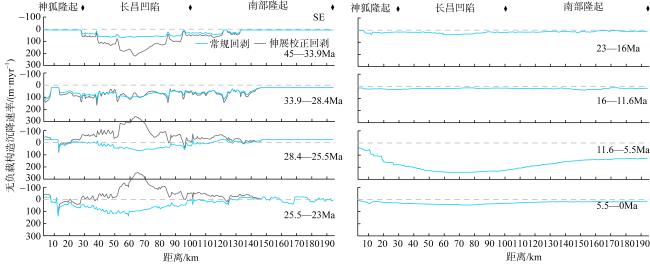
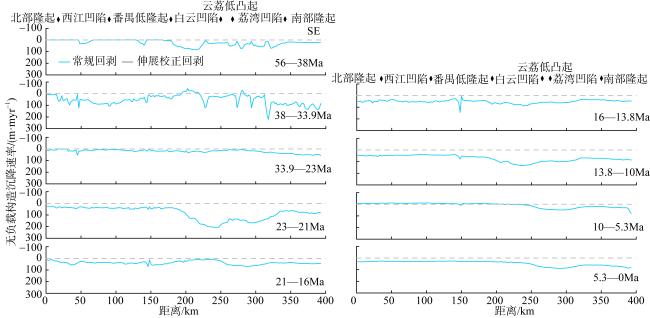
南海北部陆缘在区域板块构造和深部地幔流影响下, 发育了复杂的构造、岩浆和基底升降过程。本文采用最新提出的伸展校正回剥技术和4条长地震剖面, 对南海北部陆缘新生代伸展变形和从张裂到裂后的构造升降过程开展详细研究。结果表明南海北部陆缘伸展减薄差别大, 强伸展与弱伸展不仅具有南北分带特点, 还具有东西交替出现的分块特征。琼东南盆地、珠江口盆地中部、台西南盆地伸展减薄大, 部分地壳被减薄至10km以下; 而珠江口西部和东部伸展减薄小, 地壳厚度大都在20km以上。强伸展与弱伸展陆缘总应变不同, 但应变速率均具有张裂早期慢、晚期快的二阶段特征。强伸展陆缘最大应变速率在4×10-15~7×10-15s-1之间, 地壳最大伸展系数为4~10; 弱伸展陆缘最大应变速率小于1×10-15s-1, 最大伸展系数小于1.9。南海北部陆缘构造升降具有脉动式、快慢交替的特征。张裂期构造沉降快, 裂后构造升降表现为4幕先慢后快及东早西晚的特点。陆缘西部琼东南盆地脉动式升降主要与深部地幔上升流引起的动力地形有关。陆缘东部珠江口和台西南盆地脉动式构造升降则可能受南海打开过程及吕宋岛弧与南海陆缘碰撞的影响。
赵中贤 , 孙珍 , 毛云华 , 张伙带 . 南海北部陆缘不均匀伸展及脉动式构造升降史*[J]. 热带海洋学报, 2023 , 42(3) : 96 -115 . DOI: 10.11978/2022133
Under the influence of regional plate tectonics and deep mantle flow, the northern continental margin of the South China Sea has developed the complicated tectonic, magmatic and basement subsidence processes. In this study, the modified technique of back-stripping and four long seismic profiles are applied to conduct an in-depth investigation into the Cenozoic extensional deformation of the northern South China Sea margin and the syn- to post-rift tectonic subsidence history. Results show a significant difference in the crustal thinning in the northern South China Sea margin. From east to west, the strong and weak extensional zones occur alternatively. The Qiongdongnan Basin, the middle segment of the Pearl River Mouth Basin, and the Taixinan Basin experienced strong extension, and part of the crust is extremely thinned to less than 10 km; while the west and east segments of the Pearl River Mouth underwent minor extension, and the crustal thickness mostly remains above 20 km. The total strain between the strong and weak extensional margins are largely different, however, the strain rates both show a two-stage characteristics: slow in the early syn-rift period and fast in the post-rift period. In the strong extensional margin, the largest strain rate ranges between 4×10-15 and 7×10-15·s-1, and the maximum extensional factor is 4~10; while in the weak extensional margin, the largest strain rate is less than 1×10-15·s-1, and the maximum extension factor is less than 1.9. Moreover, the northern continental margin of the South China Sea is characterized by pulsed and alternative fast and slow tectonic subsidence. The tectonic subsidence was rapid during the syn-rift period. The post-rift period is characterized by four episodes of slow-fast-slow-slow tectonic subsidence, which happened early in the east then late in the west. The pulsed tectonic subsidence in the Qiongdongnan Basin is mainly related to deep mantle upwelling. The pulsed tectonic subsidence in the Pearl River Mouth and the Taixinan Basins may be affected by the diachronous opening of the South China Sea and the collision between the Luzon Island Arc and the South China Sea margin.
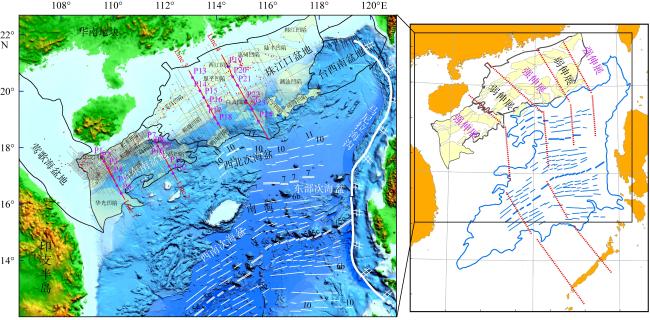
图1 南海地形及数据分布与研究区域构造南海洋盆由东部次海盆、西北次海盆和西南次海盆组成, 白色短线为海底磁异常条带(Briais et al, 1993)。南海北部陆缘自西向东分布有莺歌海、琼东南、珠江口和台西南盆地。盆地内灰色直线为多道地震测线, 红色圆点为油气钻井和大洋钻探钻孔。加粗红色直线Lines 1—4为本文用到的4条反射地震测线, 线上取点P1—24开展精细基底构造升降分析。基于审图号GS(2016)1609的标准地图制作 Fig. 1 Regional structural map (a) and topography and data distribution of the South China Sea (b). The South China Sea Basin is composed of the eastern sub-basin, the northwestern sub-basin and the south-western sub-basin. The white short lines are the seafloor magnetic anomalies (Briais et al, 1993). In the northern continental margin of the South China Sea, there are the Yinggehai, Qiongdongnan, Pearl River Mouth and Taixinan Basins from west to east. The gray straight lines are multi-channel seismic survey lines, and the red dots mark the oil and gas wells and IODP drilling cites. The bold red lines 1-4 stand for four reflection seismic lines used here, and points P1-24 are selected to perform the detailed tectonic subsidence analysis. |
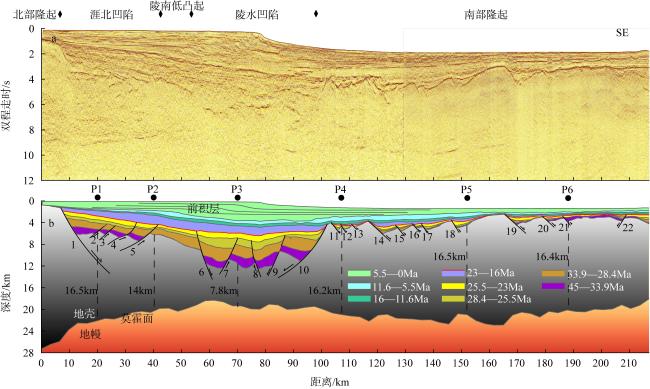
图6 地震测线1(位置见 |
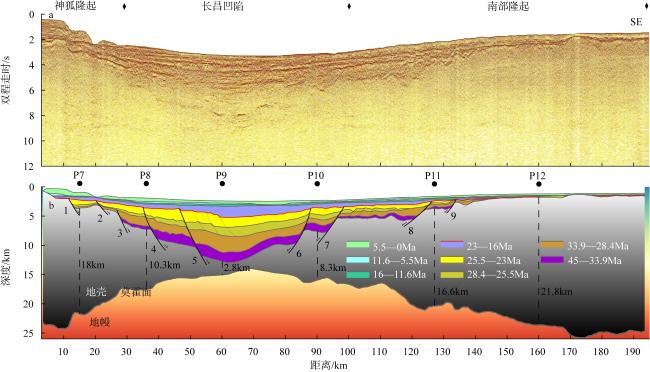
图7 地震测线2(位置见 |
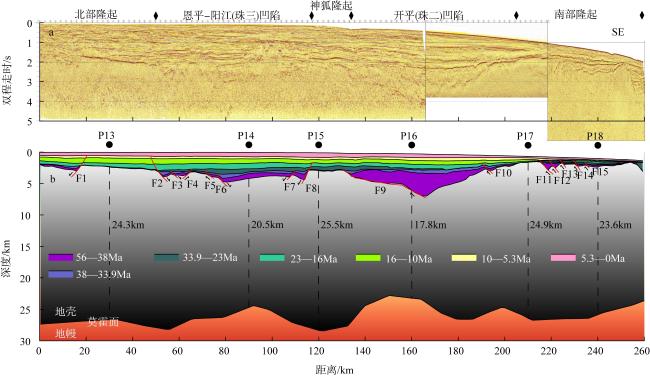
图8 地震测线3(位置见 |
表1 测线1断层活动速率Tab. 1 Fault growth rates along line 1 |
| 断层 | 活动速率/(m·Myr-1) | ||||
|---|---|---|---|---|---|
| 45—33.9Ma | 33.9—28.4Ma | 28.4—25.5Ma | 25.5—23Ma | 23—0Ma | |
| F1 | 120.8 | 283.5 | 236.2 | 232.0 | - |
| F4 | 9.8 | 16.2 | 58.0 | 29.6 | - |
| F5 | 70.7 | 82.4 | 57.7 | 46.2 | - |
| F6 | 125.9 | 85.5 | 201.2 | 26.7 | - |
| F7 | 43.1 | 62.0 | 271.5 | - | - |
| F8 | 35.9 | 83.6 | 88.7 | - | - |
| F9 | 122.1 | 99.5 | 205.4 | - | - |
| F10 | 178.3 | 339.8 | 370.4 | 200.5 | - |
| F14 | - | 121.7 | 109.9 | 181.0 | - |
| F15 | - | 60.4 | 26.4 | 55.1 | - |
| F16 | - | - | - | 78.3 | - |
| F17 | - | - | - | 54.9 | - |
| F18 | - | 43.6 | 67.6 | 317.6 | - |
| F19 | 31.5 | 55.5 | - | 231.5 | - |
| F20 | 22.2 | 29.2 | - | 140.6 | - |
| 平均 | 71.1 | 90.0 | 145.7 | 123.8 | 0 |
注: 数据来自Zhao(2021) |
表2 测线2断层活动速率Tab. 2 Fault growth rates along line 2 |
| 断层 | 活动速率/(m·Myr-1) | ||||
|---|---|---|---|---|---|
| 45—33.9Ma | 33.9—28.4Ma | 28.4—25.5Ma | 25.5—23Ma | 23—0Ma | |
| F1 | - | 45.9 | 135.0 | 370.4 | - |
| F2 | - | 74.3 | - | 41.9 | - |
| F3 | 57.3 | 178.6 | - | - | - |
| F4 | 116.4 | 20.3 | - | - | - |
| F5 | 39.3 | 106.5 | 150.9 | - | - |
| F6 | 35.8 | 267.1 | 107.5 | - | - |
| F7 | 122.6 | 107.9 | 102.4 | 80.8 | - |
| F8 | 41 | 196.8 | - | 131.8 | - |
| F9 | 32.7 | 84.9 | - | 127.1 | - |
| 平均 | 63.6 | 120.3 | 124.0 | 150.4 | 0 |
表3 测线3断层活动速率Tab. 3 Fault growth rates along line 3 |
| 断层 | 活动速率/(m·Myr-1) | ||||
|---|---|---|---|---|---|
| 56—38Ma | 38—33.9Ma | 33.9—23Ma | 23—16Ma | 16—0Ma | |
| F1 | 23.7 | 56.5 | - | - | - |
| F2 | 10.8 | 98.5 | 16.4 | 37.7 | - |
| F3 | - | 45.8 | - | - | - |
| F4 | 10.6 | 47.9 | - | - | - |
| F5 | 16.9 | 32.7 | 17 | - | - |
| F6 | 14.8 | 99.4 | - | - | - |
| F7 | - | 38.1 | - | - | - |
| F8 | 45 | 62 | 13.2 | - | - |
| F9 | 197 | 88.9 | - | - | - |
| F10 | - | - | - | 18.9 | - |
| F11 | 49.3 | 33 | 11.5 | 10.9 | - |
| F12 | 14.9 | - | - | 12.7 | - |
| F13 | 13.2 | - | - | - | - |
| F14 | 13.6 | - | 10.3 | - | - |
| F15 | - | 11 | - | - | - |
| 平均 | 37.3 | 55.8 | 13.7 | 20 | 0 |
注: 数据来自毛云华 等(2020) |
表4 测线4断层活动速率Tab. 4 Fault growth rates along line 4 |
| 断层 | 活动速率/(m·Myr-1) | |||||
|---|---|---|---|---|---|---|
| 56—38Ma | 38—33.9Ma | 33.9—23Ma | 23—16Ma | 16—10Ma | 10—0Ma | |
| F1 | - | 111.4 | 68.4 | 66.7 | 21.8 | - |
| F2 | 44 | 179.4 | 77.6 | - | 11.7 | - |
| F3 | - | 45.9 | - | - | 4.9 | - |
| F4 | 70 | 144.9 | 25.9 | 14 | 59.6 | - |
| F5 | 157.1 | 363.8 | 19.6 | - | 38.7 | - |
| F6 | 84.6 | 86.6 | 7.6 | - | - | - |
| F7 | 66.5 | 221 | 12.8 | - | - | - |
| F8 | 29.9 | 327.8 | - | - | - | - |
| F9 | 21.2 | 613.8 | - | - | - | - |
| 平均 | 67.6 | 232.7 | 30.3 | 40.4 | 27.3 | 0 |
图10 沿地震测线1(位置见 |
图11 沿地震测线2(位置见 |
图12 沿地震测线 3(位置见 |
图13 沿地震测线4(位置见 |
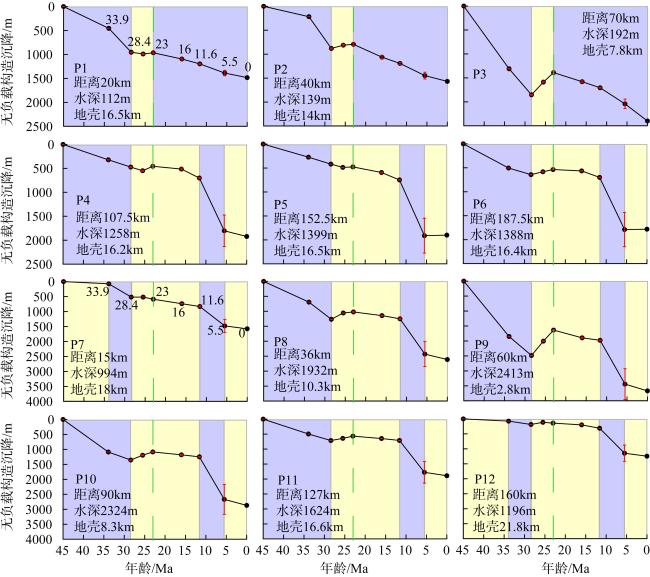
图14 琼东南盆地12口模拟井在9个时间点(45、33.9、28.4、25.5、23、16、11.6、5.5、0Ma)的构造沉降曲线绿色虚线代表破裂不整合界面23Ma Fig. 14 Tectonic subsidence curves of 12 simulated wells in the Qiongdongnan Basin at 9 ages (45, 33.9, 28.4, 25.5, 23, 16, 11.6, 5.5, 0 Ma). The green dashed line represents the breakup unconformity of ~23Ma. |
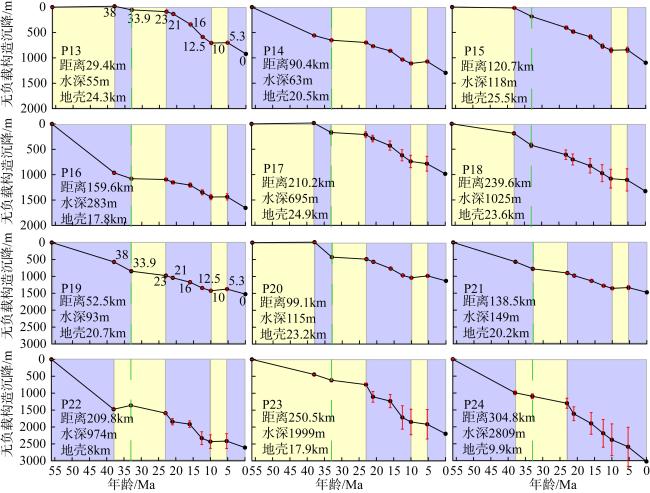
图15 珠江口盆地12口模拟井在10个时间点(56、38、33.9、23、21、16、12.5、10、5.3、0Ma)的构造沉降曲线绿色虚线代表破裂不整合界面33.9Ma Fig. 15 Tectonic subsidence curves of 12 simulated wells in the Pearl River Mouth Basin at 10 ages (56, 38, 33.9, 23, 21, 16, 12.5, 10, 5.3, 0Ma). The green dashed line represents the breakup unconformity of ~33.9Ma |
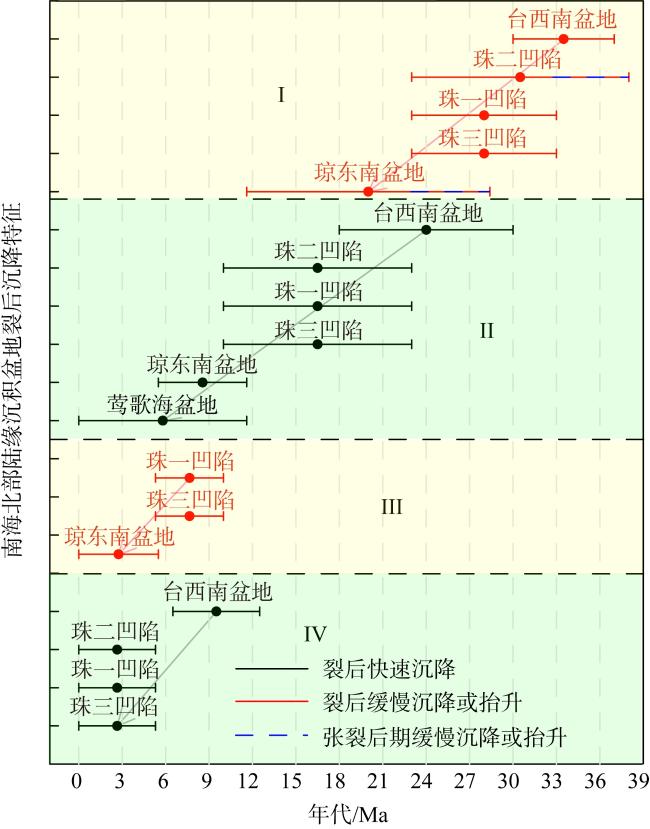
图16 南海北部陆缘裂后东早西晚的两幕慢沉降(I、Ⅲ)和两幕快沉降(Ⅱ、Ⅳ)台西南和莺歌海盆地数据分别来自Lin等(2003)和Xie等(2006) Fig. 16 Two episodes of slow subsidence (I, Ⅲ) and two episodes of fast subsidence (Ⅱ, Ⅳ) in the post-rift period in the northern South China Sea. Subsidence data in the Taixinan and Yinggehai Basins are taken from Lin et al (2003) and Xie et al (2006), respectively |
| [1] |
陈汉宗, 吴湘杰, 周蒂, et al, 2005. 珠江口盆地中新生代主要断裂特征和动力背景分析[J]. 热带海洋学报, 24(2): 52-61.
|
| [2] |
陈梅, 施小斌, 刘凯, 等, 2017. 南海北缘珠三坳陷新生代构造沉降特征[J]. 海洋地质与第四纪地质, 37(6): 47-56.
|
| [3] |
崔涛, 解习农, 任建业, 等, 2008. 莺歌海盆地异常裂后沉降的动力学机制[J]. 地球科学, 33(3): 349-356.
|
| [4] |
郝天珧, 徐亚, 孙福利, 等, 2011. 南海共轭大陆边缘构造属性的综合地球物理研究[J]. 地球物理学报, 54(12): 3098-3116.
|
| [5] |
焦养泉, 李思田, 解习农, 等, 1997. 多幕裂陷作用的表现形式——以珠江口盆地西部及其外围地区为例[J]. 石油实验地质, 19(3): 222-227.
|
| [6] |
雷超, 任建业, 佟殿君, 2013. 南海北部洋陆转换带盆地发育动力学机制[J]. 地球物理学报, 56(4): 1287-1299.
|
| [7] |
李昌年, 王方正, 钟称生, 2005. 广西北海涠洲岛(含斜阳岛)第四纪玄武质火山岩的地球化学性质及其源区特征[J]. 岩石矿物学杂志, 24(1): 1-11.
|
| [8] |
李三忠, 索艳慧, 李玺瑶, 等, 2018. 西太平洋中生代板块俯冲过程与东亚洋陆过渡带构造-岩浆响应[J]. 科学通报, 63(16): 1550-1593.
|
| [9] |
林畅松, 张燕梅, 1999. 盆地的形成和充填过程模拟——以拉伸盆地为例[J]. 地学前缘, 6(B05): 139-146.
|
| [10] |
刘明辉, 梅廉夫, 杨亚娟, 等, 2015. 珠江口盆地惠州凹陷北部裂陷期与拗陷期沉降作用时空差异及主控因素[J]. 地球科学与环境学报, 37(2): 31-43.
|
| [11] |
刘少峰, 2009. 大陆边缘动力沉降及其深部构造作用控制[J]. 地质科学, 44(4): 1199-1212.
|
| [12] |
马明, 漆家福, 张远泽, 等, 2019. 珠江口盆地新生代沉降特征及其影响因素分析[J]. 中国地质, 46(2): 269-289.
|
| [13] |
毛云华, 赵中贤, 孙珍, 2020. 珠江口盆地西部陆缘伸展-减薄机制[J]. 地球科学, 45(5): 1622-1635.
|
| [14] |
庞雄, 任建业, 郑金云, 等, 2018. 陆缘地壳强烈拆离薄化作用下的油气地质特征——以南海北部陆缘深水区白云凹陷为例[J]. 石油勘探与开发, 45(1): 27-39.
|
| [15] |
任建业, 雷超, 2011. 莺歌海-琼东南盆地构造-地层格架及南海动力变形分区[J]. 地球物理学报, 54(12): 3303-3314.
|
| [16] |
任建业, 庞雄, 于鹏, 等, 2018. 南海北部陆缘深水-超深水盆地成因机制分析[J]. 地球物理学报, 61(12): 4901-4920.
|
| [17] |
佟殿君, 任建业, 雷超, 等, 2009. 琼东南盆地深水区岩石圈伸展模式及其对裂后期沉降的控制[J]. 地球科学, 34(6): 963-974.
|
| [18] |
王贤觉, 吴明清, 梁德华, 等, 1984. 南海玄武岩的某些地球化学特征[J]. 地球化学, (4): 42-50.
|
| [19] |
卫小冬, 阮爱国, 赵明辉, 2011. 穿越东沙隆起和潮汕坳陷的OBS广角地震剖面[J]. 地球物理学报, 54(12): 3325-3335.
|
| [20] |
吴能友, 曾维军, 宋海斌, 等, 2003. 南海区域构造沉降特征[J]. 海洋地质与第四纪地质, 23(1): 55-65.
|
| [21] |
吴时国, 孙启良, 吴拓宇, 等, 2009. 琼东南盆地深水区多边形断层的发现及其油气意义[J]. 石油学报, 30(1): 22-32.
|
| [22] |
徐义刚, 魏静娴, 邱华宁, 等, 2012. 用火山岩制约南海的形成演化:初步认识与研究设想[J]. 科学通报, 57(20): 1863-1878.
|
| [23] |
鄢全树, 石学法, 2007. 海南地幔柱与南海形成演化[J]. 高校地质学报, 13(2): 311-322.
|
| [24] |
鄢全树, 石学法, 王昆山, 等, 2008. 南海新生代碱性玄武岩主量、微量元素及Sr-Nd-Pb同位素研究[J]. 中国科学:地球科学, 38(1): 56-71.
|
| [25] |
杨军, 施小斌, 王振峰, 等, 2015. 琼东南盆地张裂期沉降亏损与裂后期快速沉降成因[J]. 海洋地质与第四纪地质, 35(1): 81-90.
|
| [26] |
易海, 张莉, 林珍, 2012. 南海北部中生代构造格局与盆地发育特征[J]. 石油实验地质, 34(4): 388-394.
|
| [27] |
袁玉松, 杨树春, 胡圣标, 等, 2008. 琼东南盆地构造沉降史及其主控因素[J]. 地球物理学报, 51(2): 376-383.
|
| [28] |
张云帆, 孙珍, 周蒂, 等, 2007. 南海北部陆缘新生代地壳减薄特征及其动力学意义[J]. 中国科学, 37(12): 1609-1616.
|
| [29] |
赵中贤, 孙珍, 谢辉, 等, 2011. 白云深水区新生代沉降及岩石圈伸展变形[J]. 地球物理学报, 54(12): 3336-3343.
|
| [30] |
赵中贤, 周蒂, 廖杰, 2009. 珠江口盆地第三纪古地理及沉积演化[J]. 热带海洋学报, 28(6): 52-60.
|
| [31] |
赵中贤, 周蒂, 廖杰, 等, 2010. 珠江口盆地陆架区岩石圈伸展模拟及裂后沉降分析[J]. 地质学报, 84(8): 1135-1145.
|
| [32] |
邹和平, 李平鲁, 饶春涛, 1995. 珠江口盆地新生代火山岩地球化学特征及其动力学意义[J]. 地球化学, 24: 33-45.
|
| [33] |
|
| [34] |
|
| [35] |
|
| [36] |
|
| [37] |
|
| [38] |
|
| [39] |
|
| [40] |
|
| [41] |
|
| [42] |
|
| [43] |
|
| [44] |
|
| [45] |
|
| [46] |
|
| [47] |
|
| [48] |
|
| [49] |
|
| [50] |
|
| [51] |
|
| [52] |
|
| [53] |
|
| [54] |
|
| [55] |
|
| [56] |
|
| [57] |
|
| [58] |
|
| [59] |
|
| [60] |
|
| [61] |
|
| [62] |
|
| [63] |
|
| [64] |
|
| [65] |
|
| [66] |
|
| [67] |
|
| [68] |
|
| [69] |
|
| [70] |
|
| [71] |
|
| [72] |
|
| [73] |
|
| [74] |
|
| [75] |
|
| [76] |
|
| [77] |
|
| [78] |
|
| [79] |
|
| [80] |
|
| [81] |
|
| [82] |
|
| [83] |
|
| [84] |
|
| [85] |
|
| [86] |
|
| [87] |
|
| [88] |
|
| [89] |
|
| [90] |
|
| [91] |
|
| [92] |
|
| [93] |
|
| [94] |
|
| [95] |
|
| [96] |
|
| [97] |
|
| [98] |
|
| [99] |
|
| [100] |
|
| [101] |
|
| [102] |
|
| [103] |
|
| [104] |
|
| [105] |
|
| [106] |
|
| [107] |
|
| [108] |
|
| [109] |
|
| [110] |
|
| [111] |
|
| [112] |
|
/
| 〈 |
|
〉 |

