
环境DNA分析大亚湾夜光藻藻华对真核浮游生物群落的影响*
|
陈靖夫(1996—), 男, 硕士, 从事浮游植物研究。email: |
Copy editor: 殷波
收稿日期: 2022-01-10
修回日期: 2022-04-05
网络出版日期: 2022-09-30
基金资助
国家自然科学基金(41776154)
广州海洋实验室2019年度人才团队引进项目(GML2019ZD0405)
Noctiluca scintillans effects on eukaryotic plankton community structure using Environmental DNA analysis in Daya Bay*
Copy editor: YIN Bo
Received date: 2022-01-10
Revised date: 2022-04-05
Online published: 2022-09-30
Supported by
National Natural Science Foundation of China(41776154)
Key Special Project for Introduced Talents Team of Southern Marine Science and Engineering Guangdong Laboratory(GML2019ZD0405)
夜光藻是全球广泛分布的藻华种之一, 其摄食作用对浮游生物的群落结构有着重要影响。利用环境DNA技术和Spearman相关性分析, 文章研究了2021年1月中旬大亚湾夜光藻高丰度站位浮游生物的群落结构与生物相关性。结果显示, 夜光藻高丰度站位的海水温盐条件为温度 14.4~18.3℃、盐度 32.52‰~33.14‰。夜光藻丰度较高的站位中, 卡顿藻科、海链藻科等浮游植物类群的相对丰度均值为2.41%和2.23%, 明显高于其他站位的0.75%和0.62%; 同时拟哲水蚤科与长腹剑水蚤科等类群的相对丰度均值为8.22%和4.46%, 明显低于其他站位的64.13%和11.12%。结合Spearman相关性分析表明, 夜光藻丰度增加可能导致其对拟哲水蚤科等类群摄食压力增加, 拟哲水蚤科类群丰度减少降低了卡顿藻科、海链藻科、原甲藻科、隐芽藻科等浮游植物类群的摄食压力, 使其生物丰度增加; 同时夜光藻摄食压力增加使得裸甲藻科、圆筛藻科等浮游植物丰度下降。因此, 夜光藻丰度增加影响了水域中真核浮游生物群落结构。综上结果表明, 环境DNA技术有助于认识夜光藻在浮游生物群落中的生态地位, 可用于浮游生物各类群之间的关系分析。
陈靖夫 , 钟瑜 , 王磊 , 郭雨沛 , 邱大俊 . 环境DNA分析大亚湾夜光藻藻华对真核浮游生物群落的影响*[J]. 热带海洋学报, 2022 , 41(5) : 121 -132 . DOI: 10.11978/2022005
Noctiluca scintillans is a key blooms species and widely distributed throughout the world. Previous studies indicated that the plankton community was strongly influenced by the predation of N. scintillans. In this study, eukaryotic plankton community and biological correlation in the Daya Bay were analyzed using environmental DNA technology and Spearman correlate analysis in January 2021. The temperature and salinity of surface sea water were 14.4 ~ 18.3 ℃ and 32.52 ‰ ~ 33.14 ‰, respectively. In the stations with high N. scintillans abundance, the relative abundance of phytoplankton, such as Chattonellaceae and Thalassiosiraceae were 2.41 % and 2.23 %, which is significantly higher than the average values of 0.75 % and 0.62 % at other stations, respectively. While the relative abundances of Paracalanidae and Oithonidae were 8.22 % and 4.46 % at high N. scintillans abundance stations, which is significantly lower than the average value of 64.13 % and 11.12 % at other stations, respectively. These results indicated that N. scintillans reduced the top-down control of Paracalanidae on phytoplankton including Chattonellaceae, Thalassiosiraceae, Prorocentraceae and Geminigeraceae which led to an increase in the abundance of some plankton species in the blooms areas. Meanwhile, Gymnodiniaceae and Stephanopyxidaceae were fed by N. scintillans, which directly affected the community abundance of phytoplankton. Our analysis suggests that eDNA technology provides the methodological basis for understanding the ecological niche of N. scintillans, which would ultimately contribute to understanding the occurrence of blooms strategies.
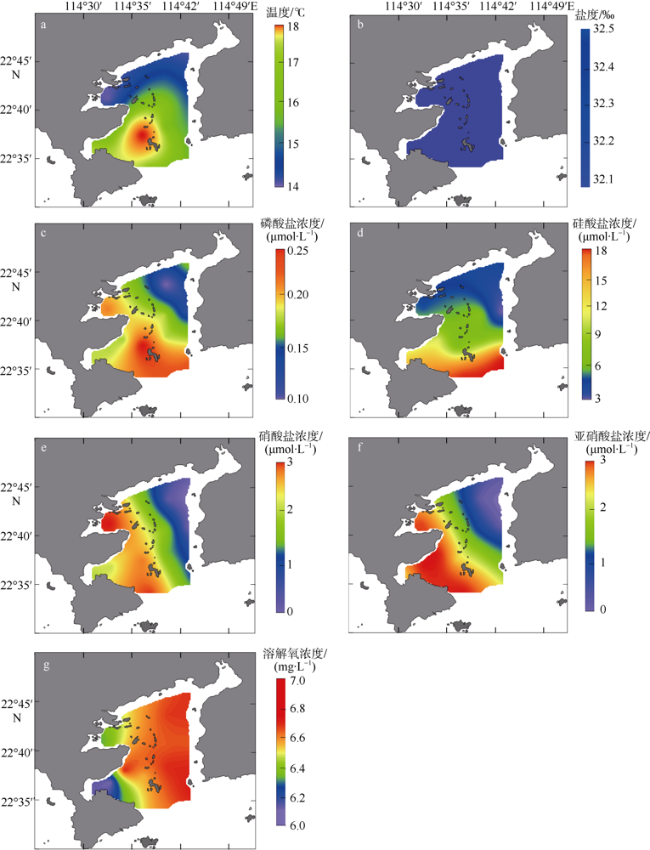
图2 大亚湾环境因子空间分布a. 温度; b. 盐度; c. 磷酸盐浓度; d. 硅酸盐浓度; e. 硝酸盐浓度; f. 亚硝酸盐浓度; g. 溶解氧浓度。审图号为GS(2019)4342 Fig. 2 Distribution of physical and chemical data collected in the Daya Bay. (a) temperature; (b) salinity; (c) orthophosphate (PO43-); (d) dissolved silicate (SiO44-); (e) nitrate (NO3-); (f) nitrite (NO2-); (g) dissolved oxygen (DO) |
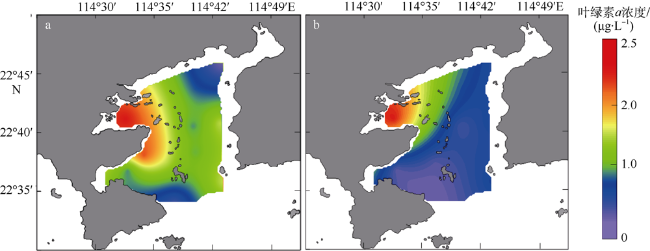
图4 大亚湾各站位(S1~S12)环境DNA样品扩增真核生物的稀释曲线图a. 为粒径≥3µm环境DNA样品; b. 为粒径0.2~3µm环境DNA样品 Fig. 4 Rarefaction curves of eDNA sampling of eukaryotes in the Daya Bay. (a) size ≥ 3 µm; (b) size is 0.2 ~ 3 µm |
表1 大亚湾浮游生物群落高通量测序结果Tab. 1 Summary of the high-throughput sequencing reads of eDNA in the Daya Bay |
| 站位 | 原始序列数 | 有效序列数 | 有效比 | OTUs数 |
|---|---|---|---|---|
| S1≥3µm | 85852 | 83035 | 96.72 | 451 |
| S1-pico | 86846 | 82146 | 94.59 | 662 |
| S2≥3µm | 86414 | 83728 | 96.89 | 252 |
| S2-pico | 80261 | 76850 | 95.75 | 930 |
| S3≥3µm | 87818 | 84321 | 96.02 | 164 |
| S3-pico | 85984 | 82880 | 96.39 | 464 |
| S4≥3µm | 82743 | 79504 | 96.09 | 340 |
| S4-pico | 85679 | 82797 | 96.64 | 474 |
| S5≥3µm | 87153 | 84519 | 96.98 | 212 |
| S5-pico | 87939 | 84033 | 95.56 | 509 |
| S6≥3µm | 83419 | 80163 | 96.10 | 251 |
| S6-pico | 85651 | 82202 | 95.97 | 582 |
| S7≥3µm | 86571 | 83124 | 96.02 | 398 |
| S7-pico | 82757 | 80002 | 96.67 | 253 |
| 站位 | 原始序列数 | 有效序列数 | 有效比 | OTUs数 |
| S8≥3µm | 80444 | 77315 | 96.11 | 397 |
| S8-pico | 81353 | 76092 | 93.53 | 799 |
| S9≥3µm | 80922 | 77302 | 95.53 | 638 |
| S9-pico | 81500 | 78682 | 96.54 | 345 |
| S10≥3µm. | 87029 | 83148 | 95.54 | 618 |
| S10-pico | 82076 | 77528 | 94.46 | 619 |
| S11≥3µm | 82660 | 79646 | 96.35 | 223 |
| S11-pico | 85237 | 81181 | 95.24 | 527 |
| S12≥3µm | 85806 | 82684 | 96.36 | 212 |
| S12-pico | 86122 | 81857 | 95.05 | 624 |
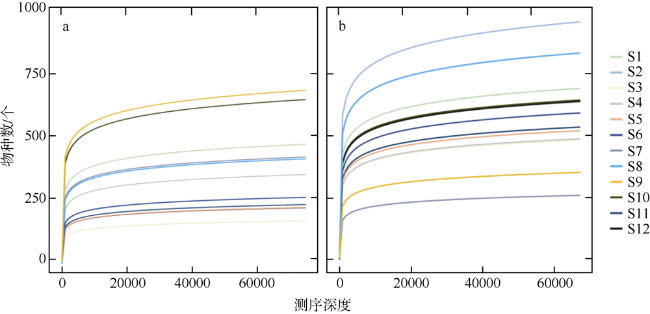
图5 真核浮游生物群落丰度图a、c、e、g为粒径≥3µm环境DNA样品中真核浮游生物在不同分类阶元丰度图; b、d、f、h 为粒径0.2~3µm环境DNA样品中真核浮游生物在不同分类阶元丰度图。a、b为真核生物; c、d为纲水平; e、f为目水平; g、h为科水平 Fig. 5 The relative abundance of eukaryotes at different taxonomic levels. (a, c, e, g) showing eukaryotes relative abundance (eukaryote, class, order, family) in ≥ 3 µm sizes eDNA samples, respectively; (b, d, f, h) showing eukaryotes relative abundance (eukaryote, class, order, family) in 0.2 ~ 3 µm sizes eDNA samples, respectively |
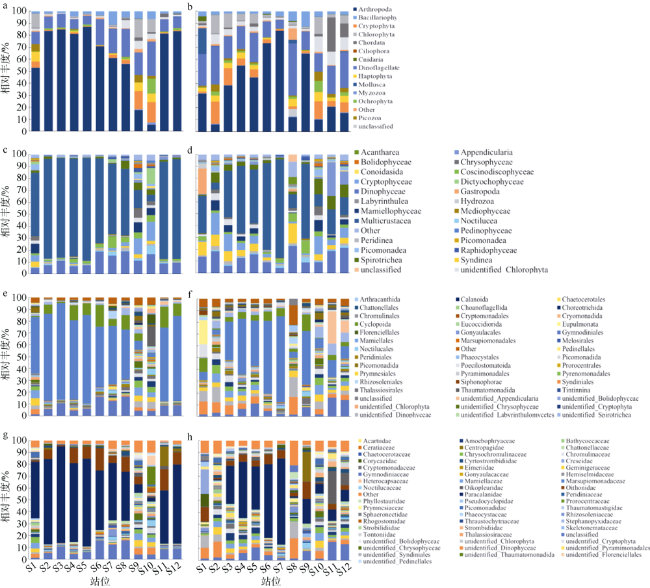
图6 浮游植物群落丰度图a、c、e、g为环境DNA中粒径≥3µm真核浮游植物在不同分类阶元的丰度图; b、d、f、h为环境DNA中粒径0.2~3µm真核浮游植物在不同分类阶元的丰度图。a、b为真核生物; c、d为纲水平; e、f为目水平; g、h为科水平 Fig. 6 Relative abundance of phytoplankton at different taxonomic levels. (a, c, e, g) showing the phytoplankton relative abundance (eukaryote, class, order, family) in ≥ 3 µm sizes eDNA samples, respectively; (b, d, f, h) showing the phytoplankton relative abundance (eukaryote, class, order, family) in 0.2 ~ 3 µm sizes eDNA samples, respectively |
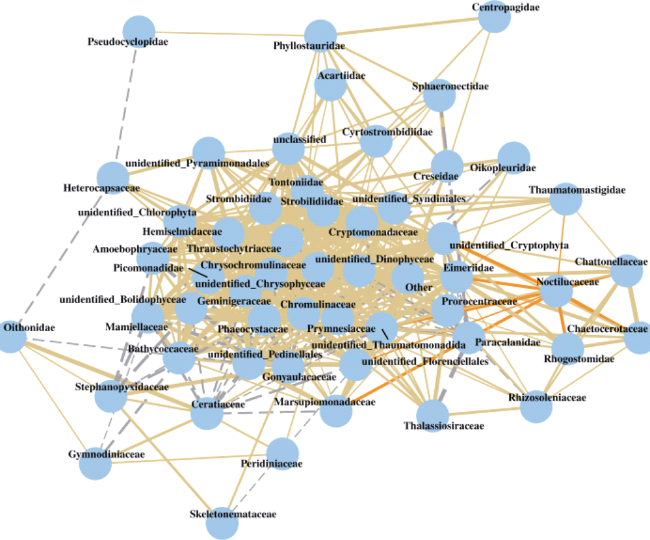
图7 浮游生物群落网络关系图黄色实线表示正相关关系, 橙色实线表示与夜光藻呈正相关关系, 灰色虚线表示负相关关系, 线的粗细代表关系的强弱程度 Fig. 7 Network of plankton community. Yellow solid line means positive correlation; Orange solid line means positive correlation to N. scintillans; Grey dotted line means negative correlation; thickness of the line represents the strength of the relationship |
| [1] |
陈汉辉, 杞桑, 1991. 夜光藻摄食和营养繁殖的昼夜节律[J]. 暨南大学学报, 12(3): 104-111.
|
| [2] |
郭雨沛, 2021. 大亚湾真核浮游植物基因多样性的季节变化及其扩增引物的比较分析[D]. 北京: 中国科学院大学.
|
| [3] |
华泽爱, 1994. 赤潮灾害[M]. 北京: 海洋出版社:10-12.
|
| [4] |
马婕, 2019. 大亚湾浮游动物主要功能群的摄食及其对环境变化的响应[D]. 上海: 上海海洋大学.
|
| [5] |
齐雨藻, 邹景忠, 梁松, 等, 2003. 中国沿海赤潮[M]. 北京: 科学出版社: 208-220. (in Chinese)
|
| [6] |
孙东, 赵冬至, 文世勇, 等, 2010. 夜光藻赤潮与环境因子关系的模糊分析[J]. 海洋环境科学, 29(1): 70-75.
SUNDONG,
|
| [7] |
孙振宇, 陈照章, 杨龙奇, 等, 2020. 大亚湾及周边海区潮流和余流的季节变化特征[J]. 厦门大学学报(自然科学版), 59(2): 278-286.
|
| [8] |
万艳, 2020. 适宜平潭海域夜光藻赤潮发生的水温和气象条件统计分析[J]. 海洋预报, 37(6): 65-73.
|
| [9] |
王友绍, 王肇鼎, 黄良民, 2004. 近20年来大亚湾生态环境的变化及其发展趋势[J]. 热带海洋学报, 23(5): 85-95.
|
| [10] |
吴瑞贞, 林端, 马毅, 2007. 南海夜光藻赤潮概况及其对水文气象的适应条件[J]. 台湾海峡, 26(4): 590-595.
|
| [11] |
郑炳锋, 刘炜明, 2010. 福州近海海域赤潮灾害及预警管理[J]. 中国水产, (5): 17-19. (in Chinese)
|
| [12] |
朱艾嘉, 黄良民, 许战洲, 2008. 氮、磷对大亚湾大鹏澳海区浮游植物群落的影响: Ⅰ. 叶绿素a与初级生产力[J]. 热带海洋学报, 27(1): 38-45.
|
| [13] |
朱艾嘉, 黄良民, 林秋艳, 等, 2009. 氮、磷对大亚湾大鹏澳海区浮游植物群落的影响: Ⅱ. 种类组成[J]. 热带海洋学报, 28(6): 103-111.
|
| [14] |
|
| [15] |
|
| [16] |
|
| [17] |
|
| [18] |
|
| [19] |
|
| [20] |
|
| [21] |
|
| [22] |
|
| [23] |
|
| [24] |
|
| [25] |
|
| [26] |
|
| [27] |
|
| [28] |
|
| [29] |
|
| [30] |
|
| [31] |
|
| [32] |
|
| [33] |
|
| [34] |
|
/
| 〈 |
|
〉 |


