
AMO对ENSO与初夏西太平洋海洋热浪年际关系的年代际调制作用*
*感谢3位匿名审稿人和编辑提出宝贵的意见。
|
袁钰(1998—), 女, 新疆维吾尔自治区吉木乃县人, 硕士, 从事海气相互作用研究。email: |
Copy editor: 殷波
收稿日期: 2023-10-16
修回日期: 2023-12-14
网络出版日期: 2023-12-14
基金资助
国家自然科学基金项目(42192562)
国家自然科学基金项目(41975106)
Impact of Atlantic Multidecadal Oscillation on interannual relationship between ENSO and early summer marine heatwaves in the Western Pacific*
Received date: 2023-10-16
Revised date: 2023-12-14
Online published: 2023-12-14
Supported by
National Natural Science Foundation of China(42192562)
National Natural Science Foundation of China(41975106)
海洋热浪是发生在海洋上的极端高温事件, 对海洋环境和生态系统具有破坏性影响。文章采用1960—2020年第五代欧洲中期天气预报中心再分析资料(European centre for medium-range weather forecasts reanalysis v5, ERA5)和英国气象局哈德来中心全球海冰和海洋表面温度资料集(Hadley centre global sea ie and sea surface temperature, HadISST)以及地球系统模式(community Earth system model, CESM1)北大西洋理想试验数据等, 通过相关、合成分析等多种统计方法, 研究了厄尔尼诺-南方涛动(El Niño-Southern Oscillation, ENSO)与次年初夏西太平洋海洋热浪年际关系的变化特征, 并进一步探讨了二者关系发生年代际变化的可能成因。研究结果表明: 1) ENSO与次年初夏西太平洋海洋热浪月数的年际关系具有明显的年代际变化特征, 北大西洋多年代际振荡(Atantic multidecadal oscillation, AMO)是二者年际关系发生年代际变化的主要成因。当AMO处于正位相时, ENSO与次年初夏西太平洋海洋热浪存在显著的正相关关系, 而当AMO处于负位相时, 上述二者相关关系不再显著; 2) AMO主要通过调控ENSO事件的强度进而影响西北太平洋大气环流的异常响应, 从而进一步影响ENSO与次年初夏西太平洋海洋热浪之间的关系。当AMO处于负(正)位相时, 相对较强(弱)的ENSO事件通过强(弱)风-蒸发-海温正反馈过程, 使得ENSO事件次年初夏西北太平洋地区产生位置相对偏东(西)、强度相对偏强(弱)的异常反气旋/气旋。异常反气旋/气旋的位置和强度导致初夏西太平洋海洋热浪的分布在AMO正、负位相存在显著差异。
关键词: 初夏海洋热浪; 西太平洋; 北大西洋多年代际振荡; 厄尔尼诺-南方涛动; 西北太平洋异常气旋/反气旋
袁钰 , 徐海明 , 马静 , 张彤 . AMO对ENSO与初夏西太平洋海洋热浪年际关系的年代际调制作用*[J]. 热带海洋学报, 2024 , 43(5) : 1 -16 . DOI: 10.11978/2023150
Marine heatwaves are extreme high temperature events that occur on the oceans and have devastating impact of marine environment and ecosystems. Using the fifth generation of European centre for medium-range weather forecasts atmospheric reanalysis data (ERA5) and the Hadley Centre Global Sea Ice and Sea Surface Temperature (HadISST) dataset during the period of 1960-2020, and data from the North Atlantic idealized experiments performed with the CESM1 model, this study investigated the variation of the interannual relationship between the El Niño-Southern Oscillation (ENSO) and the following early summer marine heatwaves in the western Pacific, and the possible reasons for their decadal variation based on correlation, synthetic analysis and other statistical methods. The results are shown as follows. 1) The interdecadal relationship between the ENSO and the following early summer marine heatwaves months in the western Pacific displays a prominent decadal variation, which is modulated by the Atlantic Multidecadal Oscillation (AMO). A high correlation between the ENSO and the following early summer marine heatwaves in the western Pacific appears during the positive AMO phase, while no significant correlation is found during the negative AMO phase. 2) AMO mainly affects the response of atmospheric circulation in the Northwest Pacific by modulating ENSO amplitude, thereby affecting the relationship between the ENSO and the following early summer marine heatwaves in the western Pacific. During the negative (positive) AMO phases, the Northwest Pacific anomalous anticyclone/cyclone appears strong (weak), and its position shifts toward east (west) in the following early summer, due to the relatively strong (weak) ENSO events through strong (weak) wind-evaporation-SST positive feedback mechanism. Thus, the position and intensity of anomalous anticyclones/cyclones led to significant differences in the distribution of early summer marine heatwaves in the western Pacific between the positive and negative AMO phase.
表1 1960—2020年厄尔尼诺事件和拉尼娜事件Tab. 1 El Niño and La Niña events during 1960-2020 |
| ENSO事件 | 年份 |
|---|---|
| 厄尔尼诺事件 | 1963/64, 1965/66, 1972/73, 1982/83, 1986/87, 1987/88, 1991/92, 1994/95, 1997/98, 2002/03, 2004/05, 2009/10, 2014/15, 2015/16, 2018/19 |
| 拉尼娜事件 | 1961/62, 1962/63, 1964/65, 1966/67, 1967/68, 1970/71, 1971/72, 1973/74, 1974/75, 1975/76, 1984/85, 1988/89, 1995/96, 1998/99, 1999/2000, 2000/01, 2007/08, 2010/11, 2011/12, 2016/17, 2017/18 |
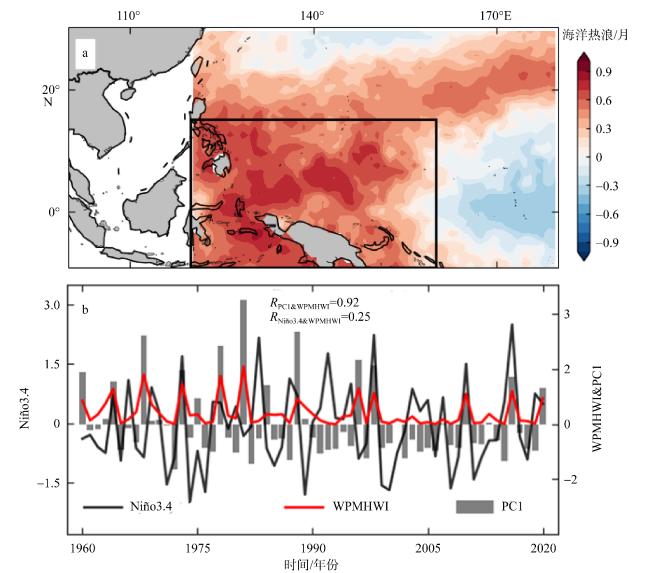
图1 1960—2020年初夏西太平洋海洋热浪月数第一模态空间分布(a)和PC1、初夏WPMHWI与前冬Niño3.4指数的时间序列(b)图a黑框区域表征西太平洋海洋热浪指数的计算范围。审图号: GS(2016)1561 Fig. 1 Spatial pattern of the first mode of the early summer marine heatwaves months in the western Pacific during 1960-2020 (a) and time series of PC1 (grey bar), early summer WPMHWI (red line) and Niño3.4 index in the preceding winter (black line) (b). The black box in (a) indicates the calculation range of the marine heatwaves index in the western Pacific |
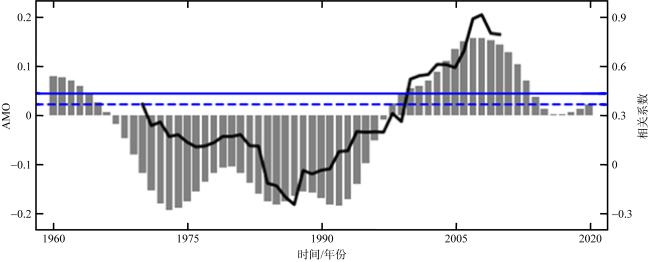
图2 前冬Niño3.4指数与初夏WPMHWI的21a滑动相关系数和AMO指数的时间序列图中黑色实线为前冬Niño3.4指数与初夏WPMHWI的21a滑动相关系数, 灰色直方条为AMO指数, 蓝色实线为95%信度水平的显著性检验线, 蓝色虚线为90%信度水平的显著性检验线 Fig. 2 Time series of 21-year sliding correlation coefficient (solid black line) between Niño3.4 index in the preceding winter and early summer WPMHWI, together with AMO index (grey bar). The solid blue line indicates the 95% significance level, and the dashed blue line indicates the 90% significance level |
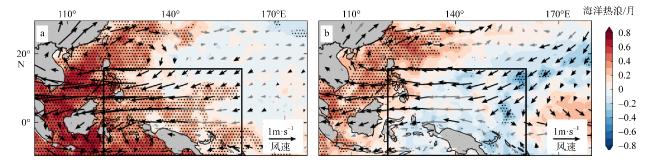
图3 回归到1998—2018年(a)和1974—1997年(b)前冬Niño3.4指数的初夏西太平洋海洋热浪月数和850hPa风异常场黑框表征西太平洋海洋热浪指数的计算范围; 打点区表示通过90%显著性检验区域, 深黑色箭头为通过90%显著性检验风场。审图号: GS(2016)1561 Fig. 3 Regressed marine heatwaves (unit: months) and 850 hPa anomaly winds (unit: m·s-1) in early summer upon the preceding winter Niño3.4 index during 1998-2018 (a) and 1974-1997 (b). The black box indicates the calculation range of the marine heatwaves index in the western Pacific. Stippling and bold arrow indicates the anomalous field passes the 90% confidence test |
表2 不同AMO位相下厄尔尼诺事件和拉尼娜事件Tab. 2 El Niño and La Niña events in different AMO phases |
| 厄尔尼诺事件年份 | 拉尼娜事件年份 | |
|---|---|---|
| AMO+ | 1963/64, 1965/66, 1997/98, 2002/03, 2004/05, 2009/10, 2014/15, 2015/16, 2018/19 | 1961/62, 1962/63, 1964/65, 1998/99, 1999/2000, 2000/01, 2007/08, 2010/11, 2011/12, 2016/17, 2017/18 |
| AMO- | 1972/73, 1982/83, 1986/87, 1987/88, 1991/92, 1994/95 | 1966/67, 1967/68, 1970/71, 1971/72, 1973/74, 1974/75, 1975/76, 1984/85, 1988/89, 1995/96 |
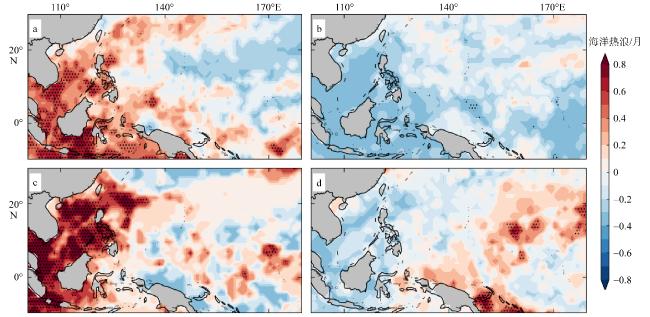
图4 AMO+/厄尔尼诺事件(a)、AMO+/拉尼娜事件(b)、AMO-/厄尔尼诺事件(c)以及AMO-/拉尼娜事件(d)次年初夏西太平洋海洋热浪月数异常合成场图中打点区表示通过90%显著性检验区域 Fig. 4 Composites of marine heatwaves (unit: months) for AMO+/El Niño (a), AMO+/La Niña (b), AMO-/El Niño (c) and AMO-/La Niña (d) in the following early summer. Stippling indicates the anomalous field passes the 90% confidence test |
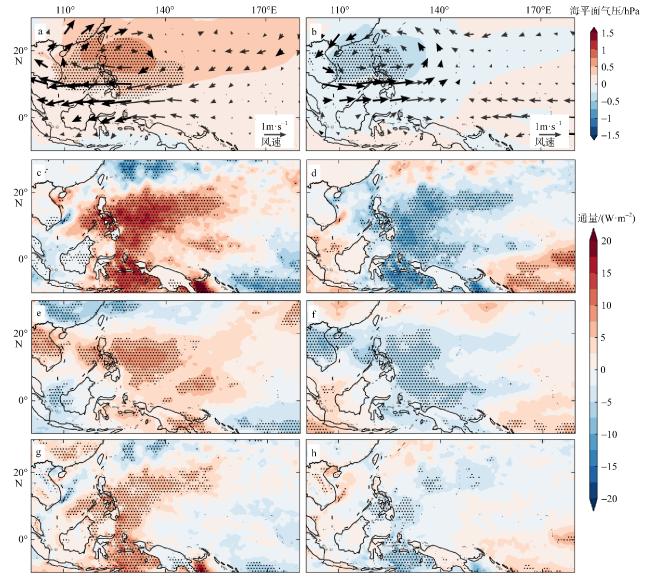
图5 AMO正位相期间, 厄尔尼诺(a、c、e、g)和拉尼娜(b、d、f、h)次年初夏西太平洋海平面气压和850hPa风场(a、b)、海表净热通量(c、d)、短波辐射通量(e、f)以及潜热通量(g、h)异常合成场图a中加粗箭头为通过90%显著性检验风场; 图b中通量向下为正, 打点区表示通过90%显著性检验区域。审图号: GS(2016)1561 Fig. 5 Composites of anomalous sea-level pressure (unit: hPa) and 850 hPa winds (unit: m·s-1) (a, b), sea surface net heat flux (c, d), shortwave radiation (e, f), and latent heat flux (unit: W·m-2) (g, h) for El Niño (a, c, e, g) and La Niña (b, d, f, h) events in the following early summer during positive AMO phase. The flux downward is positive, stippling and bold arrow indicates the anomalous field passes the 90% confidence test |
图6 AMO负位相期间, 厄尔尼诺(a、c、e、g)和拉尼娜(b、d、f、h)次年初夏西太平洋海平面气压和850hPa风场(a、b)、海表净热通量(c、d)、短波辐射通量(e、f)以及潜热通量(g、h)异常合成场图a中加粗箭头为通过90%显著性检验风场; 图b中通量向下为正, 打点区表示通过90%显著性检验区域。审图号: GS(2016)1561 Fig. 6 Composites of anomalous sea-level pressure (unit: hPa) and 850 hPa winds (unit: m·s-1) (a, b), sea surface net heat flux (c, d), shortwave radiation (e, f), and latent heat flux (unit: W·m-2) (g, h) for El Niño (a, c, e, g) and La Niña (b, d, f, h) events in the following early summer during negative AMO phase. The flux downward is positive, stippling and bold arrow indicates the anomalous field passes the 90% confidence test |
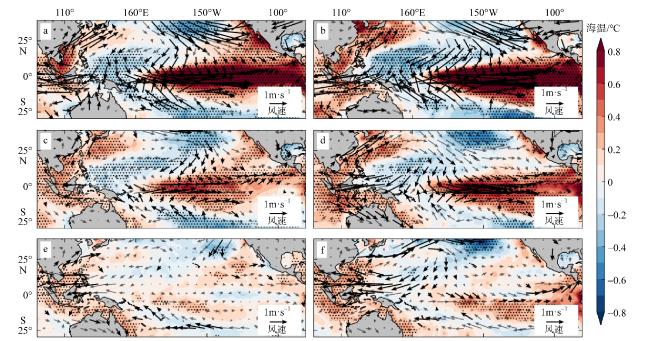
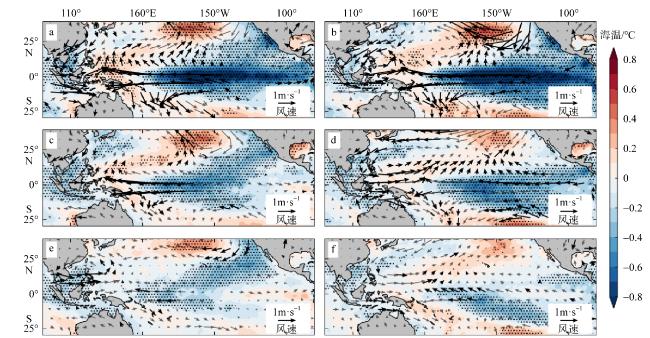
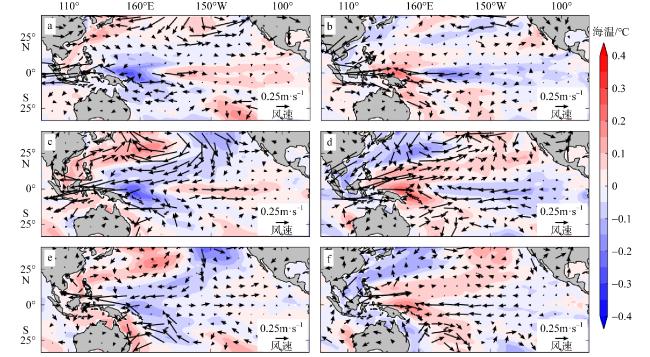
图7 AMO正位相(a、c、e)和AMO负位相(b、d、f)期间, 厄尔尼诺事件海温和850hPa风异常合成场的季节演变a、b: 冬季; c、d: 次年春季; e、f: 次年初夏。打点区表示通过90%显著性检验区域, 加粗箭头为通过90%显著性检验风场。审图号: GS(2016)1561 Fig. 7 Seasonal evolution of composited anomalous sea surface temperature (unit: ℃) and 850 hPa winds (unit: m·s-1) for El Niño events in winter (a, b), the following spring (c, d), and the following early summer (e, f) during positive (a, c, e) and negative (b, d, f) AMO phases. Stippling and bold arrow indicates the anomalous field passes the 90% confidence test |
图8 AMO正位相(a、c、e)和AMO负位相(b、d、f)期间, 拉尼娜事件海温和850hPa风异常合成场的季节演变a、b: 冬季; c、d: 次年春季; e、f: 次年初夏。打点区表示通过90%显著性检验区域, 加粗箭头为通过90%显著性检验风场。审图号: GS(2016)1561 Fig. 8 Seasonal evolution of composited anomalous sea surface temperature (unit: ℃) and 850 hPa winds (unit: m·s-1) for La Niña events in winter (a, b), the following spring (c, d), and the following early summer (e, f) during positive (a, c, e) and negative (b, d, f) AMO phases. Stippling and bold arrow indicates the anomalous field passes the 90% confidence test |
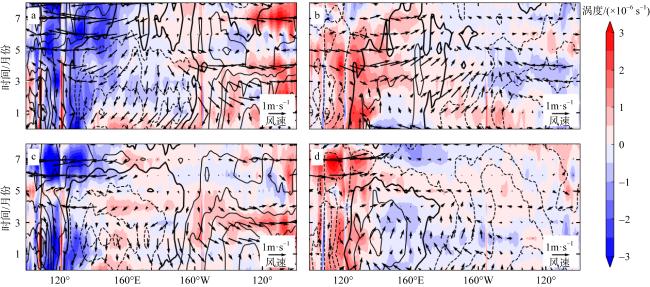
图9 AMO负位相(a、b)和AMO正位相(c、d)期间, 厄尔尼诺事件(a、c)和拉尼娜事件(b、d)冬季到次年夏季10°—20°N平均涡度、5°—15°N平均海温和平均850hPa风的经向-时间异常合成图等值线为以0.1℃为间隔的海温值, 实线为正值, 虚线为负值; 黑色箭头代表850hPa风场 Fig. 9 Composite longitude-time sections of anomalous vorticity (shading; unit: ×10-6s-1) averaged over 10°-20°N, sea surface temperature (contour at an interval of 0.1 ℃) and 850 hPa winds (vector; unit: m·s-1) averaged over 5°-15°N for El Niño (a, c) and La Niña (b, d) events from winter to the following early summer during negative (a, b) and positive (c, d) AMO phases. The solid line is positive, and the dashed line is negative |
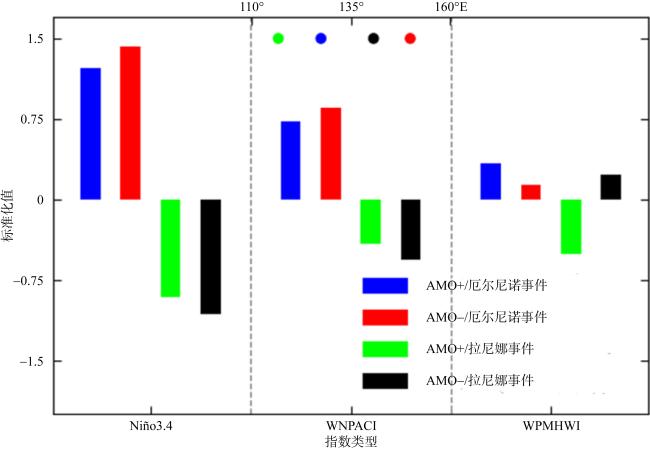
图10 AMO+/厄尔尼诺事件(蓝)、AMO-/厄尔尼诺事件(红)、AMO+/拉尼娜事件(绿)和AMO−/拉尼娜事件(黑)标准化前冬Niño3.4指数、初夏WNPACI以及WPMHWI的合成图散点代表西北太平洋异常反气旋/气旋中心的经度; 虚线为各指数之间的分隔线 Fig. 10 Composites of the preceding winter Niño3.4 index, early summer WNPACI and WPMHWI for AMO+/El Niño (blue), AMO+/La Niña (green), AMO-/El Niño (red) and AMO-/La Niña (black). The scatter represents the longitude of the center of the Northwest Pacific anomalous anticyclone/cyclone |
图11 厄尔尼诺(a、c、e)和拉尼娜事件(b、d、f)合成的海温和850hPa风场在负位相AMO试验与正位相AMO试验之间的差值随季节的演变a、b: 冬季; c、d: 次年春季; e、f: 次年初夏。审图号: GS(2016)1561 Fig. 11 Simulated differences of composites of sea surface temperature (unit: ℃) and 850 hPa winds (unit: m·s-1) for El Niño (a, c, e) and La Niña events (b, d, f) in winter (a, b), the following spring (c, d), and early summer (e, f) between negative and positive AMO phase experiment changes with the seasons |
图12 AMO通过调节ENSO强度影响西北太平洋大气环流异常响应的示意图a. AMO−/厄尔尼诺事件; b. AMO−/拉尼娜事件; c. AMO+/厄尔尼诺事件; d. AMO+/拉尼娜事件。图中“AC”和“C”分别代表反气旋和气旋; 红色和蓝色阴影分别代表海温暖异常和冷异常, 颜色越深代表强度越强; 空心箭头为850hPa异常风, 箭头越粗代表异常风越强; 红色菱形代表初夏海洋热浪多少, 个数越多代表海洋热浪越多。审图号: GS(2016)1561 Fig. 12 Schematic diagram of air-sea interactions for AMO−/El Niño (a), AMO−/La Niña (b), AMO+/El Niño (c) and AMO+/La Niña (d). The marker “AC” and “C” represents anticyclone and cyclone, respectively. Red shade and blue shade represent warm and cold anomalies, respectively, and the darker shading suggests that the sea temperature anomalies are relatively stronger. The black hollow arrows represent the 850 hPa wind anomalies, the thicker arrows suggests that the wind anomalies are relatively stronger, and the diamond represents the number of marine heatwaves in early summer, with more numbers indicating more marine heatwaves |
| [1] |
胡石建, 李诗翰, 2022. 海洋热浪研究进展与展望[J]. 地球科学进展, 37(1): 51-64.
|
| [2] |
缪予晴, 徐海明, 刘佳伟, 2021. 西北太平洋夏季海洋热浪的变化特征及海气关系[J]. 热带海洋学报, 40(1): 31-43.
|
| [3] |
唐颢苏, 胡开明, 黄刚, 2019. El Niño衰退年夏季西北太平洋异常反气旋季节内演变特征及其机制[J]. 气候与环境研究, 24(4): 525-536.
|
| [4] |
王爱梅, 王慧, 范文静, 等, 2021. 2019年中国近海海洋热浪特征研究[J]. 海洋学报, 43(6): 35-44.
|
| [5] |
|
| [6] |
|
| [7] |
|
| [8] |
|
| [9] |
|
| [10] |
|
| [11] |
|
| [12] |
|
| [13] |
|
| [14] |
|
| [15] |
|
| [16] |
|
| [17] |
|
| [18] |
|
| [19] |
|
| [20] |
|
| [21] |
|
| [22] |
|
| [23] |
|
| [24] |
|
| [25] |
|
| [26] |
|
| [27] |
|
| [28] |
|
| [29] |
|
| [30] |
|
| [31] |
|
| [32] |
|
| [33] |
|
| [34] |
|
| [35] |
|
| [36] |
|
| [37] |
|
| [38] |
|
| [39] |
|
| [40] |
|
| [41] |
|
| [42] |
|
| [43] |
|
| [44] |
|
| [45] |
|
| [46] |
|
| [47] |
|
| [48] |
|
| [49] |
|
| [50] |
|
| [51] |
|
| [52] |
|
| [53] |
|
| [54] |
|
| [55] |
|
| [56] |
|
| [57] |
|
| [58] |
|
| [59] |
|
| [60] |
|
| [61] |
|
| [62] |
|
| [63] |
|
| [64] |
|
| [65] |
|
| [66] |
|
| [67] |
|
| [68] |
|
/
| 〈 |
|
〉 |


