
基于GF-4卫星反演的珠江口水体表层悬浮泥沙时空变化特征*
|
陈琼(1995—), 女, 硕士研究生, 从事海洋遥感应用研究。email: |
收稿日期: 2021-03-12
修回日期: 2021-04-20
网络出版日期: 2021-04-20
基金资助
国家自然科学基金(41876207)
广东省重大团队项目(2019BT02H594)
南方海洋科学与工程广东省实验室(广州)人才团队引进重大专项(GML2019ZD0302)
Spatial-temporal variation of suspended sediment in the Pearl River Estuary retrieved from GF-4 satellite data*
Received date: 2021-03-12
Revised date: 2021-04-20
Online published: 2021-04-20
Supported by
National Natural Science Foundation of China(41876207)
Project from Government of Guangdong Province(2019BT02H594)
Key Special Project for Introduced Talents Team of Southern Marine Science and Engineering Guangdong Laboratory (Guangzhou)(GML2019 ZD0302)
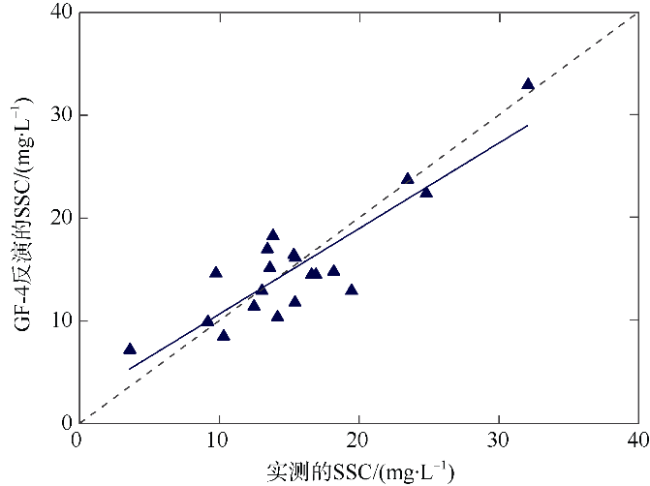
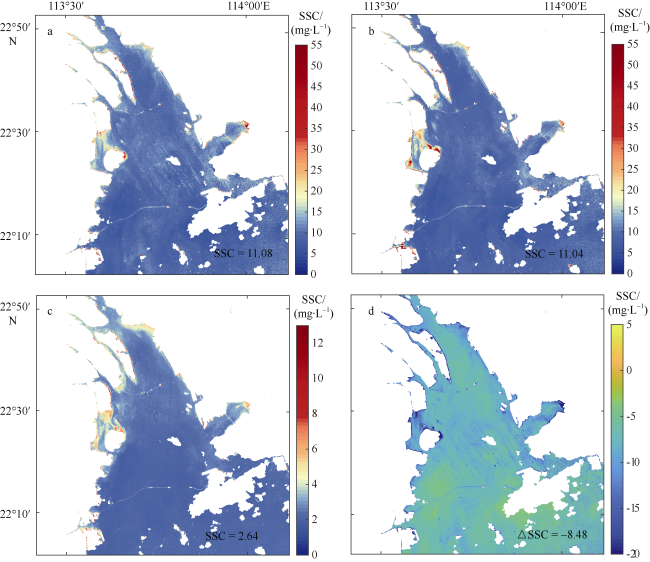
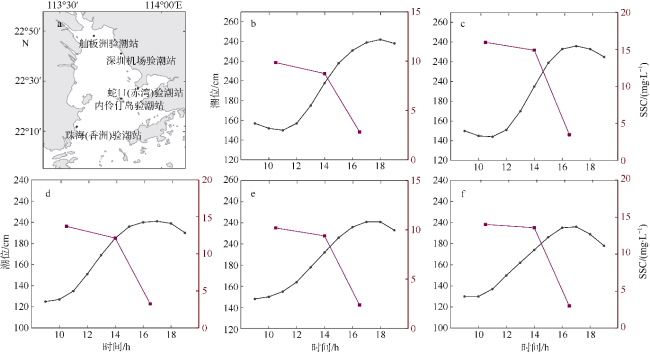
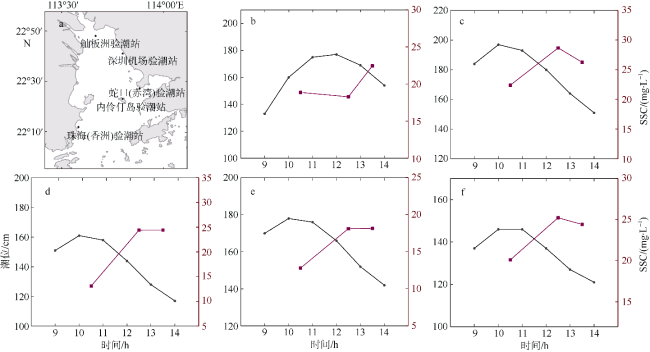
珠江口伶仃洋是中国重要的海湾之一, 其水体的悬浮泥沙质量浓度(suspended sediment concentration, SSC)在枯季受潮汐过程影响显著, 是研究潮汐对SSC变化影响的理想区域。高分四号卫星(GF-4)是我国第一颗超高时空分辨率地球同步轨道卫星, 可见光波段的空间分辨率为50m, 最大时间分辨率可达20s, 在研究一日之内的SSC变化特征方面具有独特的优势。文章利用过境珠江口伶仃洋的GF-4卫星L1A数据并结合2020年1月的航次数据, 反演得到该海域表层SSC数据, 分析得到了伶仃洋表层SSC在潮汐周期不同阶段的分布特征及变化规律。研究结果表明, 伶仃洋海域的SSC整体呈近岸高于远岸、西岸高于东岸的分布趋势。涨潮时, 共有4个高SSC分布区, 平均SSC呈降低趋势且悬沙有向湾内移动的趋势; 在停潮末—涨急—涨憩过程中, SSC先略微降低后显著降低。落潮时, 共有7个高SSC分布区, 平均SSC呈增长趋势且悬浮泥沙有向外海方向移动的趋势; 在平潮末—落急—落憩过程中, SSC先显著增大再变缓最后呈负增长趋势。SSC变化受水平方向上的挟沙作用、垂直方向上的再悬浮过程和地形的共同影响。
陈琼 , 唐世林 , 吴颉 . 基于GF-4卫星反演的珠江口水体表层悬浮泥沙时空变化特征*[J]. 热带海洋学报, 2022 , 41(2) : 65 -76 . DOI: 10.11978/2021034
Lingdingyang of the Pearl River Estuary is one of the most important bays in China. The suspended sediment concentration (SSC) there is significantly affected by the tidal processes in the dry season, which makes it an ideal area for studying the influence of tides on SSC variation. The Gaofen-4 (GF-4) satellite is the first geosynchronous orbit satellite with ultra-high spatial and temporal resolution in China. The spatial resolution of visible light bands is 50 m, and the maximum temporal resolution can reach 20 s. It has unique advantages in studying the variation of SSC within one day. In this study, we retrieved the surface SSC of Lingdingyang from the GF-4 satellite L1A data and in-situ data in January 2020, and then analyzed the spatial distribution of SSC in different stages of a tidal cycle. The results showed that the SSC in Lingdingyang was higher nearshore than offshore, and higher in the west than in the east. At flood tide, there were four high SSC areas. The average SSC showed a decreasing trend, and the suspended sediment was transported to the bay. During the initial, middle and last stages of flood tide, the decreased SSC became gradually more significant. At ebb tide, there were seven high SSC areas. The average SSC showed an increasing trend, and the suspended sediment moved toward the sea. During the initial, middle and last stages of ebb tide, the SSC increased significantly first, and then slowed down; it finally showed a negative growth trend. The variation of SSC was jointly affected by sediment transport in the horizontal direction, resuspension process in the vertical direction, and topography.
表1 GF-4卫星有效载荷Tab. 1 Payload parameters of GF-4 |
| 参数名称 | 波段号 | 波段范围/μm | 空间分辨率/m | 幅宽/km | 重访时间/s |
|---|---|---|---|---|---|
| 可见光近红外(VNIR) | 1 | 0.45~0.90 | 50 | 400 | 20 |
| 2 | 0.45~0.52 | 50 | |||
| 3 | 0.52~0.60 | 50 | |||
| 4 | 0.63~0.69 | 50 | |||
| 5 | 0.76~0.90 | 50 | |||
| 中波红外(MWIR) | 6 | 3.50~4.10 | 400 |
注: 表中数据均来自中国资源卫星应用中心 |
表2 2020年GF-4卫星绝对辐射定标系数和大气层外波段太阳辐照度Tab. 2 The values of Gain, offset and ESUN of GF-4 satellite in 2020 |
| 参数名称 | Panchromatic Band | Band 1 | Band 2 | Band 3 | Band 4 |
|---|---|---|---|---|---|
| 绝对定标系数增益值 | 0.1266 | 0.1858 | 0.2013 | 0.1580 | 0.1087 |
| 绝对定标系数偏移值 | 0 | 0 | 0 | 0 | 0 |
| 太阳辐照度/(W•m-2•μm-1) | 1609.798 | 1929.556 | 1839.332 | 1578.125 | 1104.766 |
注: 表中数据均来自中国资源卫星应用中心 |
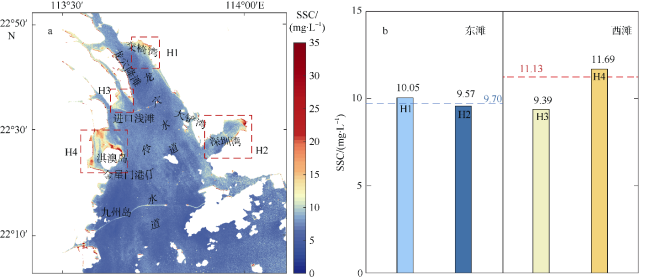
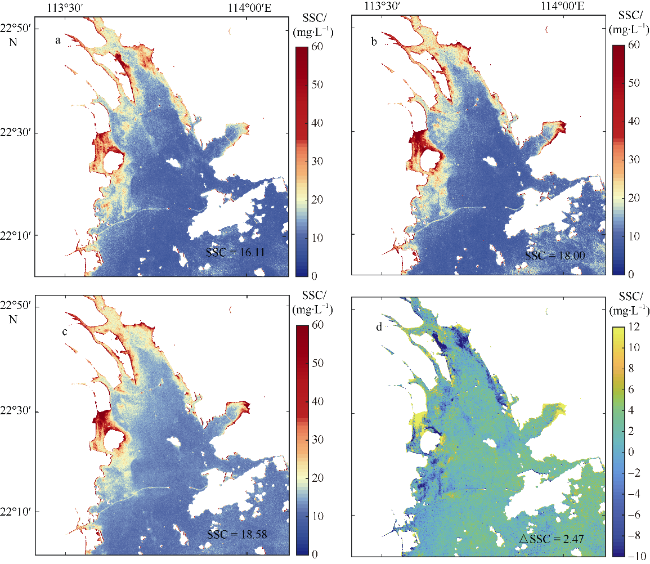
图3 2021年2月21日珠江口伶仃洋涨潮时3景遥感影像反演的平均悬浮泥沙浓度(SSC)分布情况a. 高SSC区的分布范围。图中红色虚线方框代表SSC高值区的分布范围, 其中H1 (113°42′—113°47′E, 22°40′—22°45′N), H2 (113°54′—114°00′E, 22°24′—22°33′N), H3 (113°38′—113°42′E, 22°33′—22°37′N), H4 (113°33′E—113°40′E, 22°23′N—22°30′N); b. 珠江口伶仃洋东、西滩各高SCC区的平均SSC直方图。蓝色和红色虚线分别代表东滩和西滩的平均SSC Fig. 3 Spatial distribution of satellite-derived mean SSC during the flood tide in the Pearl River Estuary, showing the average SSC of three GF-4 images during 21st February 2021 |
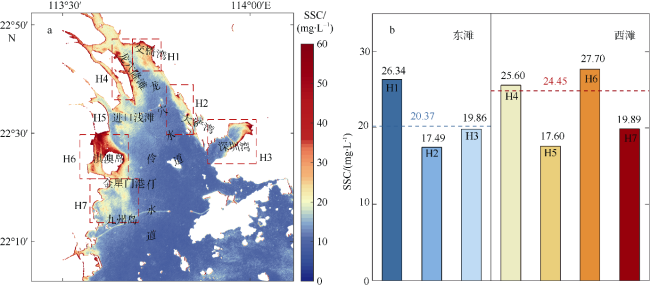
图4 2020年12月28日珠江口伶仃洋落潮时3景遥感影像反演的平均悬浮泥沙质量浓度(SSC)分布情况a. 高SSC区的分布范围。图中红色虚线方框代表SSC高值区的分布范围, 其中H1 (113°42′—113°47′E, 22°40′—22°45′N), H2 (113°54′—114°00′E, 22°24′—22°33′N), H3 (113°38′—113°42′E, 22°33′—22°37′N), H4 (113°33′E—113°40′E, 22°23′N—22°30′N), H5 (113°39′—113°44′E, 22°30′—22°35′N), H6 (113°33′—113°41′E, 22°23′—22°30′N), H7 (113°35′—113°42′E, 22°15′—22°23′N); b. 珠江口伶仃洋东西滩各高SCC区的平均SSC直方图。蓝色和红色虚线分别代表东滩和西滩的平均SSC Fig. 4 Spatial distribution of satellite-derived mean SSC during the ebb tide in the Pearl River Estuary, showing the average SSC of three GF-4 images during 28th December 2020 |
*感谢广东海洋大学刘大召老师提供现场观测数据, 感谢中国资源卫星应用中心(
| [1] |
陈晓玲, 袁中智, 李毓湘, 等, 2005. 基于遥感反演结果的悬浮泥沙时空动态规律研究--以珠江河口及邻近海域为例[J]. 武汉大学学报信息科学版, 30(8): 677-681.
|
| [2] |
国家海洋信息中心, 2020. 潮汐表(第3册): 台湾海峡至北部湾[M]. 北京: 海洋出版社.
NATIONAL MARINE DATA AND INFORMATION SERVICE, 2020. Tide tables (Vol. 3): from the Taiwan Straits to the Beibu Gulf[M]. Beijing: Ocean Press. (in Chinese)
|
| [3] |
李春初, 1997. 论河口体系及其自动调整作用--以华南河流为例[J]. 地理学报, 52(4): 353-360.
|
| [4] |
刘大召, 李卓, 陈仔豪, 等, 2020. 基于高分1号遥感数据港珠澳大桥对珠江口海域悬浮泥沙分布的影响[J]. 广东海洋大学学报, 40(6): 89-95.
|
| [5] |
刘汾汾, 陈楚群, 唐世林, 等, 2009. 基于现场光谱数据的珠江口MERIS悬浮泥沙分段算法[J]. 热带海洋学报, 28(1): 9-14.
|
| [6] |
刘凤晶, 李果, 于登云, 等, 2018. 高分四号卫星及应用概况[J]. 卫星应用, (12): 12-18. (in Chinese)
|
| [7] |
栾虹, 付东洋, 李明杰, 等, 2017. 基于Landsat 8珠江口悬浮泥沙四季遥感反演与分析[J]. 海洋环境科学, 36(6): 892-897.
|
| [8] |
谢梅芳, 张萍, 杨昊, 等, 2021. 珠江“伶仃洋河口湾-虎门-潮汐通道”的潮波传播特征[J]. 热带海洋学报, 40(4): 1-13.
|
| [9] |
詹伟康, 吴颉, 韦惺, 等, 2019. 基于遥感反演的珠江河口表层悬沙浓度分位数趋势分析[J]. 热带海洋学报, 38(3): 32-42.
|
| [10] |
朱樊, 欧素英, 张铄涵, 等, 2015. 基于MODIS影像的珠江口表层悬沙浓度反演及时空变化分析[J]. 泥沙研究, (2): 67-73.
|
| [11] |
|
| [12] |
|
| [13] |
|
| [14] |
|
| [15] |
|
| [16] |
|
| [17] |
|
| [18] |
|
| [19] |
|
| [20] |
|
| [21] |
|
| [22] |
|
| [23] |
|
| [24] |
|
| [25] |
|
| [26] |
|
| [27] |
|
| [28] |
|
| [29] |
|
| [30] |
|
| [31] |
|
| [32] |
|
| [33] |
|
| [34] |
|
| [35] |
|
| [36] |
|
| [37] |
|
| [38] |
|
| [39] |
|
| [40] |
|
| [41] |
|
| [42] |
|
| [43] |
|
| [44] |
|
| [45] |
|
| [46] |
|
| [47] |
|
/
| 〈 |
|
〉 |

