
南海东北部深层次的细结构观测与湍流混合研究*
*本研究的数据及样品采集得到国家自然科学基金委员会共享航次计划项目(42149905)的资助, 该航次(NORC2022-05)由“东方红3”号科考船实施, 在此一并致谢
|
朱小宇(2000—), 女, 山东省烟台市人, 硕士研究生, 从事湍流理论研究。email: zxy3319@stu.ouc.edu.cn |
Copy editor: 殷波
收稿日期: 2024-10-23
修回日期: 2025-02-10
网络出版日期: 2025-03-03
基金资助
国家自然科学基金项目(61871354)
国家自然科学基金项目(6172780176)
Observations of fine-scale structure and study of turbulent mixing in the deep northeastern South China Sea*
Received date: 2024-10-23
Revised date: 2025-02-10
Online published: 2025-03-03
Supported by
National Natural Science Foundation of China(61871354)
National Natural Science Foundation of China(6172780176)
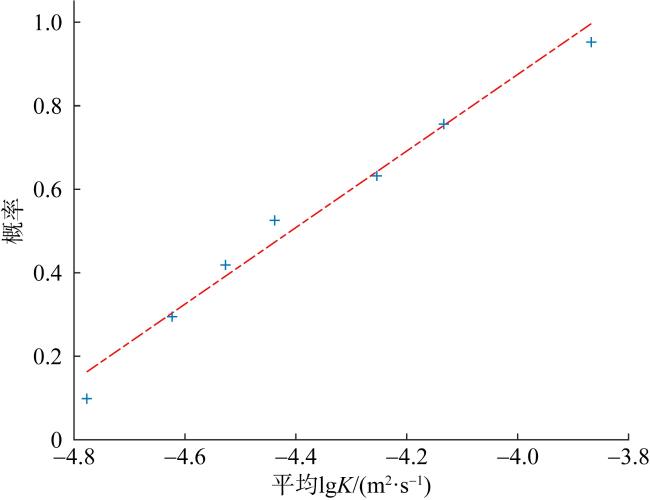
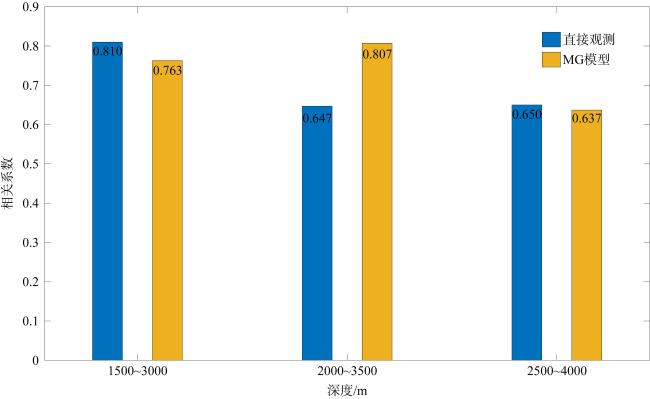
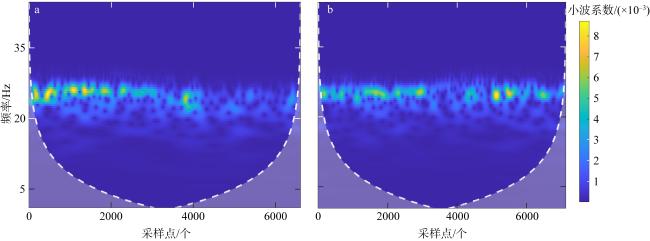
基于2022年南海H2站位(17°N, 116°E)直接观测的4000m湍流数据, 对南海东北部的湍流混合参数(包括湍动能耗散率、混合率、Thorpe尺度等)的垂向分布进行综合化研究。混合率与Thorpe尺度分别从湍流耗散和水体翻转角度表征湍流混合强度, 二者在1500~4000m深度每500m的平均参数波动一致, 呈现大-小-大-小的4层分布(反z形), 具有高相关性。文章采用MacKinnon-Gregg参数化模型对此站位进行了良好估算, 发现估算的混合率和Thorpe尺度间整体相关系数也高于0.7。基于二者的相关系数分布, 分别挑选混合率和Thorpe尺度强相关(1755m)和弱相关(3785m)区域进行小波分析, 发现强相关区域的能量多尺度级串更加剧烈, 证明参数间的相关系数确可用于识别真实的湍流混合, 有效去除仪器和海洋环境造成的虚假误差。
朱小宇 , 杨华 , 毛蓓蓓 , 郑雨轩 . 南海东北部深层次的细结构观测与湍流混合研究*[J]. 热带海洋学报, 2025 , 44(5) : 22 -30 . DOI: 10.11978/2024201
Based on direct turbulence measurements at 4000 m depth from Station H2 (17°N, 116°E) in the South China Sea in 2022, this study comprehensively investigates the vertical distribution and correlation of turbulent mixing parameters — including turbulent kinetic energy dissipation rate, mixing rate, Thorpe scale — in the northeastern South China Sea. The mixing rate and Thorpe scale characterize the turbulent mixing intensity from the perspectives of turbulent dissipation and water mass overturning, respectively. Both parameters exhibit consistent average fluctuations every 500 m in the 1500~4000 m depth range, diaplaying a four-layer “big-small-big-small” distribution (inverse z-shaped) with high correlation. The MacKinnon-Gregg parameterization model was applied to this station, yielding reliable estimates, with an overall correlation coefficient exceeding 0.7 between the estimated mixing rate and Thorpe scale. Based on their correlation coefficient distribution, we select depths with strong (1755 m) and weak (3785 m) correlations between the mixing rate and Thorpe scale for wavelet analysis. The results reveal more intense multi-scale energy cascade in regions of strong correlation, demonstrating that the correlation coefficient between parameters can effectively identify genuine turbulent mixing and filter out false errors caused by instrument noise or environmental factors. By combining fine-structure direct observations with parameterization methods, this study provides valuable insights into turbulence observation, the vertical distribution of mixing parameters and the evolution mechanisms of turbulent mixing in the middle and deep layers of the South China Sea.
图1 站点位置图基于自然资源部标准地图服务网站下载的审图号为GS(2023)2762号的标准地图制作。图中“▲”为2022年秋季H2测站位置 Fig. 1 Location map of the station. The “▲” marks the location of the H2 station in autumn 2022 |
表1 湍流传感器参数Tab. 1 Parameters of turbulence sensor |
| 名称 | 性能参数 |
|---|---|
| 采样频率/Hz | 1000 |
| 响应时间/ms | 1 |
| 空间分辨率/mm | 0.35 |
| 剪切流灵敏度/(V·m·s2·kg-1) | 2.68×10⁻² |
| 耗散率测量范围/(W·kg-1) | 1×10-11~1×10⁻⁴ |
图3 H2站位的直接观测的参数面积图a. 浮力频率; b. 耗散率; c. 混合率; d. Thorpe尺度的计算结果(均平滑后)。图中的橘色虚线对应的深度分别为1755m和3785m Fig. 3 Area plots of parameters from direct observations at station H2. (a) Buoyancy frequency |
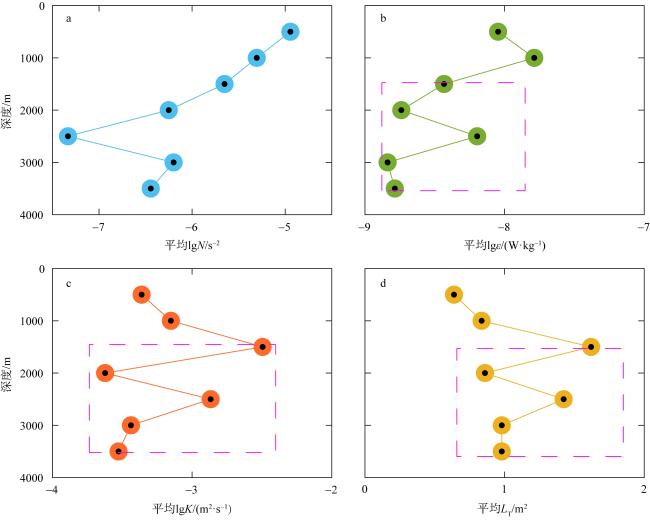
图5 直接观测的平均参数分布a. 浮力频率; b. 耗散率; c. 混合率; d. Thorpe尺度。图中“●”表示7个深度段的平均参数值, 纵坐标为每个500m的深度区间上限; 粉色虚线框对应1500~4000m的参数分布 Fig. 5 Distribution of average parameters from direct observation. (a) Buoyancy frequency; (b) dissipation rate; (c) mixing rate; (d) Thorpe scale. The “●” marks represent average parameter values from seven depth segments, with the ordinate showing the upper limit of each 500 m depth interval. The rectangular box highlights parameter distributions between 1500~4000 m |
图8 两个深度段的小波谱a. 1755~1760m; b. 3785~3790m。此处采用的是Haar小波进行的连续小波变换(continuous wavelet transform, CWT) Fig. 8 Wavelet spectra of two depth segments. (a) 1755~1760 m; (b) 3785~3790 m. Continuous wavelet transform (CWT) using Haar wavelet is applied here. The x, y, and z axes represent time, frequency, and wavelet coefficient values respectively |
| [1] |
陈子飞, 于非, 王建丰, 等, 2021. 吕宋海峡不同湍流估算方法的应用对比研究[J]. 海洋与湖沼, 52(1): 27-38.
|
| [2] |
康建军, 邬海强, 杨庆轩, 等, 2007. 海洋湍流观测技术[J]. 海洋技术, 26(3): 19-23.
|
| [3] |
李敏, 2013. 基于Thorpe尺度对南海深层混合的研究[D]. 青岛: 中国海洋大学.
|
| [4] |
尚晓东, 卢著敏, 谢晓辉, 等, 2010. 海洋湍流与海洋混合研究及其进展[C]// 第八届全国实验流体力学学术会议论文集. 北京: 海洋出版社: 123-130.
|
| [5] |
孙斌, 周慧, 汪嘉宁, 等, 2024. 北太平洋低纬度西边界流系湍流混合的微观结构测量和参数化方法评估[J]. 海洋与湖沼, 55(1): 1-15.
|
| [6] |
|
| [7] |
|
| [8] |
|
| [9] |
|
| [10] |
|
| [11] |
|
| [12] |
|
| [13] |
|
| [14] |
|
| [15] |
|
| [16] |
|
| [17] |
|
| [18] |
|
| [19] |
|
| [20] |
|
| [21] |
|
| [22] |
|
| [23] |
|
| [24] |
|
| [25] |
|
| [26] |
|
| [27] |
|
| [28] |
|
/
| 〈 |
|
〉 |


